. 2018 Apr 21;15(1):119.
doi: 10.1186/s12974-018-1157-x.

Acute dose of melatonin via Nrf2 dependently prevents acute ethanol-induced neurotoxicity in the developing rodent brain

Affiliations

Acute dose of melatonin via Nrf2 dependently prevents acute ethanol-induced neurotoxicity in the developing rodent brain

Tahir Ali et al. J Neuroinflammation. .

Abstract

Background: Melatonin is a well-known potent endogenous antioxidant pharmacological agent with significant neuroprotective actions. Here in the current study, we explored the nuclear factor erythroid 2-related factor 2 (Nrf2) gene-dependent antioxidant mechanism underlying the neuroprotective effects of the acute melatonin against acute ethanol-induced elevated reactive oxygen species (ROS)-mediated neuroinflammation and neurodegeneration in the developing rodent brain.

Methods: In vivo rat pups were co-treated with a single dose of acute ethanol (5 g/kg, subcutaneous (S.C.)) and a single dose of acute melatonin (20 mg/kg, intraperitoneal (I.P.)). Four hours after a single S.C. and I.P. injections, all of the rat pups were sacrificed for further biochemical (Western blotting, ROS- assay, LPO-assay, and immunohistochemical) analyses. In order to corroborate the in vivo results, we used the in vitro murine-hippocampal HT22 and microglial BV2 cells, which were subjected to knockdown with small interfering RNA (siRNA) of Nrf2 genes and exposed with melatonin (100 μM) and ethanol (100 mM) and proceed for further biochemical analyses.

Results: Our biochemical, immunohistochemical, and immunofluorescence results demonstrate that acute melatonin significantly upregulated the master endogenous antioxidant Nrf2 and heme oxygenase-1, consequently reversing the acute ethanol-induced elevated ROS and oxidative stress in the developing rodent brain, and in the murine-hippocampal HT22 and microglial BV2 cells. In addition, acute melatonin subsequently reduced the activated MAPK-p-P38-JNK pathways and attenuated neuroinflammation by decreasing the expression of activated gliosis and downregulated the p-NF-K-B/p-IKKβ pathway and decreased the expression levels of other inflammatory markers in the developing rodent brain and BV2 cells. Of note, melatonin acted through the Nrf2-dependent mechanism to attenuate neuronal apoptosis in the postnatal rodent brain and HT22 cells. Immunohistofluorescence results also showed that melatonin prevented ethanol-induced neurodegeneration in the developing rodent brain. The in vitro results indicated that melatonin induced neuroprotection via Nrf2-dependent manner and reduced ethanol-induced neurotoxicity.

Conclusions: The pleiotropic and potent neuroprotective antioxidant characteristics of melatonin, together with our in vivo and in vitro findings, suppose that acute melatonin could be beneficial to prevent and combat the acute ethanol-induced neurotoxic effects, such as elevated ROS, neuroinflammation, and neurodegeneration in the developing rodent brain.

Keywords: Ethanol; MAPK-p-P38-JNK pathway; Melatonin; Neurodegeneration; Neuroinflammation; Neurotoxicity; Nuclear factor erythroid 2-related factor 2 (Nrf2); ROS/oxidative stress; p-NF-K-B/p-IKKβ pathway.


Conflict of interest statement

Ethics approval

All the experiments with animal and other experimental protocols and procedures were approved (Approval ID: 125) by the Ethics Review Committee of the Gyeongsang National University, Republic of Korea.

Competing interests

The authors declare that they have no competing interests.

Publisher’s Note

Springer Nature remains neutral with regard to jurisdictional claims in published maps and institutional affiliations.

Figures
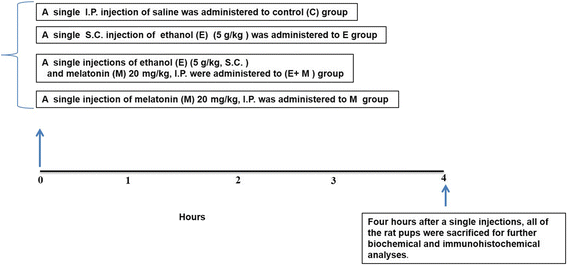
Fig. 1
Fig. 1
Schematic representation of the in vivo study design. Randomly selected male and female Sprague-Dawley postnatal day 7 rat pups of average body weight (18 g) were used (n = 15 pups/group). The postnatal rats were divided into the following groups: (1) Rat pups treated with a single intraperitoneal (I.P.) injection of saline as a vehicle, grouped as control (C). (2) Rat pups treated with a single dose of ethanol (E) (5 g/kg, subcutaneous (S.C.)), grouped as E. (3) Rat pups co-treated with a single dose of ethanol (5 g/kg, (S.C.)) and a single dose of melatonin (20 mg/kg, I.P.), grouped as E + M. (4) Rat pups treated with a single dose of melatonin (M) 20 mg/kg, I.P., grouped as M. Four hours after a single S.C. and I.P. injections, all of the rat pups were sacrificed for further biochemical and immunohistochemical analyses
Fig. 2
Fig. 2
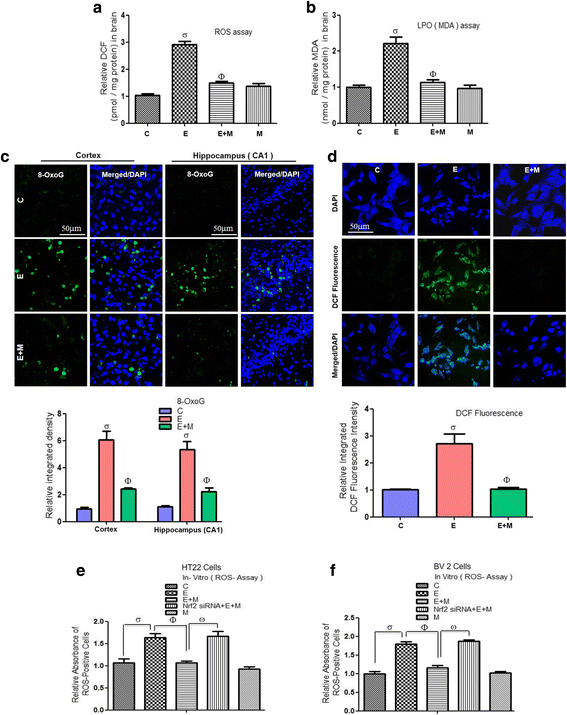
Acute melatonin attenuated the acute ethanol-induced increase in ROS and oxidative stress in the rat pups and in HT22 and BV2 cells. a A representative histogram of the ROS level in the brain homogenates of the rat pups. b A representative histogram of the MDA level in the brain homogenates of the rat pups. n = 10 pups/group, and the number of experiments = 3. c Representative image of immunofluorescence staining of 8-OxoG in the cortices and CA1 regions of the hippocampi in the rat pups. n = 5 pups/group, and the number of experiments = 3. Magnification × 40. Scale bar = 50 μm. d Representative images of the DCF immunofluorescence intensity in the HT22 cells. The number of experiments = 3. Magnification × 40. Scale bar = 50 μm. e, f A representative histogram of the relative absorbance of ROS-positive HT22 and BV2 cells respectively that were subjected to Nrf2 siRNA and treated with ethanol (100 mM) and melatonin (100 μM) for 12 h. The number of experiments = 3. The data are expressed as the mean ± SEM. The data are presented relative to control values. Significance = P < 0.05. σ Significantly different from the control saline-treated rat pups; Φ significantly different from the ethanol-treated rat pups. Similarly for in vitro studies, σ significantly different from the non-treated HT22 and BV2 cells, Φ significantly different from the ethanol-exposed HT22 and BV2 cells, and ω significantly different from the ethanol + melatonin-exposed HT22 and BV2 cells
Fig. 3
Fig. 3
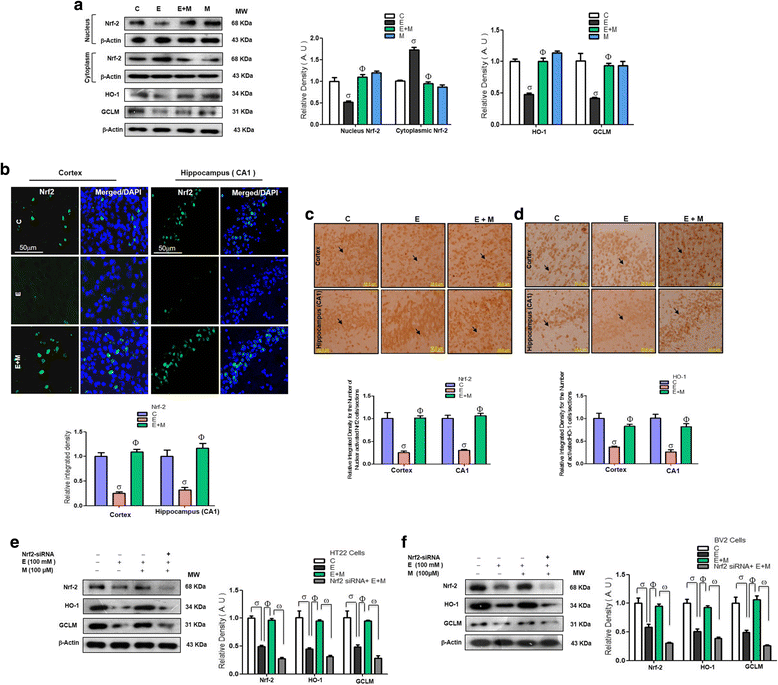
Acute melatonin treatment upregulated Nrf2/HO-1/GCLM expression in the acute ethanol-treated rat pups and in HT22 and BV2 cells that were exposed to ethanol. a Western blot analysis of nuclear/cytosolic Nrf2 expression using Nrf2, HO-1, and GCLM antibodies in the rat pups. The bands were quantified using Sigma Gel software, and the differences are presented in a histogram. β-Actin was used as a loading control. n = 10 pups/group, and the number of experiments = 3. b Representative immunofluorescence results of Nrf2 (FITC, DAPI, Blue) and c, d immunohistochemical results of Nrf2 and HO-1 respectively in the cortices and CA1 regions of the hippocampi in the rat pups. n = 5 pups/group, and the number of experiments = 3. Magnification × 20. Scale bar = 50 μm. e, f Western blots and the densitometric analysis of the Nrf2, HO-1, and GCLM expression in the HT22 and BV2 cells respectively that were subjected to Nrf2 siRNA and treated with ethanol (100 mM) and melatonin (100 μM) for 12 h. β-actin was used as a loading control. The data are expressed as the mean ± SEM, and the number of experiments = 3. The data are presented relative to control values. Significance = P < 0.05. σ Significantly different from the control saline-treated rat pups; Φ significantly different from the ethanol-treated rat pups. Similarly for in vitro studies, σ significantly different from the non-treated HT22 and BV2 cells; Φ significantly different from the ethanol-exposed HT22 and BV2 cells, and ω significantly different from the ethanol + melatonin-exposed HT22 and BV2 cells
Fig. 4
Fig. 4
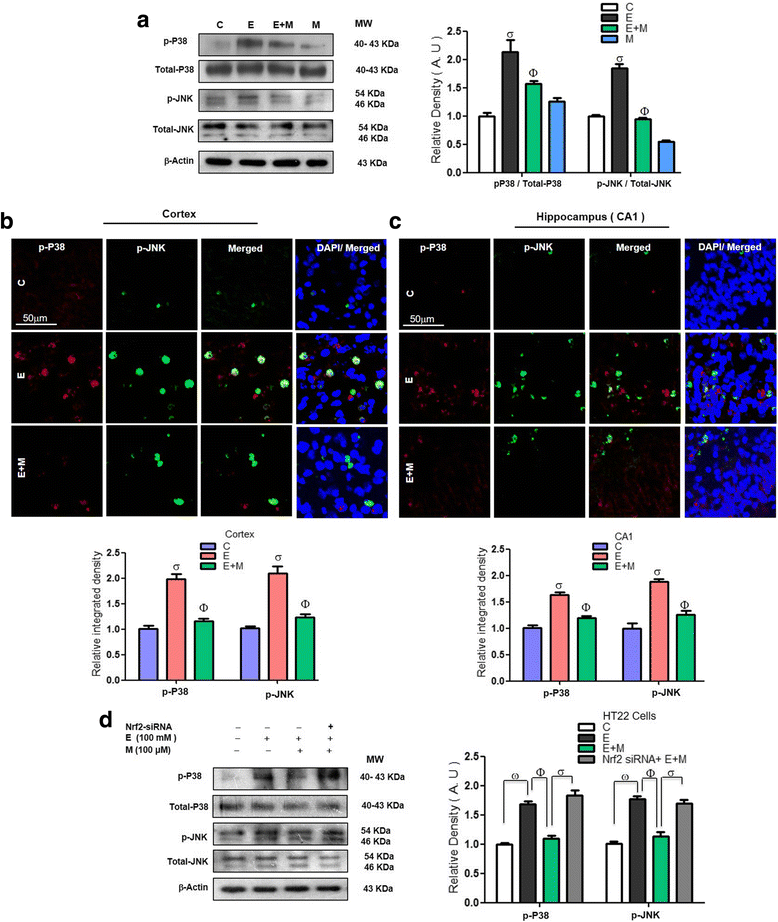
Acute melatonin prevents the acute ethanol-induced activation of the MAPK p-P38/p-JNK pathway in the rat pups and in HT22 cells that were exposed to ethanol. a Western blot results of p-P38, total P-38, p-JNK, and total JNK in the rat pups. The bands were quantified using Sigma Gel software, and the differences are presented in a histogram. β-Actin was used as a loading control. n = 10 pups/group, and the number of experiments = 3. b, c Representative images of the co-localized immunofluorescence reactivity of p-P38 and p-JNK in the cortices and CA1 regions of the hippocampi in the rat pups. n = 5 pups/group, and the number of experiments = 3. Magnification × 40. Scale bar = 50 μm. d Western blots and the densitometric analysis of p-P38, total P-38, p-JNK, and total JNK expression in the HT22 cells that were subjected to Nrf2 siRNA and treated with ethanol (100 mM) and melatonin (100 μM) for 12 h. β-Actin was used as a loading control. The data are expressed as the mean ± SEM, and the number of experiments = 3. The data are presented relative to control values. Significance = P < 0.05. σ Significantly different from the control saline-treated rat pups; Φ significantly different from the ethanol-treated rat pups. Similarly for in vitro studies, σ significantly different from the non-treated HT22 cells, Φ significantly different from the ethanol-exposed HT22 cells, and ω significantly different from the ethanol+melatonin-exposed HT22 cells
Fig. 5
Fig. 5
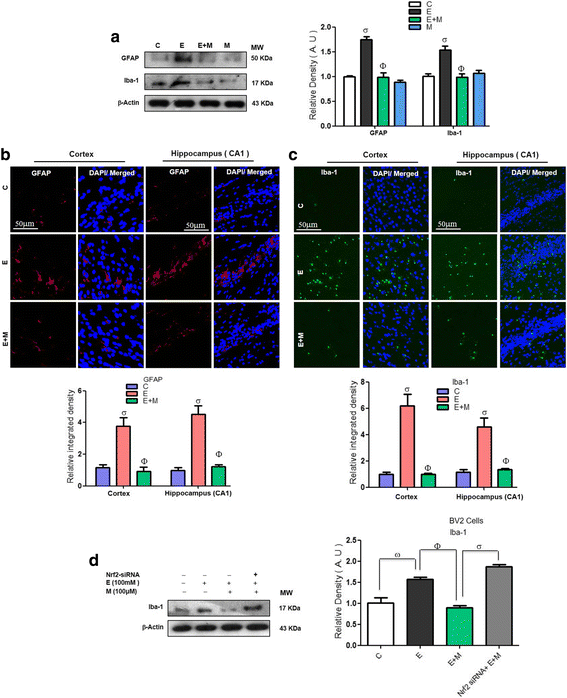
Acute melatonin reduced the level of activated gliosis in the acute ethanol-treated rat pups and activated microglia in the BV2 cells that were exposed to ethanol. a Western blot analysis of GFAP and Iba-1 in the rat pups. The bands were quantified using Sigma Gel software, and the differences are presented in a histogram. β-actin was used as a loading control. n = 10 pups/group, and the number of experiments = 3. b, c Representative images showing the immunofluorescence analysis of GFAP and Iba-1 in the cortices and the CA1 regions of the hippocampi in the rat pups, respectively. n = 5 pups/group, and the number of experiments = 3. Magnification × 40. Scale bar = 50 μm. d Western blots and the densitometric analysis of Iba-1 expression in the BV2 cells that were subjected to Nrf2 siRNA and treated with ethanol (100 mM) and melatonin (100 μM) for 12 h. β-Actin was used as a loading control. The number of experiments = 3. The data are expressed as the mean ± SEM. The data are presented relative to control values. Significance = P < 0.05. σ Significantly different from the control saline-treated rat pups; Φ significantly different from the ethanol-treated rat pups. Similarly for in vitro studies, σ significantly different from the non-treated BV2 cells; Φ significantly different from the ethanol-exposed BV2 cells, and ω significantly different from the ethanol + melatonin-exposed BV2 cells
Fig. 6
Fig. 6
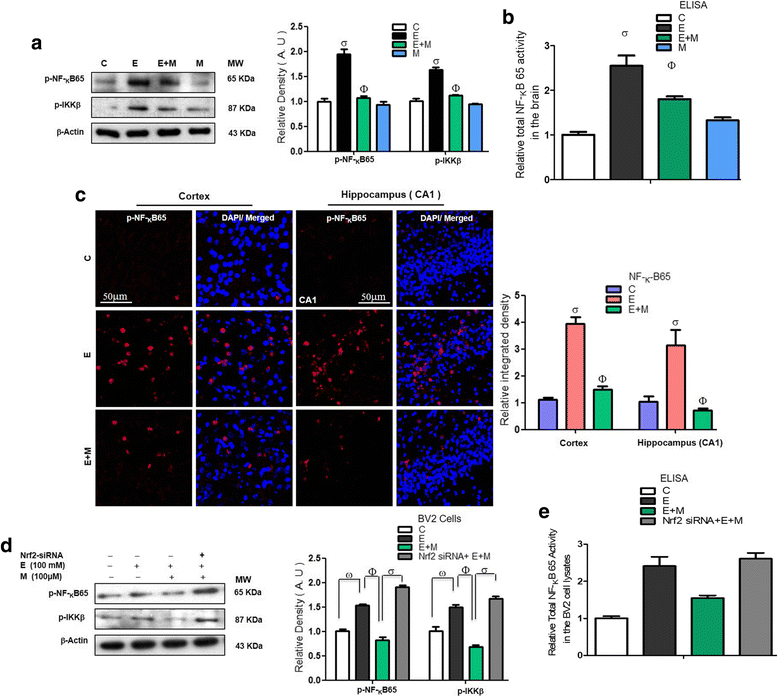
Acute melatonin reduced the level of activated p-NF-KB/p-IKKβ in the acute ethanol-treated rat pups and in BV2 cells that were exposed to ethanol. a Western blot analysis of p-NF-KB65 and p-IKKβ in the rat pups. The bands were quantified using Sigma Gel software, and the differences are presented in a histogram. β-Actin was used as a loading control. n = 10 pups/group, and the number of experiments = 3. b Representative histogram indicates the ELISA analysis of NF-KBp65 level in the brain homogenates of the rat pups. n = 10 pups/group, and the number of experiments = 3. c Representative image of the p-NF-KB65 immunofluorescence reactivity in the cortices and CA1 regions of the hippocampi in the rat pups. n = 5 pups/group, and the number of experiments = 3. Magnification × 40, Scale bar = 50 μm. d Western blots and the densitometric analysis of the NF-KB and IKKβ expression levels in the BV2 cells that were subjected to Nrf2 siRNA and treated with ethanol (100 mM) and melatonin (100 μM) for 12 h. β-actin was used as a loading control. The data are expressed as the mean ± SEM. e A representative histogram indicates the ELISA analysis of NF-KBp65 level in the BV2 cells that were subjected to Nrf2 siRNA and treated with ethanol (100 mM) and melatonin (100 μM) for 12 h. The number of experiments = 3. The data are expressed as the mean ± SEM. The data are presented relative to control values. Significance = P < 0.05. σ Significantly different from the control saline-treated rat pups; Φ significantly different from the ethanol-treated rat pups. Similarly for in vitro studies, σ significantly different from the non-treated BV2 cells; Φ significantly different from the ethanol-exposed BV2 cells, and ω significantly different from the ethanol+melatonin-exposed BV2 cells
Fig. 7
Fig. 7
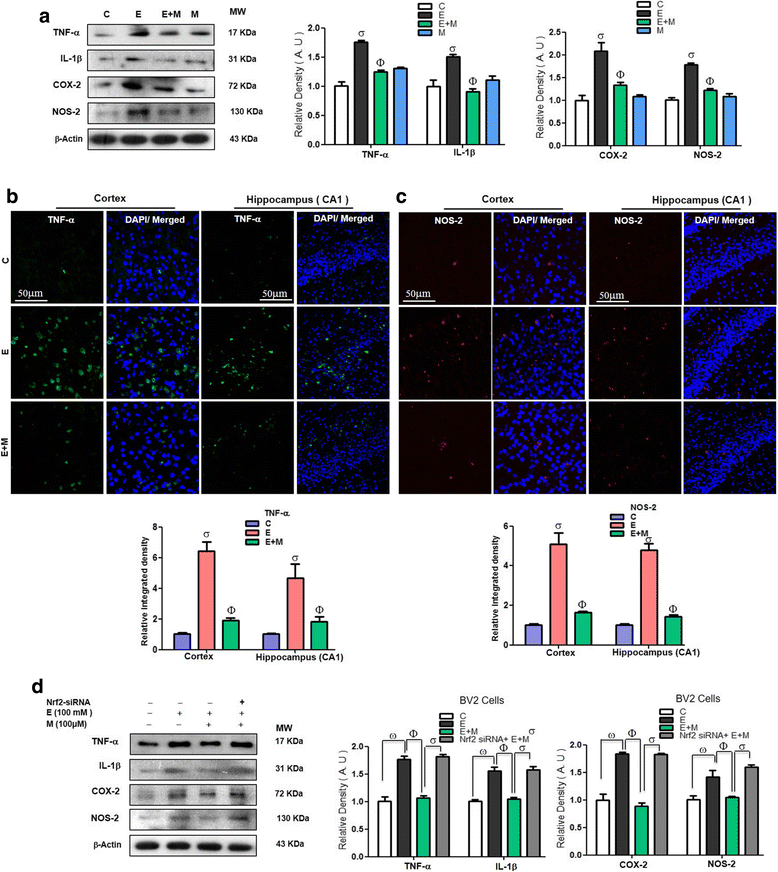
Acute melatonin attenuated the various inflammatory mediators in the acute ethanol-treated rat pups and in BV2 cells that were exposed to ethanol. a The western blot analysis of TNF-α, IL-1β, COX-2, and NOS-2 in the rat pups. The bands were quantified using Sigma Gel software, and the differences are represented by a histogram. β-Actin was used as a loading control. n = 10 pups/group, and the number of experiment = 3. b, c The representative image shows immunofluorescence reactivity of TNF-α and NOS-2 in the cortices and CA1 region of the hippocampi in the rat pups. n = 5 pups/group, and the number of experiments = 3. Magnification × 40, scale bar = 50 μm. d Western blots and the densitometric analysis of TNF-α, IL-1β, COX-2, and NOS-2 expression levels in the BV2 cells that were subjected to Nrf2 siRNA and treated with ethanol (100 mM) and melatonin (100 μM) for 12 h. β-Actin was used as a loading control. The number of experiments = 3. The data are expressed as the mean ± SEM. The data are presented relative to control values. Significance = P < 0.05. σ Significantly different from the control saline-treated rat pups; Φ significantly different from the ethanol-treated rat pups. Similarly for in vitro studies, σ significantly different from the non-treated BV2 cells; Φ significantly different from the ethanol-exposed BV2 cells, and ω significantly different from the ethanol+melatonin-exposed BV2 cells
Fig. 8
Fig. 8
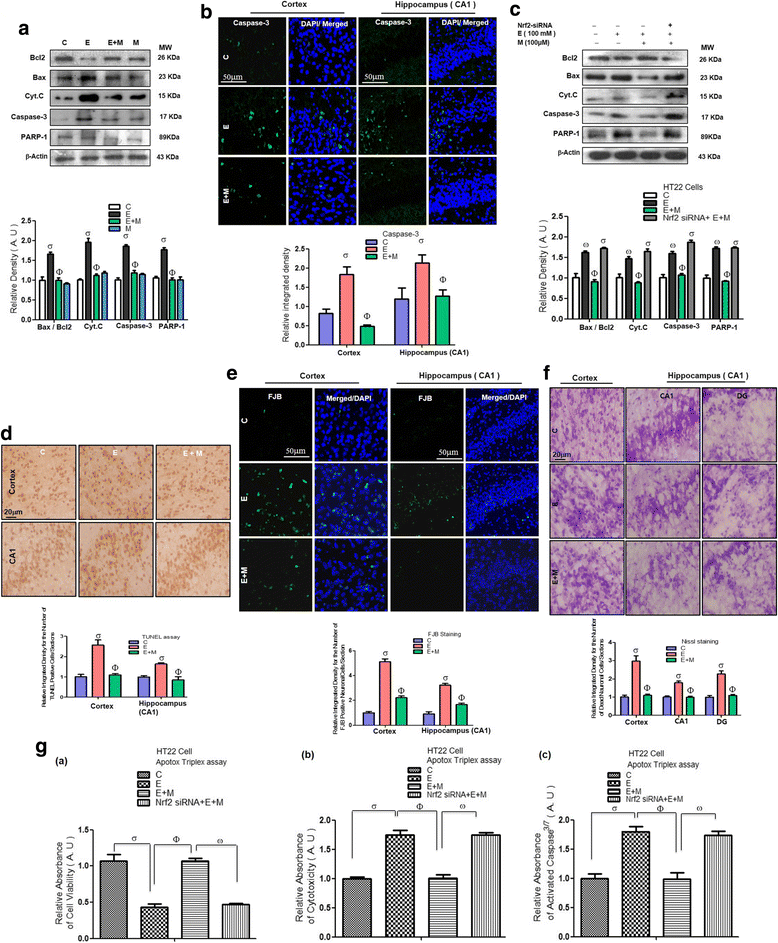
Acute melatonin attenuated the acute ethanol-induced apoptosis and neurodegeneration in vivo and in vitro ethanol-exposed HT22 neuronal cells. a Western blots analysis of Bax, Bcl2, Cyt.c, activated caspase-3 and PARP-1 antibodies. The bands were quantified using Sigma Gel software, and the differences are represented by a histogram. β-Actin was used as a loading control. n = 10 pups/group, and the number of experiments = 3. b Western blots and the densitometric analysis of Bax, Bcl2, Cyt.c, activated caspase-3 and PARP-1 expression levels in the HT22 cells that were subjected to Nrf2 siRNA and treated with ethanol (100 mM) and melatonin (100 μM) for 12 h. β-Actin was used as a loading control. The number of experiments = 3. c The representative image shows immunofluorescence reactivity of activated caspase-3 in the cortices and CA1 regions of the hippocampi in the rat pups. n = 5 pups/group, and the number of experiments = 3. Magnification × 40. Scale bar = 50 μm. d Shown images indicate the TUNEL immunohistochemical staining in the cortices and CA1 regions of the hippocampi in the rat pups. n = 5 pups/group, and the number of experiments = 3. Magnification × 20. Scale bar = 20 μm. e Shown images indicate the FJB immunohistochemical staining in the cortices and CA1 regions of the hippocampi in the rat pups. n = 5 pups/group, and the number of experiments = 3. Magnification × 40. Scale bar = 50 μm. f Representative photomicrograph of Nissl staining in the cortices; and DG and CA1 regions of the hippocampi in the rat pups. n = 5 pups/group, and the number of experiments = 3. Magnification × 20. Scale bar = 20 μm. g Apo-Tox Glo™ assay in the neuronal HT22 cells using Nrf2 siRNA. (a–c) The cell viability, cytotoxicity and activation of caspase-3/7 respectively in the HT22 cells that were subjected to Nrf2 siRNA and treated with ethanol (100 mM) and melatonin (100 μM) for 12 h. The number of experiments = 3. The data are expressed as the mean ± SEM. The data are presented relative to control values. Significance = P < 0.05. σ Significantly different from the control saline-treated rat pups; Φ significantly different from the ethanol-treated rat pups. Similarly for in vitro studies, σ significantly different from the non-treated HT22 cell; Φ significantly different from the ethanol-exposed HT22 cells and ω significantly different from the ethanol + melatonin-exposed HT22 cells

Similar articles

Cited by

References

    1. Ikonomidou C, Bittigau P, Ishimaru MJ, Wozniak DF, Koch C, Genz K, Price MT, Stefovska V, Horster F, Tenkova T, Dikranian K, Olney JW. Ethanol-induced apoptotic neurodegeneration and the fetal alcohol syndrome. Science. 2000;287:1056–1060. doi: 10.1126/science.287.5455.1056. - DOI - PubMed
    1. Olney JW, Isimaru MJ, Bittigau P, Ikonomidou C. Ethanol-induced apoptotic neurodegeneration in the developing brain. Apoptosis. 2000;5:515–521. doi: 10.1023/A:1009685428847. - DOI - PubMed
    1. Liang F, Diao L, Liu J, Jiang N, Zhang J, Wang H, Zhou W, Huang G, Ma D. Paternal ethanol exposure and behavioral abnormities in offspring: associated alterations in imprinted gene methylation. Neuropharmacology. 2014;81:126–133. doi: 10.1016/j.neuropharm.2014.01.025. - DOI - PubMed
    1. Rojas-Mayorguin AE, Padilla-Velarde E, Ortuno-Sahagun D. Prenatal alcohol exposure in rodents as a promising model for the study of ADHD molecular basis. Front Neurosci. 2016;10:565. - PMC - PubMed
    1. Haorah J, Ramirez SH, Floreani N, Gorantla S, Morsey B, Persidsky Y. Mechanism of alcohol-induced oxidative stress and neuronal injury. Free Radic Biol Med. 2008;45:1542–1550. doi: 10.1016/j.freeradbiomed.2008.08.030. - DOI - PMC - PubMed

MeSH terms