

Modeling the Present and Future Incidence of Pediatric Hand, Foot, and Mouth Disease Associated with Ambient Temperature in Mainland China
- PMID: 29681142
- PMCID: PMC6071822
- DOI: 10.1289/EHP3062
Modeling the Present and Future Incidence of Pediatric Hand, Foot, and Mouth Disease Associated with Ambient Temperature in Mainland China
Abstract
Background: There is limited evidence about the association between ambient temperature and the incidence of pediatric hand, foot, and mouth disease (HFMD) nationwide in China.
Objectives: We examined the childhood temperature-HFMD associations across mainland China, and we projected the change in HFMD cases due to projected temperature change by the 2090s.
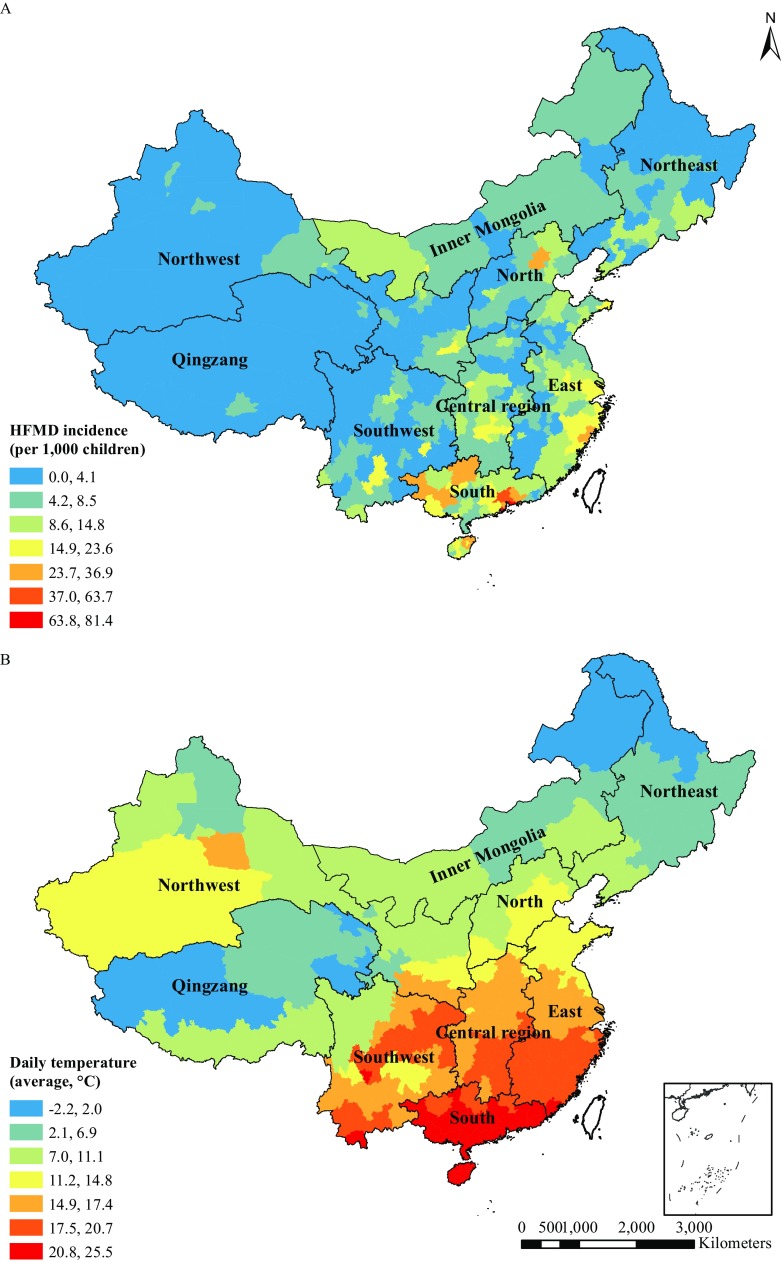
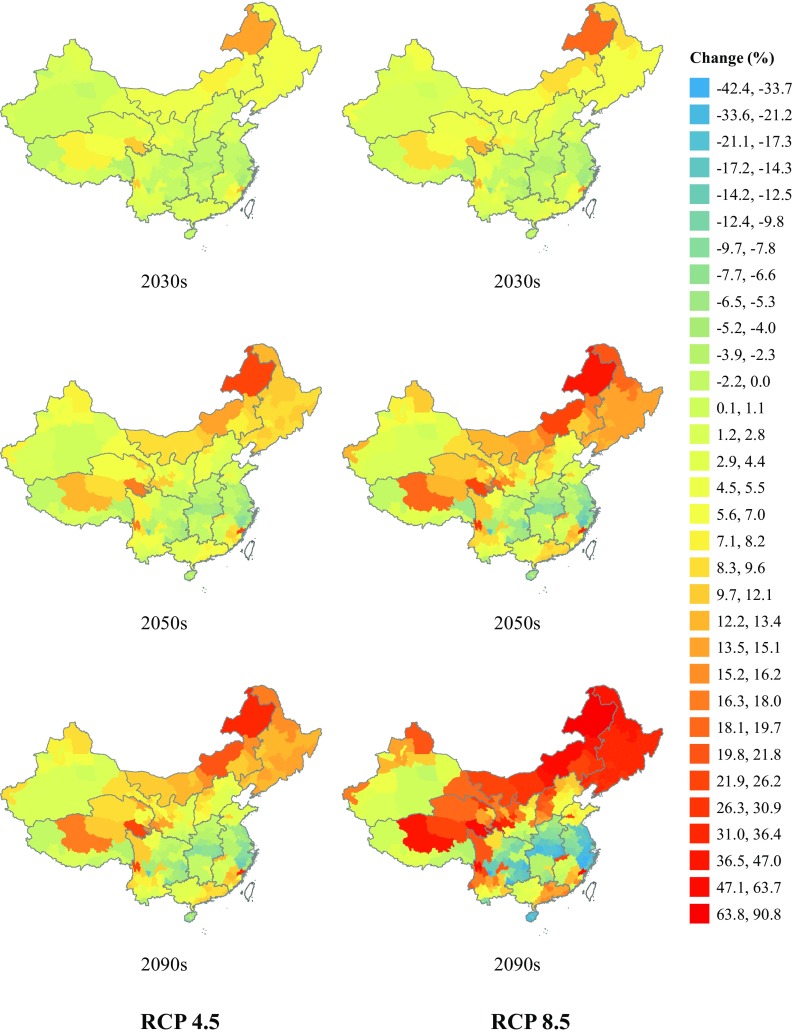
Methods: Data on daily HFMD (children 0-14 y old) counts and weather were collected from 362 sites during 2009-2014. Daily temperature by the 2090s was downscaled under the Representative Concentration Pathway (RCP) 4.5 and 8.5 scenarios. Temperature-HFMD associations were quantified using a two-stage Poisson regression with a distributed lag nonlinear model. The impact of changes in temperature on the incidence of HFMD was estimated by combining the fitted temperature-HFMD associations with projected temperatures under each scenario, assuming a constant population structure. Sensitivity analyses were performed to assess the influence of primary model assumptions.
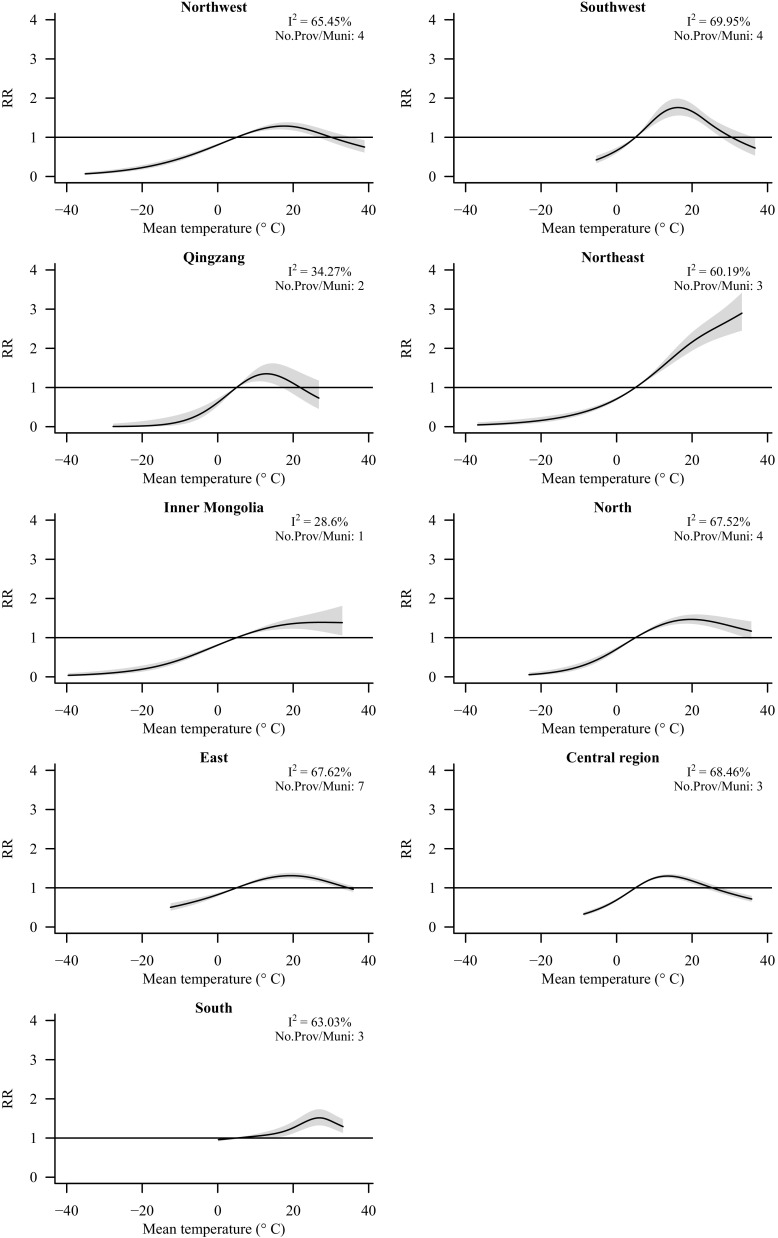
Results: During 2009-2014, >11 million HFMD cases were reported. In most regions, the temperature-HFMD association had an inverted U shape with a peak at approximately 20°C, but the association leveled off or continued to increase in the Inner Mongolia and Northeast regions. When estimates were pooled across all regions and the population size was held constant, the projected incidence of HFMD increased by 3.2% [95% empirical confidence interval (eCI): −13.5%, 20.0%] and 5.3% (95% eCI: −33.3%, 44.0%) by the 2090s under the RCP 4.5 and 8.5 scenarios, respectively. However, regional projections suggest that HFMD may decrease with climate change in temperate areas of central and eastern China.
Conclusion: Our estimates suggest that the association between temperature and HFMD varies across China and that the future impact of climate change on HFMD incidence will vary as well. Other factors, including changes in the size of the population at risk (children 0-14 y old) will also influence future HFMD trends. https://doi.org/10.1289/EHP3062.
Figures
Comment in
-
More Cases of Hand, Foot, and Mouth Disease in China: A Consequence of Climate Change?Environ Health Perspect. 2018 Sep;126(9):94002. doi: 10.1289/EHP3778. Environ Health Perspect. 2018. PMID: 30256156 Free PMC article. No abstract available.
Similar articles
-
Associations between extreme precipitation and childhood hand, foot and mouth disease in urban and rural areas in Hefei, China.Sci Total Environ. 2014 Nov 1;497-498:484-490. doi: 10.1016/j.scitotenv.2014.08.006. Epub 2014 Aug 23. Sci Total Environ. 2014. PMID: 25150743
-
Assessment of temperature effect on childhood hand, foot and mouth disease incidence (0-5years) and associated effect modifiers: A 17 cities study in Shandong Province, China, 2007-2012.Sci Total Environ. 2016 May 1;551-552:452-9. doi: 10.1016/j.scitotenv.2016.01.173. Epub 2016 Feb 15. Sci Total Environ. 2016. PMID: 26891011
-
Short-Term Effects of Climatic Variables on Hand, Foot, and Mouth Disease in Mainland China, 2008-2013: A Multilevel Spatial Poisson Regression Model Accounting for Overdispersion.PLoS One. 2016 Jan 25;11(1):e0147054. doi: 10.1371/journal.pone.0147054. eCollection 2016. PLoS One. 2016. PMID: 26808311 Free PMC article.
-
Association of Short-Term Exposure to Meteorological Factors and Risk of Hand, Foot, and Mouth Disease: A Systematic Review and Meta-Analysis.Int J Environ Res Public Health. 2020 Oct 30;17(21):8017. doi: 10.3390/ijerph17218017. Int J Environ Res Public Health. 2020. PMID: 33143315 Free PMC article.
-
Temperature and humidity affect the incidence of hand, foot, and mouth disease: a systematic review of the literature - a report from the International Society of Dermatology Climate Change Committee.Int J Dermatol. 2019 Apr;58(4):388-399. doi: 10.1111/ijd.14188. Epub 2018 Sep 5. Int J Dermatol. 2019. PMID: 30187452
Cited by
-
Impact of Temperature and Rainfall on Typhoid/Paratyphoid Fever in Taizhou, China: Effect Estimation and Vulnerable Group Identification.Am J Trop Med Hyg. 2021 Dec 6;106(2):532-542. doi: 10.4269/ajtmh.20-1457. Am J Trop Med Hyg. 2021. PMID: 34872055 Free PMC article.
-
More Cases of Hand, Foot, and Mouth Disease in China: A Consequence of Climate Change?Environ Health Perspect. 2018 Sep;126(9):94002. doi: 10.1289/EHP3778. Environ Health Perspect. 2018. PMID: 30256156 Free PMC article. No abstract available.
-
Impact of the coronavirus disease 2019 interventions on the incidence of hand, foot, and mouth disease in mainland China.Lancet Reg Health West Pac. 2022 Mar;20:100362. doi: 10.1016/j.lanwpc.2021.100362. Epub 2022 Jan 1. Lancet Reg Health West Pac. 2022. PMID: 35005671 Free PMC article.
-
Dynamic modeling and data fitting of climatic and environmental factors and people's behavior factors on hand, foot, and mouth disease (HFMD) in Shanghai, China.Heliyon. 2023 Jul 24;9(8):e18212. doi: 10.1016/j.heliyon.2023.e18212. eCollection 2023 Aug. Heliyon. 2023. PMID: 37576260 Free PMC article.
-
Seasonal Distribution and Meteorological Factors Associated with Hand, Foot, and Mouth Disease among Children in Xi'an, Northwestern China.Am J Trop Med Hyg. 2020 Jun;102(6):1253-1262. doi: 10.4269/ajtmh.19-0916. Am J Trop Med Hyg. 2020. PMID: 32157992 Free PMC article.
References
-
- Ahmad OB, Boschi-Pinto C, Lopez AD, Murray CJ, Lozano R, Inoue M. 2001. Age standardization of rates: A new WHO standard. http://www.who.int/healthinfo/paper31.pdf [accessed 20 May 2017].
Publication types
MeSH terms
LinkOut - more resources
Full Text Sources
Other Literature Sources
Medical
Molecular Biology Databases
