

Correlative Microscopy of Vitreous Sections Provides Insights into BAR-Domain Organization In Situ
- PMID: 29681471
- PMCID: PMC5992340
- DOI: 10.1016/j.str.2018.03.015
Correlative Microscopy of Vitreous Sections Provides Insights into BAR-Domain Organization In Situ
Abstract
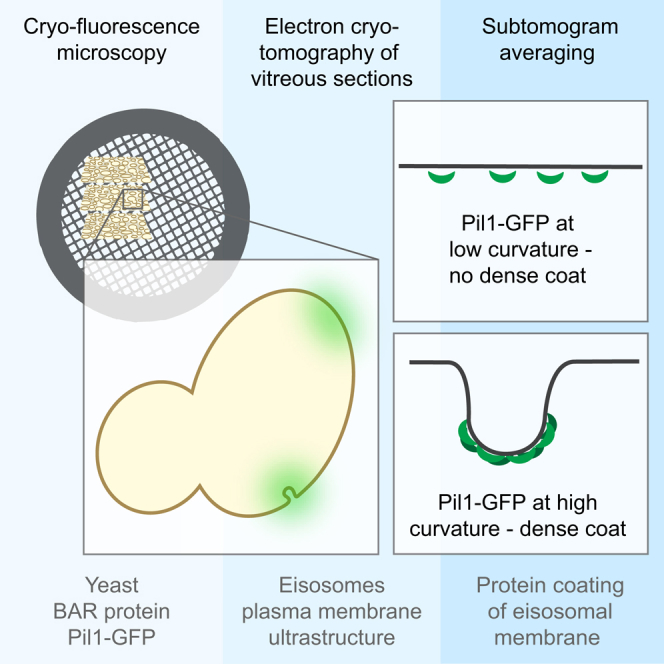
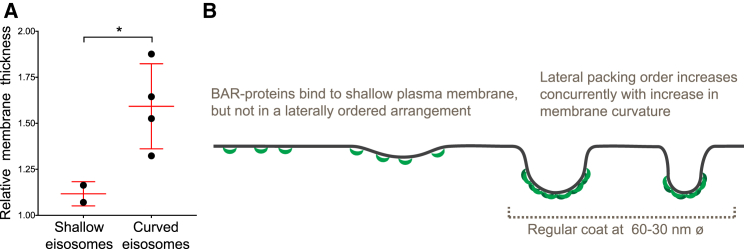
Electron microscopy imaging of macromolecular complexes in their native cellular context is limited by the inherent difficulty to acquire high-resolution tomographic data from thick cells and to specifically identify elusive structures within crowded cellular environments. Here, we combined cryo-fluorescence microscopy with electron cryo-tomography of vitreous sections into a coherent correlative microscopy workflow, ideal for detection and structural analysis of elusive protein assemblies in situ. We used this workflow to address an open question on BAR-domain coating of yeast plasma membrane compartments known as eisosomes. BAR domains can sense or induce membrane curvature, and form scaffold-like membrane coats in vitro. Our results demonstrate that in cells, the BAR protein Pil1 localizes to eisosomes of varying membrane curvature. Sub-tomogram analysis revealed a dense protein coat on curved eisosomes, which was not present on shallow eisosomes, indicating that while BAR domains can assemble at shallow membranes in vivo, scaffold formation is tightly coupled to curvature generation.
Keywords: BAR domains; CEMOVIS; correlative microscopy; cryo-CLEM; cryo-EM; eisosomes; electron cryo-tomography; vitreous sections.
Copyright © 2018 MRC Laboratory of Molecular Biology. Published by Elsevier Ltd.. All rights reserved.
Figures
Similar articles
-
Eisosome proteins assemble into a membrane scaffold.J Cell Biol. 2011 Nov 28;195(5):889-902. doi: 10.1083/jcb.201104040. J Cell Biol. 2011. PMID: 22123866 Free PMC article.
-
Eisosome-driven plasma membrane organization is mediated by BAR domains.Nat Struct Mol Biol. 2011 Jun 19;18(7):854-6. doi: 10.1038/nsmb.2080. Nat Struct Mol Biol. 2011. PMID: 21685922
-
Cryo-EM architecture of a near-native stretch-sensitive membrane microdomain.Nature. 2024 Aug;632(8025):664-671. doi: 10.1038/s41586-024-07720-6. Epub 2024 Jul 24. Nature. 2024. PMID: 39048819 Free PMC article.
-
Insights into eisosome assembly and organization.J Biosci. 2012 Jun;37(2):295-500. doi: 10.1007/s12038-012-9206-6. J Biosci. 2012. PMID: 22581335 Review.
-
Eisosomes.Curr Biol. 2018 Apr 23;28(8):R376-R378. doi: 10.1016/j.cub.2017.11.073. Curr Biol. 2018. PMID: 29689217 Free PMC article. Review.
Cited by
-
The Composition and the Structure of MCC/Eisosomes in Neurospora crassa.Front Microbiol. 2020 Sep 18;11:2115. doi: 10.3389/fmicb.2020.02115. eCollection 2020. Front Microbiol. 2020. PMID: 33071997 Free PMC article.
-
Definition of phosphatidylinositol 4,5-bisphosphate distribution by freeze-fracture replica labeling.J Cell Biol. 2025 Jan 6;224(1):e202311067. doi: 10.1083/jcb.202311067. Epub 2024 Nov 4. J Cell Biol. 2025. PMID: 39495319 Free PMC article.
-
Investigating eukaryotic cells with cryo-ET.Mol Biol Cell. 2020 Jan 15;31(2):87-100. doi: 10.1091/mbc.E18-05-0329. Mol Biol Cell. 2020. PMID: 31935172 Free PMC article.
-
Mechanisms of negative membrane curvature sensing and generation by ESCRT III subunit Snf7.Protein Sci. 2020 Jun;29(6):1473-1485. doi: 10.1002/pro.3851. Epub 2020 Mar 18. Protein Sci. 2020. PMID: 32142182 Free PMC article.
-
Locating macromolecules and determining structures inside bacterial cells using electron cryotomography.Biochim Biophys Acta Proteins Proteom. 2018 Sep;1866(9):973-981. doi: 10.1016/j.bbapap.2018.06.003. Epub 2018 Jun 13. Biochim Biophys Acta Proteins Proteom. 2018. PMID: 29908328 Free PMC article. Review.
References
-
- Ader N.R., Kukulski W. triCLEM: Combining high-precision, room temperature CLEM with cryo-fluorescence microscopy to identify very rare events. Methods Cell Biol. 2017;140:303–320. - PubMed
-
- Al-Amoudi A., Diez D.C., Betts M.J., Frangakis A.S. The molecular architecture of cadherins in native epidermal desmosomes. Nature. 2007;450:832–837. - PubMed
-
- Al-Amoudi A., Frangakis A.S. Three-dimensional visualization of the molecular architecture of cell-cell junctions in situ by cryo-electron tomography of vitreous sections. Methods Mol. Biol. 2013;961:97–117. - PubMed
Publication types
MeSH terms
Substances
Grants and funding
LinkOut - more resources
Full Text Sources
Other Literature Sources
Molecular Biology Databases
