. 2018 May 3;70(3):553-564.e9.
doi: 10.1016/j.molcel.2018.03.014. Epub 2018 Apr 19.

CapZyme-Seq Comprehensively Defines Promoter-Sequence Determinants for RNA 5' Capping with NAD<sup/>

Affiliations

CapZyme-Seq Comprehensively Defines Promoter-Sequence Determinants for RNA 5' Capping with NAD<sup/>

Irina O Vvedenskaya et al. Mol Cell. .

Abstract

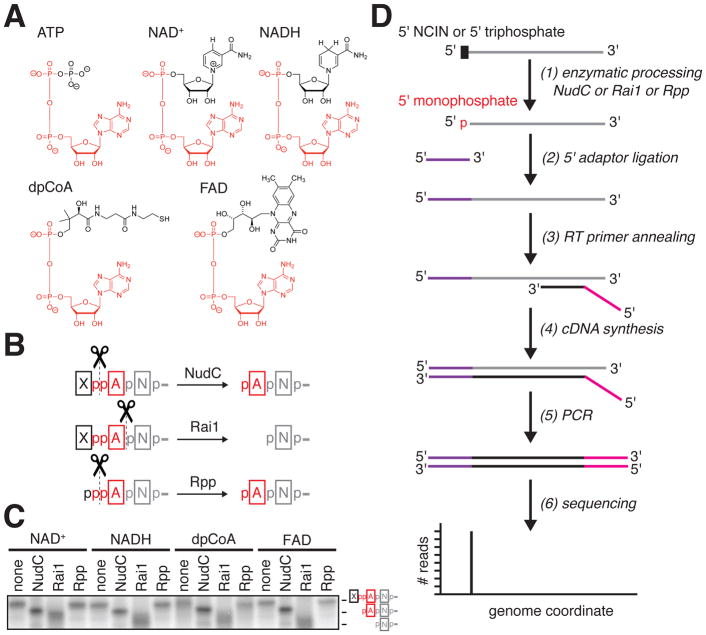
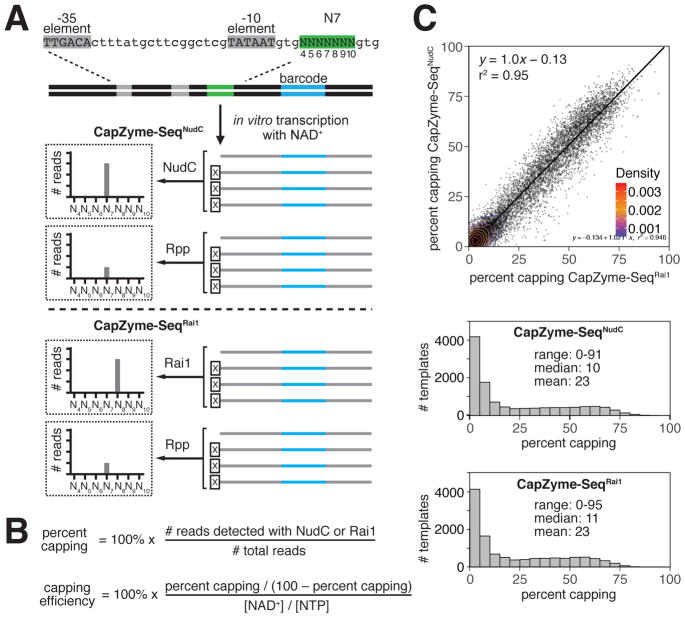
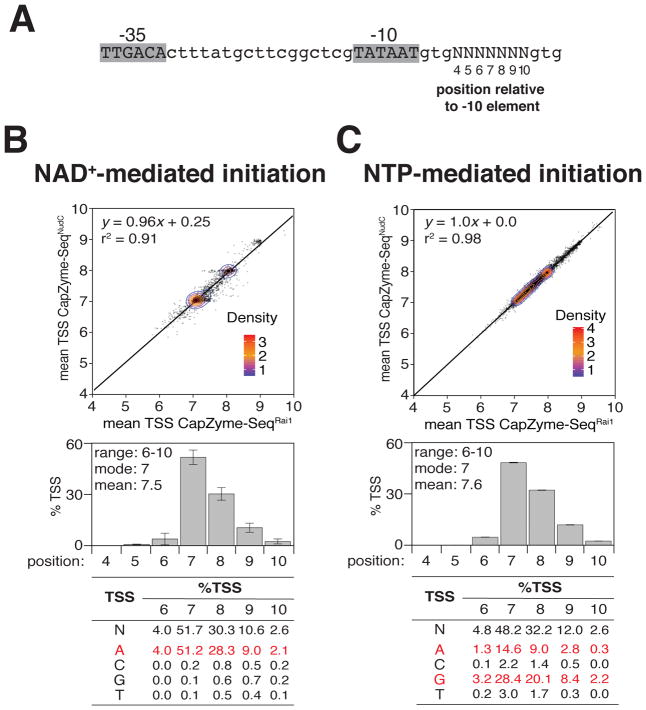
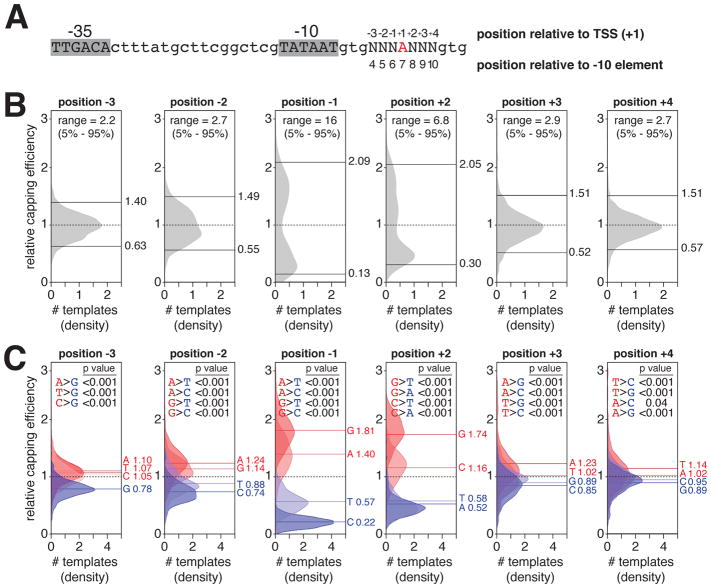
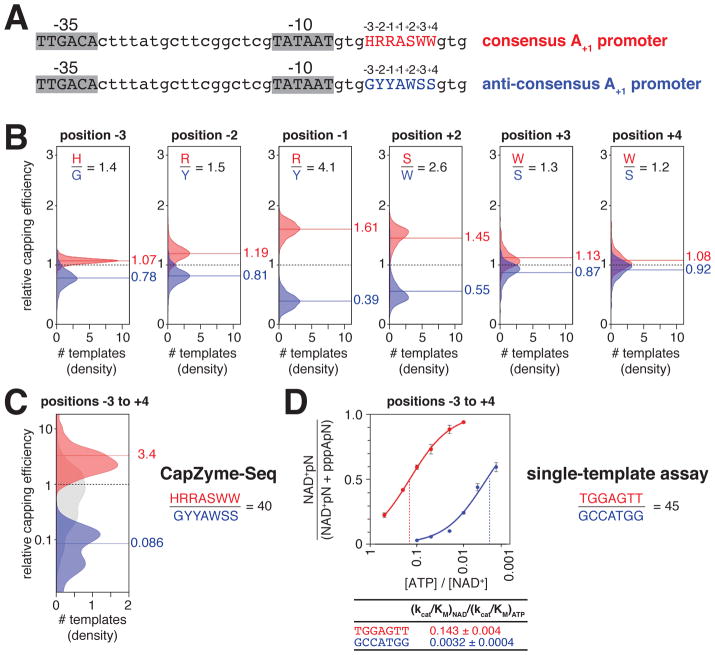
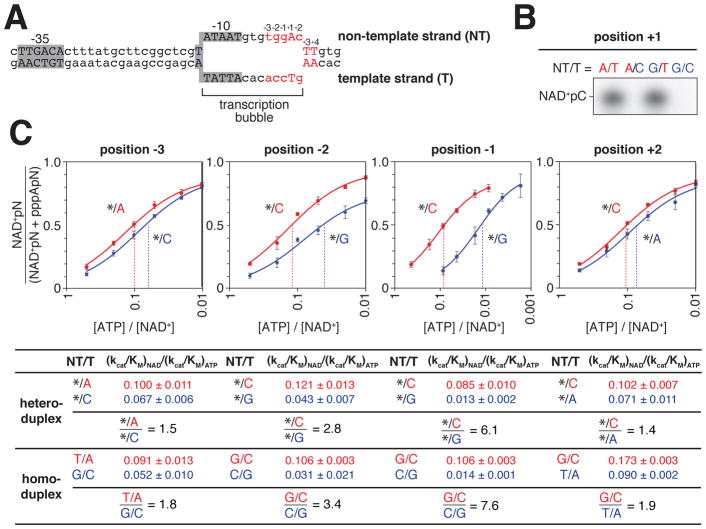
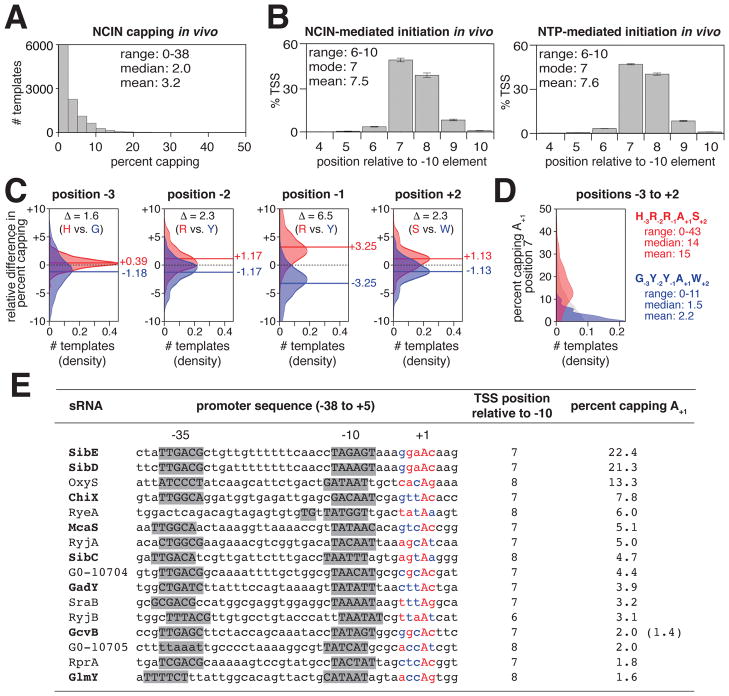
Nucleoside-containing metabolites such as NAD+ can be incorporated as 5' caps on RNA by serving as non-canonical initiating nucleotides (NCINs) for transcription initiation by RNA polymerase (RNAP). Here, we report CapZyme-seq, a high-throughput-sequencing method that employs NCIN-decapping enzymes NudC and Rai1 to detect and quantify NCIN-capped RNA. By combining CapZyme-seq with multiplexed transcriptomics, we determine efficiencies of NAD+ capping by Escherichia coli RNAP for ∼16,000 promoter sequences. The results define preferred transcription start site (TSS) positions for NAD+ capping and define a consensus promoter sequence for NAD+ capping: HRRASWW (TSS underlined). By applying CapZyme-seq to E. coli total cellular RNA, we establish that sequence determinants for NCIN capping in vivo match the NAD+-capping consensus defined in vitro, and we identify and quantify NCIN-capped small RNAs (sRNAs). Our findings define the promoter-sequence determinants for NCIN capping with NAD+ and provide a general method for analysis of NCIN capping in vitro and in vivo.

Keywords: NudC; RNA capping; RNA polymerase; RNA-seq; Rai1; nicotinamide adenine dinucleotide; non-canonical initiating nucleotide; transcription; transcription initiation; transcription start site.


Conflict of interest statement

DECLARATION OF INTERESTS

The authors declare no competing interests.

Figures

Figure 1
Figure 1. CapZyme-Seq, a high-throughput-sequencing method to detect NCIN-capped RNA
A. Structures of ATP and adenosine-containing NCINs NAD+, NADH, dpCoA, and FAD. Red, identical atoms. B. Processing of RNA 5′-ends by NudC, Rai1, and Rpp. Red, common moiety of each 5′-end; black, distinct moiety of each 5′-end; grey, remainder of RNA. C. Products of processing of NCIN-capped RNA 5′-ends by NudC, Rai1, and Rpp. D. CapZyme-Seq procedure. Grey, RNA; purple, 5′ adaptor; red, 3′ adaptor; black cDNA.
Figure 2
Figure 2. CapZyme-Seq analysis of NCIN capping with NAD+ in vitro
A. Use of CapZyme-Seq in combination with massively systematic transcript end readout (MASTER). Top, lacCONS-N7 promoter library (47, ~16,000 promoter sequences). Grey, promoter −35 and −10 elements; green, randomized sequences 4–10 bp downstream of promoter −10 element; blue, transcribed-region barcode. The linear DNA template contains ~100 bp of transcribed-region sequence downstream of the green randomized sequence. Thus, RNA products generated from the lacCONS-N7 promoter library are ~100-nt in length. Middle, CapZyme-Seq using NudC for processing of NCIN-capped RNA and Rpp for processing of uncapped 5′-triphosphate RNA (CapZyme-SeqNudC). Bottom, CapZyme-Seq using Rai1 for processing of NCIN-capped RNA and Rpp for processing of uncapped 5′-triphosphate RNA (CapZyme-SeqRai1). B. Equations used to calculate percent capping and capping efficiencies. C. Results of CapZyme-SeqNudC and CapZyme-SeqRai1. Top, mean percent capping from CapZyme-SeqNudC (n=3) vs. mean percent capping from CapZyme-SeqRai1 (n=3) for ~16,000 promoter sequences (Density from Gaussian kernel density estimation method). Middle and bottom, percent capping histograms.
Figure 3
Figure 3. Determinants for transcription start site selection in NCIN capping with NAD+ in vitro
A. lacCONS-N7 promoter library (47, ~16,000 promoter sequences). B–C. Data for NAD+-mediated initiation (B) and NTP-mediated initiation (C). Top panels, mean TSS from CapZyme-SeqNudC (n=3) vs. mean TSS from CapZyme-SeqRai1 (n=3; mean TSS = [(4 × %TSS at position 4) + (5 × %TSS at position 5) +(6 × %TSS at position 6) + (7 × %TSS at position 7) + (8 × %TSS at position 8) + (9 × %TSS at position 9) + (10 × %TSS at position 10)] / 100). Middle panels, histograms of TSS positions (positions numbered relative to promoter −10 element; mean±SD of percentage of TSS at each position; n=6). Bottom panels, nucleotide frequencies for TSS selection at positions 6, 7, 8, 9, and 10 bp downstream of the −10 element (data for consensus nucleotides in red). See also Figure S1.
Figure 4
Figure 4. Promoter sequence determinants for NCIN capping with NAD+ in vitro
A. Subset of lacCONS-N7 promoter library having A (red) at the position 7 bp downstream of −10 element (~4,000 sequences). B. Distributions of relative capping efficiency (calculated using the equation in Figure S2B; n=6) for ~4,000 A+1 promoter sequences at the positions immediately upstream of the TSS (positions −1, −2, and −3) and immediately downstream of the TSS (positions +2, +3, and +4). The dashed line is the mean relative capping efficiency, the upper and lower solid lines are the 95th percentile and 5th percentile, respectively, and the “range” is defined as the 95th percentile relative capping efficiency divided by the 5th percentile relative capping efficiency. C. Distributions of relative capping efficiency for ~4,000 A+1 promoter sequences parsed by position and nucleotide (A, T, C, or G). The dashed line is the mean relative capping efficiency for all sequences, the solid lines are the means for sequences having the indicated nucleotide. Distributions and lines are colored by consensus nucleotide (mean relative capping efficiency greater than 1; red) or anti-consensus nucleotide (mean relative capping efficiency less than 1; blue). Shown are p values for pairwise comparisons of consensus and anti-consensus nucleotides (Kolmogorov–Smirnov test). See also Figure S2.
Figure 5
Figure 5. Promoter consensus sequence for NCIN capping with NAD+ in vitro
A. lacCONS promoter derivatives with consensus A+1 sequence (red) and anti-consensus A+1 sequence (blue) for NAD+ capping. B. Distributions of relative capping efficiency, for ~4,000 A+1 promoter sequences parsed by position and nucleotide (H, G, R, Y, S, or W) and colored by consensus nucleotide (red) or anti-consensus nucleotide (blue). The dashed line is the mean relative capping efficiency for all sequences, the solid lines are the means for sequences having a consensus nucleotide (red) or an anti-consensus nucleotide (blue). C. Distributions of relative capping efficiency for consensus A+1 sequences (red), anti-consensus A+1 sequences (blue), or all A+1 sequences (grey). D. Dependence of NAD+ capping on [ATP] / [NAD+] ratio for representative consensus A+1 promoter sequence (red) and anti-consensus A+1 promoter sequence (blue): data from single-template gel assays (mean±SD; n=3). The dashed line indicates the value of [ATP] / [NAD+] when the value of NAD+pN / (NAD+pN + pppApN) = 0.5. See also Figure S3.
Figure 6
Figure 6. Strand specificity of NCIN capping with NAD+ in vitro
A. lacCONS promoter derivative containing consensus A+1 promoter sequence in context of RNAP-promoter open complex. DNA non-template strand (NT) on top; DNA template strand (T) on bottom; Unwound, non-base-paired DNA region, “transcription bubble,” indicated by raised and lowered nucleotides B. Products of transcription reactions with NAD+ as initiating nucleotide and [α32P]-CTP as extending nucleotide for templates having the consensus nucleotides at the TSS, position +1, on both DNA strands, non-template strand only, template strand only, or neither. C. Dependence of NAD+ capping on [ATP] / [NAD+] ratio for templates having an abasic site (*) on the DNA non-template strand and either consensus base (red) or anti-consensus base (blue) on the DNA template strand at each of positions −3, −2, −1, and +2, relative to TSS. Below, capping efficiencies and consensus/anti-consensus capping efficiency ratios for heteroduplex templates with an abasic site on the DNA non-template strand or, for comparison, for homoduplex templates having a complementary nucleotide on the DNA non-template strand (mean±SD; n=3). The dashed line indicates the value of [ATP] / [NAD+] when the value of NAD+pN / (NAD+pN + pppApN) = 0.5. See also Figure S5.
Figure 7
Figure 7. CapZyme-Seq analysis of NCIN capping in vivo
A–D. Promoter sequence determinants for NCIN capping in vivo in E. coli. Percent capping histogram (A); TSS position histograms (B; mean±SD of percentage of TSS at each position; n=3); relative percent capping difference distributions (C; calculated using the equation in Figure S4B; the dashed line is 0, the solid lines are the means, consensus nucleotides are colored red, anti-consensus nucleotides are colored blue); percent capping histograms for −3 through +2 consensus (red) and anti-consensus (blue) sequences for NCIN-capping in vivo (D). E. Identification and quantitation of NCIN-capped sRNAs in vivo in E. coli. Bold indicates sRNA sequences previously identified as NAD+ capped (Cahova et al., 2015). In the promoter sequences, grey shading represents the promoter −10, extended −10, and −35 promoter elements, and colors indicate matches to the −3 through +2 consensus (red) and anti-consensus (blue) sequences for NCIN capping in vivo. Percent capping values represent the mean of three independent measurements. In the column for percent capping the number reported previously in (Nubel et al., 2017) for GcvB is in parentheses. See also Figure S4.

Similar articles

Cited by

References

    1. Arribas-Layton M, Wu D, Lykke-Andersen J, Song H. Structural and functional control of the eukaryotic mRNA decapping machinery. Biochim Biophys Acta. 2013;1829:580–589. - PMC - PubMed
    1. Artsimovitch I, Svetlov V, Murakami KS, Landick R. Co-overexpression of Escherichia coli RNA polymerase subunits allows isolation and analysis of mutant enzymes lacking lineage-specific sequence insertions. JBC. 2003;278:12344–12355. - PubMed
    1. Barvik I, Rejman D, Panova N, Sanderova H, Krasny L. Non-canonical transcription initiation: the expanding universe of transcription initiating substrates. FEMS Microbiol Rev. 2017;41:131–138. - PubMed
    1. Bird JG, Nickels BE, Ebright RH. RNA Capping by Transcription Initiation with Non-canonical Initiating Nucleotides (NCINs): Determination of Relative Efficiencies of Transcription Initiation with NCINs and NTPs. Bio-protocol. 2017:7. - PMC - PubMed
    1. Bird JG, Zhang Y, Tian Y, Panova N, Barvik I, Greene L, Liu M, Buckley B, Krasny L, Lee JK, et al. The mechanism of RNA 5′ capping with NAD+, NADH and desphospho-CoA. Nature. 2016;535:444–447. - PMC - PubMed

Publication types

MeSH terms

LinkOut - more resources