. 2018 May 3;70(3):435-448.e5.
doi: 10.1016/j.molcel.2018.03.019. Epub 2018 Apr 19.

Distinct Stimulatory Mechanisms Regulate the Catalytic Activity of Polycomb Repressive Complex 2

Affiliations

Distinct Stimulatory Mechanisms Regulate the Catalytic Activity of Polycomb Repressive Complex 2

Chul-Hwan Lee et al. Mol Cell. .

Abstract

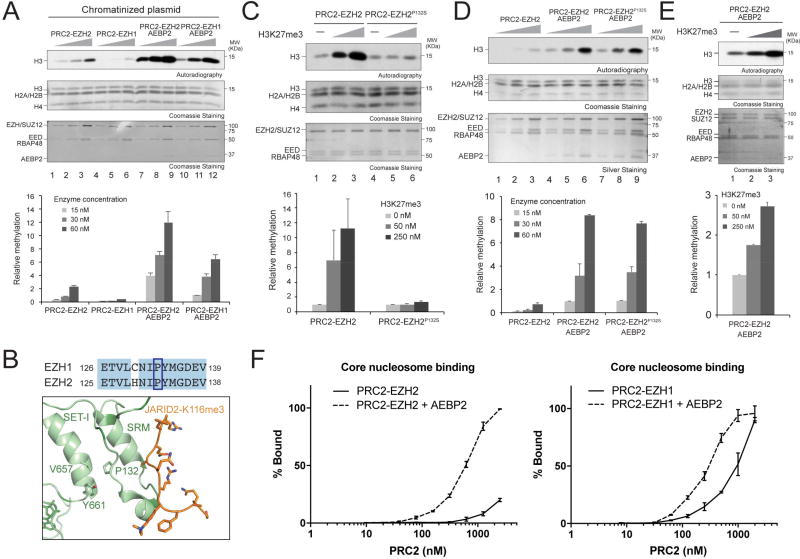
The maintenance of gene expression patterns during metazoan development is achieved, in part, by the actions of polycomb repressive complex 2 (PRC2). PRC2 catalyzes mono-, di-, and trimethylation of histone H3 at lysine 27 (H3K27), with H3K27me2/3 being strongly associated with silenced genes. We demonstrate that EZH1 and EZH2, the two mutually exclusive catalytic subunits of PRC2, are differentially activated by various mechanisms. Whereas both PRC2-EZH1 and PRC2-EZH2 are able to catalyze mono- and dimethylation, only PRC2-EZH2 is strongly activated by allosteric modulators and specific chromatin substrates to catalyze trimethylation of H3K27 in mouse embryonic stem cells (mESCs). However, we also show that a PRC2-associated protein, AEBP2, can stimulate the activity of both complexes through a mechanism independent of and additive to allosteric activation. These results have strong implications regarding the cellular requirements for and the accompanying adjustments in PRC2 activity, given the differential expression of EZH1 and EZH2 upon cellular differentiation.

Keywords: AEBP2; EZH1; EZH2; H3K27 methylation; PRC2; allosteric activation.


Figures

Figure 1
Figure 1. Substrate preference of PRC2-EZH1 and PRC2-EZH2 differentiate their intrinsic catalytic activity
(A) Western blot analysis of EZH2, EZH1, H3K27me1, H3K27me2, H3K27me3, Gapdh and total histone H3 levels from E14 mESCs WT cells or cells carrying EZH2-KO, B6 mESCs WT cells or cells carrying EZH1-KO or EZH1-KO/EZH2ΔSET, as indicated. (B-E) Histone methyltransferase assays. The details of HMT assay conditions as well as the generation of the nucleosome substrates are described in Materials & Methods. (n=3/data point). Data Plotted as Mean±SD. (B) Top, HMT assays containing PRC2-EZH1 or PRC2-EZH2 (15, 30, or 60 nM) using core nucleosomes, mononucleosomes, or chromatinized plasmids as substrates (300 nM), as illustrated on the panel. The levels of methylation on histone H3 are shown by autoradiography (Top image). Coomassie blue staining of SDS-PAGE gels containing nucleosomes (Middle image) or PRC2 components (Bottom image) was used to visualize the relative concentration of each component present in each reaction. Bottom, quantification of the relative amount of 3H-SAM incorporated into histone H3 after 60 min of incubation. (C) Top, HMT assays containing PRC2-EZH1 or PRC2-EZH2 (15 nM) using core nucleosomes (300 nM) as substrate with increasing amounts of 75 bp double-stranded (ds) DNA (200, 400, or 800 nM). Other panels are as described in (B). (D and E) Top, HMT assays containing PRC2-EZH1 or PRC2-EZH2 (15, 30, or 60 nM) using 300 nM of di-nucleosomes (D) or 12N oligo-nucleosomes (E) containing indicated lengths of linker DNA as substrates. Other panels are as described in (B).
Figure 2
Figure 2. Allosteric, SRM-dependent activation of PRC2-EZH2 is significantly more efficient than that of PRC2-EZH1
(A) Top, HMT assays containing PRC2-EZH1 or PRC2-EZH2 (15 nM) using core nucleosomes (Left) or chromatinized plasmids (Right) as substrates (300 nM) in the absence or presence of the H3K27me3 peptide, as indicated. Top/middle/bottom images are described in Figure 1B. Bottom, quantification of the relative amount of 3H-SAM incorporated into histone H3 after 60 min of incubation, (n=3/data point). Data Plotted as Mean±SD. (B) Top, Sequence alignment of the SRM domain of human EZH1 and human EZH2. Distinct residues between EZH1 and EZH2 (EZH1 C130 and EZH2 H129) are highlighted by blue box. Bottom, Structural depiction of the SRM domain of human PRC2-EZH2 with JARID2-K116me3 (111–121) peptide (modified from PDB:5HYN). His129 of EZH2, and Arg236 and Arg302 of EED are highlighted. (C) Left, HMT assays containing PRC2-EZH2, PRC2-EZH1, or PRC2-EZH2H129C (15 nM) using core nucleosomes (300 nM) as substrate in the absence or presence of the H3K27me3 peptide (50, 100, or 200 nM), as indicated. Other panels are as described in (A). Right, quantification of the relative amount of 3H-SAM incorporated into histone H3 after 60 min of incubation, (n=3/data point). Data Plotted as Mean±SD. (D) Western blot analysis of EZH2, EED, H3K27me1, H3K27me2, H3K27me3, Gapdh, and total histone H3 levels from E14 mESCs WT cells or cells carrying EZH2-KO rescued with EZH2WT or EZH2H129C mutant, as indicated. EV, empty vector.
Figure 3
Figure 3. EED inhibitor and GSK126 are more efficient in inhibiting PRC2-EZH2 than PRC2-EZH1
(A) Left, HMT assays containing 20 nM PRC2-EZH1 or PRC2-EZH2, in the absence or presence of H3K27me3 peptide (300 nM), and increasing amounts (20, 80, 320, 1280, or 5120 nM) of EED inhibitor (EED-226) using di-nucleosomes containing 40 bp linker DNA (300 nM) as substrate. Top/middle/bottom images are described in Figure 1B. Right, Activity was quantified by the relative amount of 3H-SAM incorporated into histone H3 after 60 min of incubation, (n=3/data point). Data Plotted as Mean±SD. (B) Western blot analysis of EZH2, EZH1, H3K27me1, H3K27me2, H3K27me3, Gapdh, and total histone H3 levels from EZH2-KO and EZH1-KO. EZH2-KO and EZH1-KO mESCs were treated with increasing amounts of EED-226 (0, 100, 200, 500, or 1000 nM) for 3 days. (C) Top, Sequence alignment of the SET domain of human EZH1 and human EZH2. Distinct residues between EZH1 and EZH2 (EZH1 S664 and EZH2 C663) are highlighted by blue box. Bottom, Structural depiction (modified from PDB:5IJ7) of the SET domain (blue) of human PRC2-EZH2 with an SAM-competitive inhibitor (red). The C663 residue of EZH2 is highlighted in yellow. (D) Left, HMT assays containing PRC2-EZH2, PRC2-EZH1, or PRC2-EZH1S664C (15 nM) in the absence or presence of GSK126 (5, 10, 20, or 40 nM) using core nucleosomes (300 nM) as substrate. Other panels are as described in (A). (E) Left, Western blot analysis of EZH2, H3K27me1, H3K27me2, H3K27me3, Gapdh, and total histone H3 levels from E14 mESCs carrying EZH2-KO expressing EZH2WT or EZH2C663S. EZH2-KO expressing EZH2WT or EZH2C663S mESCs were treated with increasing amounts of GSK126 (0, 200, 500, 1000, 2000 or 5000 nM) for 3 days. Right, quantification of the levels of H3K27me3 (Top) and H3K27me2 (Bottom), (n=2/data point). Data Plotted as Mean±SD.
Figure 4
Figure 4. AEBP2 stimulates PRC2 using a mechanism independent of allosteric activation by H3K27me3
(A) Top, HMT assay containing PRC2-EZH1, PRC2-EZH2, PRC2-EZH1-AEBP2, or PRC2-EZH2-AEBP2 (15, 30, or 60 nM) using chromatinized plasmids (300 nM) as substrate. Top/middle/bottom images are described in Figure 1B. Bottom, quantification of the relative amount of 3H-SAM incorporated into histone H3 after 60 min of incubation (n=3/data point). Data Plotted as Mean±SD. (B) Sequence alignment of the SRM domain of PRC2-EZH1 and PRC2-EZH2 (Top). Structural depiction of the SRM domain of PRC2-EZH2 (Bottom; modified from PDB:5HYN). (C) Top, HMT assay containing 15 nM PRC2-EZH2 or PRC2-EZH2 containing the EZH2P132S mutant using chromatinized plasmids (300 nM) as substrate. Other panels are as described in (A). (D) Top, HMT assays containing PRC2-EZH2, PRC2-EZH2-AEBP2 or PRC2-EZH2P132S-AEBP2 (15, 30, or 60 nM) using chromatinized plasmids (300 nM) as substrate. Other panels are as described in (A). (E) Top, HMT assays containing PRC2-EZH2-AEBP2 (15 nM) with increasing amounts of H3K27me3 peptide (50 or 250 nM) using chromatinized plasmids (300 nM) as substrate. Other panels are as described in (A). (F) Quantification of EMSA assays containing PRC2-EZH2 (Left) or PRC2-EZH1 (Right) with or without AEBP2. 200 nM core nucleosomes were used as substrate, (n=3/data point). Data Plotted as Mean±SD.
Figure 5
Figure 5. A KR-motif of AEBP2 is required for stimulation of PRC2 catalytic activity
(A) Schematic representation of full-length AEBP2 (short isoform) or its truncated AEBP2 fragments (Left), and the summary of nucleosome binding assays (in Panel B), and HMT assays (in Panel C) for PRC2-EZH2 or PRC2-EZH2 in complex with AEBP2 or AEBP2 fragments. (B) Quantification of EMSA assays containing PRC2-EZH2, either alone or in complex with AEBP2 or AEBP2 fragments (800, 1600, or 2400 nM), using core nucleosomes (200 nM) as substrate, (n=3/data point). Data Plotted as Mean±SD. (C) Top, HMT assays containing PRC2-EZH2 (30 nM) in the absence or presence of AEBP2 or AEBP2 fragments (15 or 30 nM) using core nucleosomes (300 nM) as substrates. Top/bottom images are described in Figure 1B. Bottom, quantification of the relative amount of 3H-SAM incorporated into histone H3 after 60 min of incubation, (n=3/data point). Data Plotted as Mean±SD. (D) Schematic representation of AEBP2 or AEBP2 mutants (Left) and the summary of nucleosome binding assays (in Panel E), and HMT assays (in Panel F) for PRC2-EZH2, either alone or in complex with AEBP2 or AEBP2 mutants. (E) Quantification of EMSA assays containing PRC2-EZH2 or PRC2-EZH2 in complex with AEBP2 or AEBP2 mutants (800, 1600, or 2400 nM) using core nucleosomes (200 nM) as substrate, (n=3 for each data point). (F) HMT assays containing PRC2-EZH2 (30 nM) in the absence or presence of AEBP2 or AEBP2 mutants (15 or 30 nM) using core nucleosomes (300 nM) as substrates. Top/middle/bottom images are described in Figure 1B. Other panels are as described in (C). (G) Top, Western blot analysis of AEBP2, EZH2, EED, H3K27me1, H3K27me2, H3K27me3, Gapdh, and total histone H3 levels from E14 mESCs WT cells or cells carrying AEBP2-KO or AEBP2-KO rescued with AEBP2 WT or AEBP2 mutants. Bottom, quantification of the levels of H3K27me3, (n=2/data point). Data Plotted as Mean±SD.
Figure 6
Figure 6. Multiple, independent pathways of catalyzing H3K27me3 through PRC2 stimulation
(A) Top, HMT assays containing PRC2-EZH2 (60, 120, or 240 nM) in the absence or presence of H3K27me3 peptide, AEBP2WT, AEBP2KR(171–174/178–181)A, or both H3K27me3 and AEBP2WT (60, 120, or 240 nM) using H3K27me2 chromatinized plasmids (300 nM) as substrate. Top/middle/bottom images are described in Figure 1B. Note that the autoradiography signal (Top image) represents tri-methylation of H3K27. Bottom, quantification of the relative amount of 3H-SAM incorporated (H3K27me3) into histone H3 after 60 min of incubation, (n=2/data point). Data Plotted as Mean±SD. (B) HMT assays containing PRC2-EZH2P132S (60, 120, or 240 nM) in the absence or presence of AEBP2WT, AEBP2KR(171–174/178–181)A (60, 120, or 240 nM) using H3K27me2 chromatinized plasmids (300 nM) as substrate. Other panels are as described in (A). (C) HMT assays were performed as described in panel A except using PRC2-EZH1 (60, 120, or 240 nM). (D) HMT assays containing PRC2-EZH2 (Left) and PRC2-EZH1 (Right) performed in Figure 1D (here, Top image) were subjected to immunoblotting against H3K27me1, H3K27me2, and H3K27me3.

References

    1. Beltran M, Yates CM, Skalska L, Dawson M, Reis FP, Viiri K, Fisher CL, Sibley CR, Foster BM, Bartke T, et al. The interaction of PRC2 with RNA or chromatin s mutually antagonistic. Genome Res. 2016;26:896–907. - PMC - PubMed
    1. Boyer LA, Plath K, Zeitlinger J, Brambrink T, Medeiros LA, Lee TI, Levine SS, Wernig M, Tajonar A, Ray MK, et al. Polycomb complexes repress developmental regulators in murine embryonic stem cells. Nature. 2006;441:349–353. - PubMed
    1. Brooun A, Gajiwala KS, Deng Y-L, Liu W, Bolaños B, Bingham P, He Y-A, Diehl W, Grable N, Kung P-P, et al. Polycomb repressive complex 2 structure with inhibitor reveals a mechanism of activation and drug resistance. Nat. Commun. 2016;7:11384. - PMC - PubMed
    1. Cao R, Zhang Y. SUZ12 is required for both the histone methyltransferase activity and the silencing function of the EED-EZH2 complex. Mol. Cell. 2004;15:57–67. - PubMed
    1. Chen X, Xu H, Yuan P, Fang F, Huss M, Vega VB, Wong E, Orlov YL, Zhang W, Jiang J, et al. Integration of External Signaling Pathways with the Core Transcriptional Network in Embryonic Stem Cells. Cell. 2008;133:1106–1117. - PubMed

Publication types

LinkOut - more resources