

Regional differences in brain glucose metabolism determined by imaging mass spectrometry
- PMID: 29681509
- PMCID: PMC6001904
- DOI: 10.1016/j.molmet.2018.03.013
Regional differences in brain glucose metabolism determined by imaging mass spectrometry
Abstract
Objective: Glucose is the major energy substrate of the brain and crucial for normal brain function. In diabetes, the brain is subject to episodes of hypo- and hyperglycemia resulting in acute outcomes ranging from confusion to seizures, while chronic metabolic dysregulation puts patients at increased risk for depression and Alzheimer's disease. In the present study, we aimed to determine how glucose is metabolized in different regions of the brain using imaging mass spectrometry (IMS).
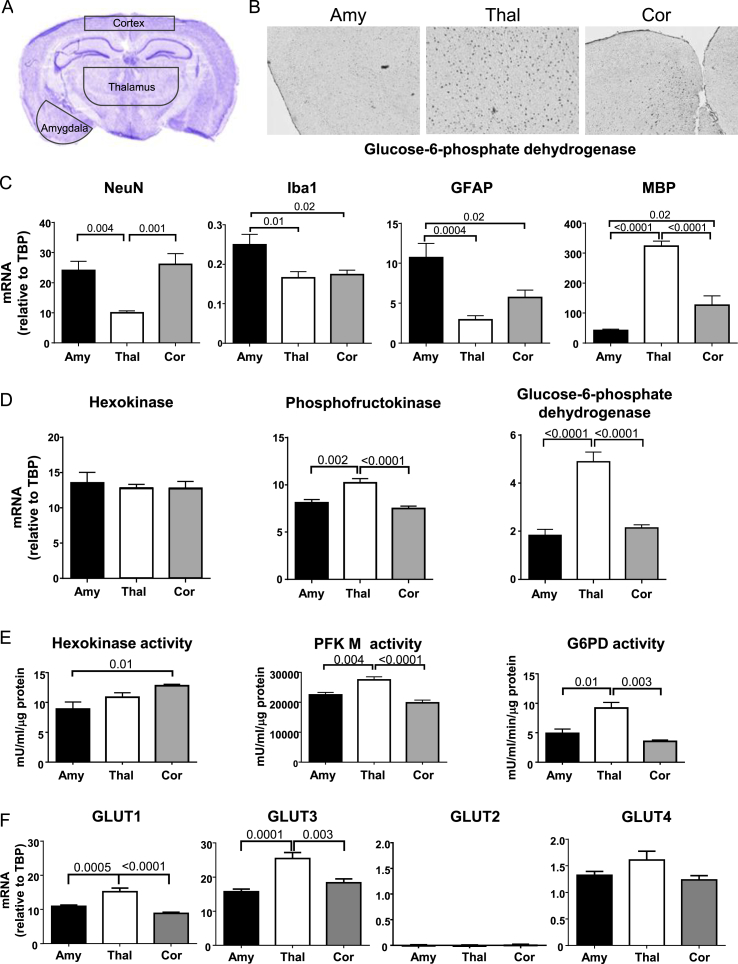
Methods: To examine the relative abundance of glucose and other metabolites in the brain, mouse brain sections were subjected to imaging mass spectrometry at a resolution of 100 μm. This was correlated with immunohistochemistry, qPCR, western blotting and enzyme assays of dissected brain regions to determine the relative contributions of the glycolytic and pentose phosphate pathways to regional glucose metabolism.
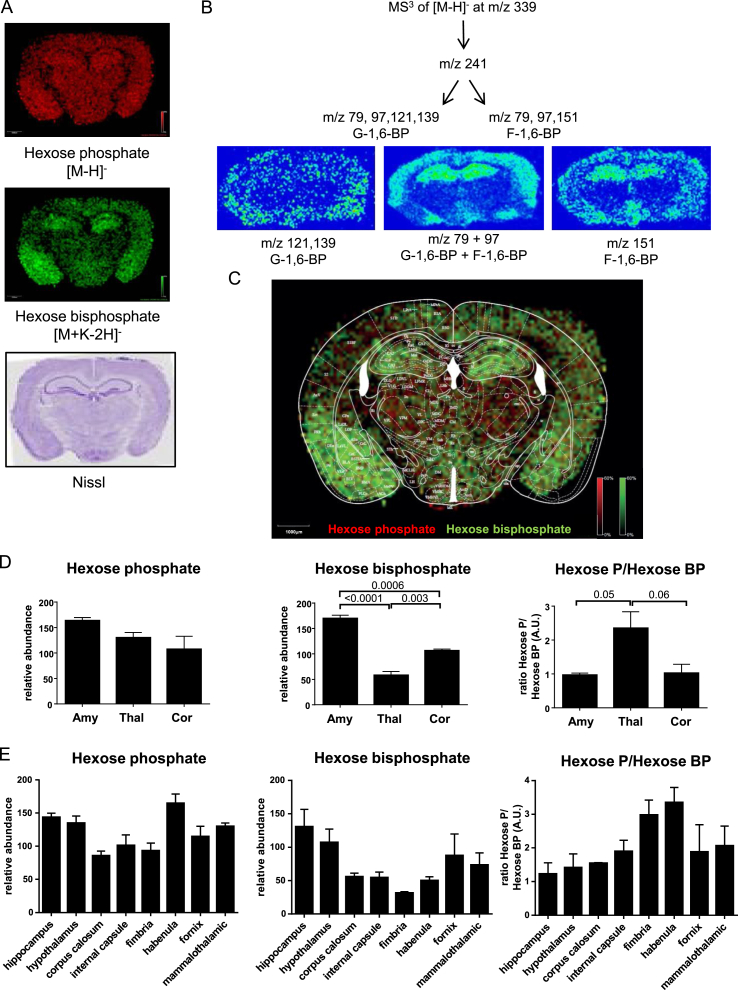
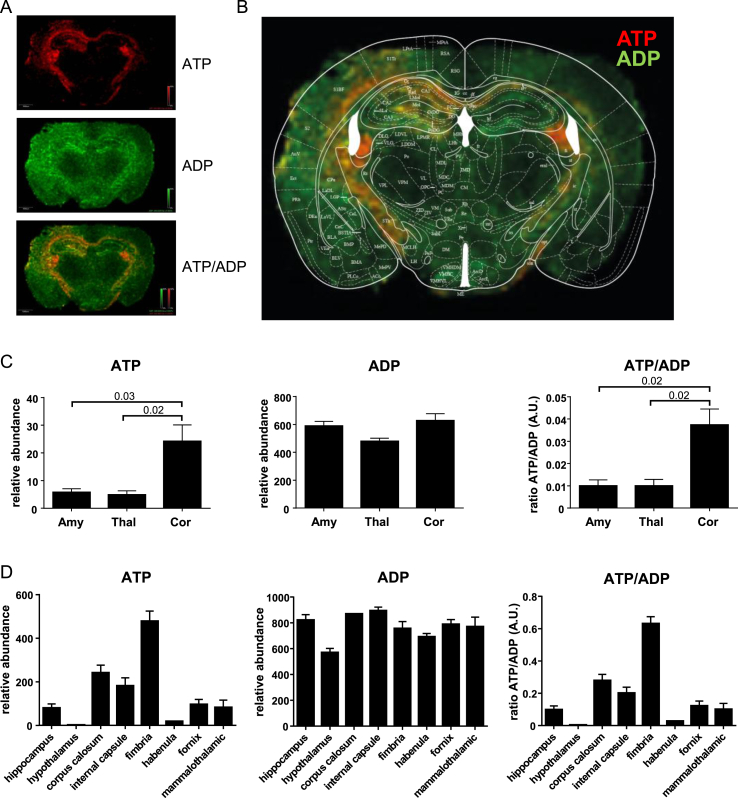
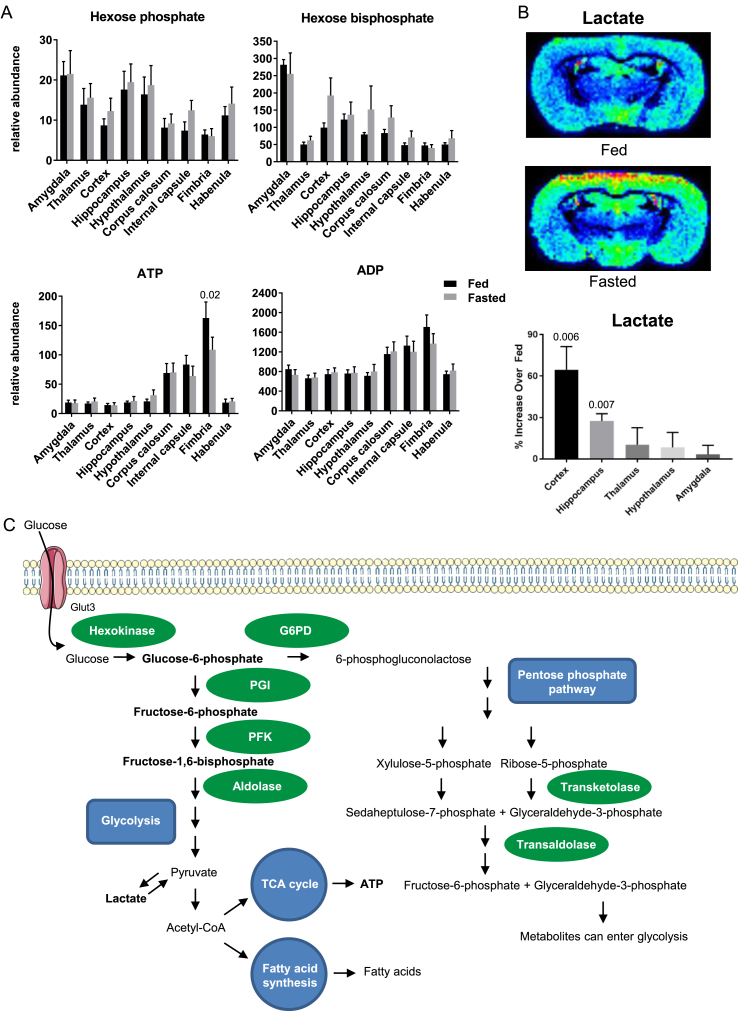
Results: In brain, there are significant regional differences in glucose metabolism, with low levels of hexose bisphosphate (a glycolytic intermediate) and high levels of the pentose phosphate pathway (PPP) enzyme glucose-6-phosphate dehydrogenase (G6PD) and PPP metabolite hexose phosphate in thalamus compared to cortex. The ratio of ATP to ADP is significantly higher in white matter tracts, such as corpus callosum, compared to less myelinated areas. While the brain is able to maintain normal ratios of hexose phosphate, hexose bisphosphate, ATP, and ADP during fasting, fasting causes a large increase in cortical and hippocampal lactate.
Conclusion: These data demonstrate the importance of direct measurement of metabolic intermediates to determine regional differences in brain glucose metabolism and illustrate the strength of imaging mass spectrometry for investigating the impact of changing metabolic states on brain function at a regional level with high resolution.
Keywords: ATP; Brain imaging; Glucose metabolism; Glycolysis; Mass spectrometry; Pentose phosphate pathway.
Copyright © 2018 The Authors. Published by Elsevier GmbH.. All rights reserved.
Figures
Similar articles
-
(13)C metabolic flux analysis in neurons utilizing a model that accounts for hexose phosphate recycling within the pentose phosphate pathway.Neurochem Int. 2016 Feb;93:26-39. doi: 10.1016/j.neuint.2015.12.008. Epub 2015 Dec 23. Neurochem Int. 2016. PMID: 26723542 Free PMC article.
-
Impaired Pentose Phosphate Pathway in the Spinal Cord of the hSOD1G93A Mouse Model of Amyotrophic Lateral Sclerosis.Mol Neurobiol. 2019 Aug;56(8):5844-5855. doi: 10.1007/s12035-019-1485-6. Epub 2019 Jan 26. Mol Neurobiol. 2019. PMID: 30685842
-
Metabolomics reveals critical adrenergic regulatory checkpoints in glycolysis and pentose-phosphate pathways in embryonic heart.J Biol Chem. 2018 May 4;293(18):6925-6941. doi: 10.1074/jbc.RA118.002566. Epub 2018 Mar 14. J Biol Chem. 2018. PMID: 29540484 Free PMC article.
-
[Astrogliopathy as a loss of astroglial protective function against glycoxidative stress under hyperglycemia].Rinsho Shinkeigaku. 2012;52(1):41-51. doi: 10.5692/clinicalneurol.52.41. Rinsho Shinkeigaku. 2012. PMID: 22260979 Review. Japanese.
-
Glucose metabolism and astrocyte-neuron interactions in the neonatal brain.Neurochem Int. 2015 Mar;82:33-41. doi: 10.1016/j.neuint.2015.02.002. Epub 2015 Feb 12. Neurochem Int. 2015. PMID: 25684072 Review.
Cited by
-
Glucose metabolic crosstalk and regulation in brain function and diseases.Prog Neurobiol. 2021 Sep;204:102089. doi: 10.1016/j.pneurobio.2021.102089. Epub 2021 Jun 10. Prog Neurobiol. 2021. PMID: 34118354 Free PMC article. Review.
-
Hippocampal disruptions of synaptic and astrocyte metabolism are primary events of early amyloid pathology in the 5xFAD mouse model of Alzheimer's disease.Cell Death Dis. 2021 Oct 16;12(11):954. doi: 10.1038/s41419-021-04237-y. Cell Death Dis. 2021. PMID: 34657143 Free PMC article.
-
Glucose Stimulates Glial Cell Line-Derived Neurotrophic Factor Gene Expression in Microglia through a GLUT5-Independent Mechanism.Int J Mol Sci. 2022 Jun 25;23(13):7073. doi: 10.3390/ijms23137073. Int J Mol Sci. 2022. PMID: 35806073 Free PMC article.
-
Cerebrospinal fluid metabolic profiling reveals divergent modulation of pentose phosphate pathway by midazolam, propofol and dexmedetomidine in patients with subarachnoid hemorrhage: a cohort study.BMC Anesthesiol. 2022 Jan 27;22(1):34. doi: 10.1186/s12871-022-01574-z. BMC Anesthesiol. 2022. PMID: 35086470 Free PMC article.
-
In Vivo Metabolism of [1,6-13C2]Glucose Reveals Distinct Neuroenergetic Functionality between Mouse Hippocampus and Hypothalamus.Metabolites. 2021 Jan 12;11(1):50. doi: 10.3390/metabo11010050. Metabolites. 2021. PMID: 33445747 Free PMC article.
References
-
- Jais A., Solas M., Backes H., Chaurasia B., Kleinridders A., Theurich S. Myeloid-cell-Derived VEGF maintains brain glucose uptake and limits cognitive impairment in obesity. Cell. 2016;165(4):882–895. - PubMed
-
- McCrimmon R.J., Ryan C.M., Frier B.M. Diabetes and cognitive dysfunction. Lancet. 2012;379(9833):2291–2299. - PubMed
-
- Hayes J.D., McLellan L.I. Glutathione and glutathione-dependent enzymes represent a co-ordinately regulated defence against oxidative stress. Free Radical Research. 1999;31(4):273–300. - PubMed
Publication types
MeSH terms
Substances
Grants and funding
LinkOut - more resources
Full Text Sources
Other Literature Sources
Miscellaneous
