. 2018 May 3;22(5):755-768.e6.
doi: 10.1016/j.stem.2018.03.022. Epub 2018 Apr 19.

The Dystrophin Glycoprotein Complex Regulates the Epigenetic Activation of Muscle Stem Cell Commitment

Affiliations

The Dystrophin Glycoprotein Complex Regulates the Epigenetic Activation of Muscle Stem Cell Commitment

Natasha C Chang et al. Cell Stem Cell. .

Abstract

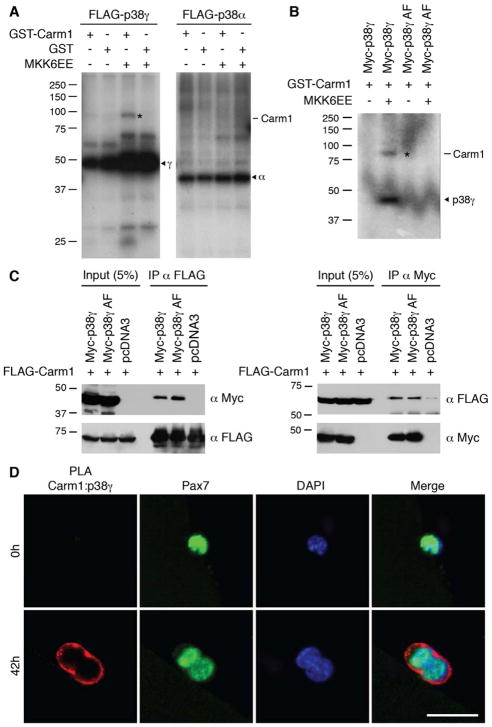
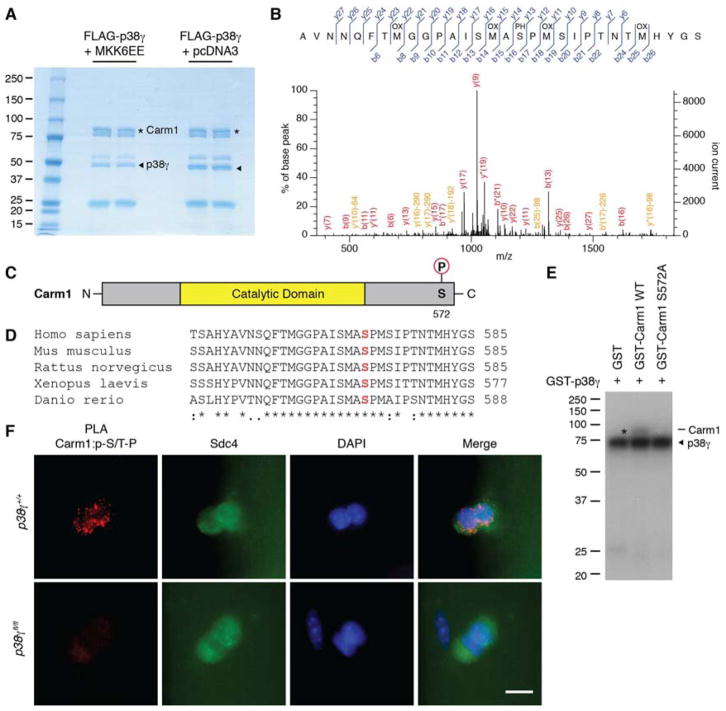
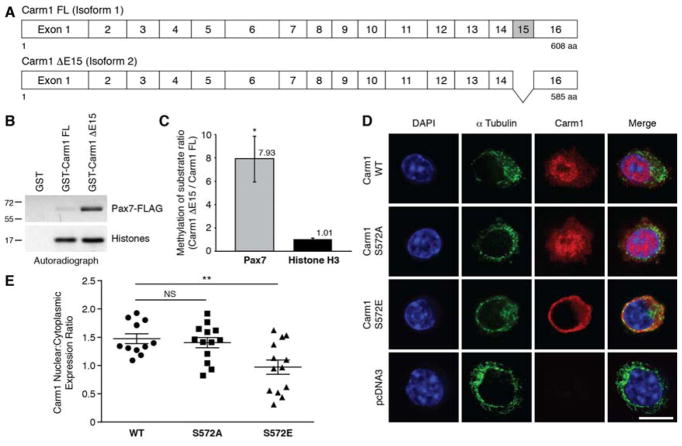
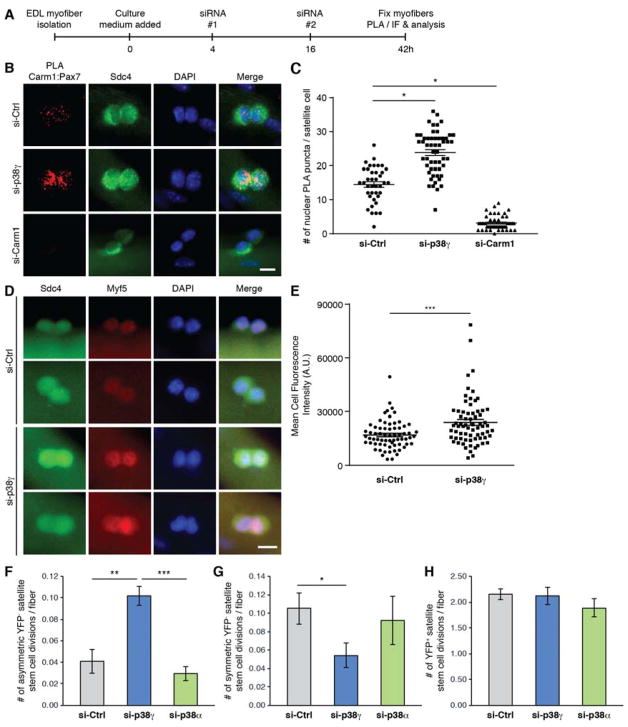
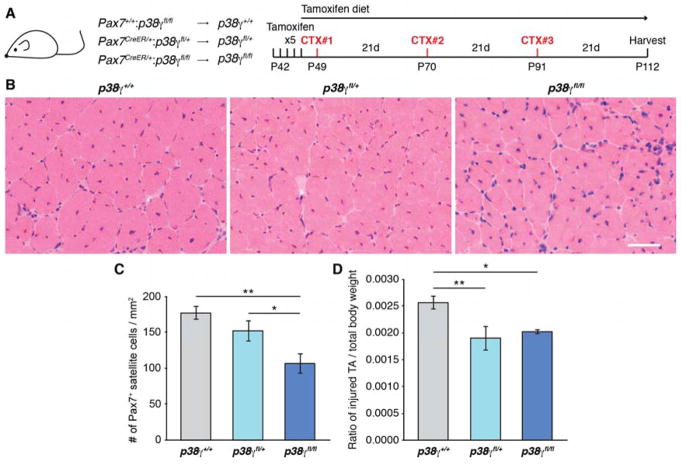
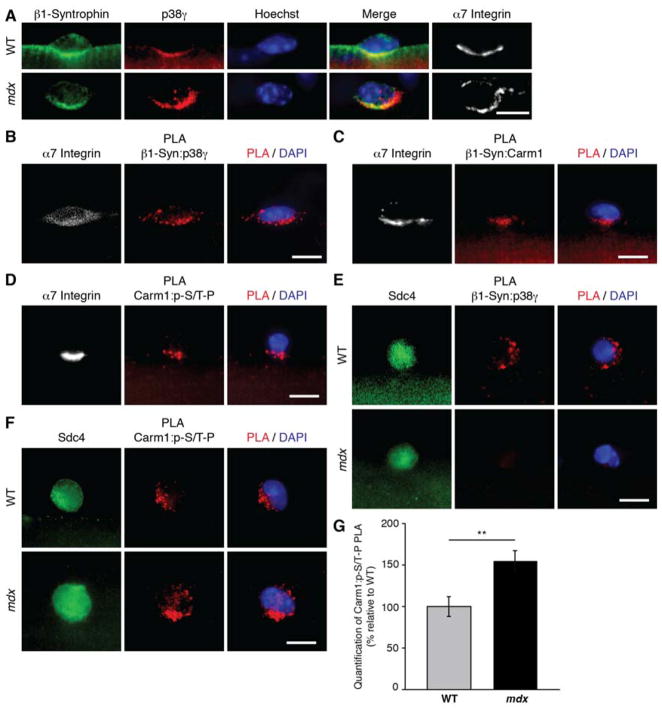
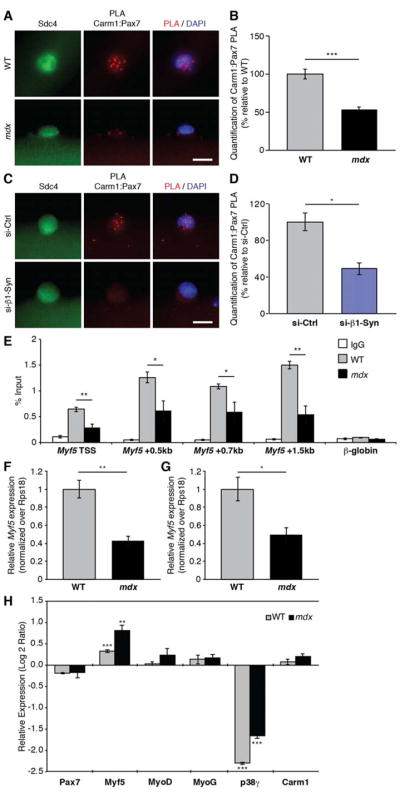
Asymmetrically dividing muscle stem cells in skeletal muscle give rise to committed cells, where the myogenic determination factor Myf5 is transcriptionally activated by Pax7. This activation is dependent on Carm1, which methylates Pax7 on multiple arginine residues, to recruit the ASH2L:MLL1/2:WDR5:RBBP5 histone methyltransferase complex to the proximal promoter of Myf5. Here, we found that Carm1 is a specific substrate of p38γ/MAPK12 and that phosphorylation of Carm1 prevents its nuclear translocation. Basal localization of the p38γ/p-Carm1 complex in muscle stem cells occurs via binding to the dystrophin-glycoprotein complex (DGC) through β1-syntrophin. In dystrophin-deficient muscle stem cells undergoing asymmetric division, p38γ/β1-syntrophin interactions are abrogated, resulting in enhanced Carm1 phosphorylation. The resulting progenitors exhibit reduced Carm1 binding to Pax7, reduced H3K4-methylation of chromatin, and reduced transcription of Myf5 and other Pax7 target genes. Therefore, our experiments suggest that dysregulation of p38γ/Carm1 results in altered epigenetic gene regulation in Duchenne muscular dystrophy.

Keywords: Carm1; Duchenne muscular dystrophy; Pax7; asymmetric division; cell polarity; muscle stem cell; p38γ MAPK; satellite cell; stem cell expansion; β1-syntrophin.


Conflict of interest statement

DECLARATION OF INTERESTS

The authors declare no competing interests.

Figures

Figure 1
Figure 1. Carm1 is Directly Phosphorylated by p38γ MAPK
(A) In vitro kinase assays between GST-Carm1 with either FLAG-p38γ or FLAG-p38α kinases. p38 kinases were activated by co-expression of MKK6EE, as indicated. The asterisk denotes phosphorylated Carm1. Arrowheads denote p38γ (γ) and p38α (α) kinases. (B) In vitro kinase assays between GST-Carm1 with either wild type Myc-p38γ or kinase-inactive Myc-p38γ AF. The asterisk denotes phosphorylated Carm1 and the arrowhead denotes active Myc-p38γ kinase. (C) HEK 293T cells were transfected with FLAG-Carm1 and either Myc-p38γ, Myc-p38γ AF, or pcDNA3. Immunoprecipitation (IP) and immunoblotting were performed with the indicated antibodies. (D) Carm1:p38γ PLA (red) performed on satellite cells cultured on myofibers. Satellite cells are marked by expression of Pax7 (green) and nuclei were counterstained with DAPI (blue). Scale bar represents 20 μm. See also Figure S1.
Figure 2
Figure 2. p38γ MAPK Phosphorylates Carm1 on Ser 572
(A) Coomassie blue staining of Carm1 treated with activated p38γ (+MKK6EE) or non-activated p38γ (+pcDNA3) for LC-MS/MS analysis. Asterisks denote Carm1 and arrowheads denote p38γ kinase. (B) MS/MS spectrum of Carm1 peptide containing phosphorylated S572. Matched b and y ions and the position of oxidations (OX) and phosphorylations (PH) are indicated. (C) Diagram of Carm1 ΔE15 protein with indicated phosphorylation site at S572. (D) Multiple sequence alignment of the last 35 amino acids of Carm1 in 5 different vertebrate species. S572 is marked in red. An asterisk (*) represents identical amino acids, a colon (:) represents highly conserved amino acids, and a period (.) represents weakly conserved amino acids. (E) In vitro kinase assays between active p38γ and wild type or S572A mutant Carm1. The asterisk denotes phosphorylated Carm1 and the arrowhead denotes active p38γ kinase. (F) Carm1:p-S/T-P PLA (red) performed on satellite cells cultured on myofibers isolated from p38γ+/+ or p38γfl/fl mice. Satellite cells are marked by expression of Syndecan-4 (Sdc4, green) and nuclei were counterstained with DAPI (blue). Scale bar represents 10 μm. See also Figure S2 and Tables S1 and S2.
Figure 3
Figure 3. Phosphorylation of Carm1 by p38γ Restricts Carm1 Subcellular Localization to the Cytoplasm
(A) Schematic of Carm1 FL (isoform 1) and Carm1 ΔE15 (isoform 2). (B) In vitro methylation assays with GST-Carm1 FL or GST-Carm1 ΔE15 with Pax7 or core histone proteins. (C) Densitometric quantification of (B), represented as the mean (n = 3 replicates) ± SEM (*p ≤ 0.05). (D) Immunostaining of Carm1-null primary myoblasts transfected with either wild type, S572A, or S572E Carm1, or pcDNA3. Cells were immunostained with α-tubulin (green), Carm1 (red), and nuclei were counterstained with DAPI (blue). Scale bar represents 10 μm. (E) Quantification of the mean fluorescence intensity of Carm1 expression in the nucleus and cytoplasm from the immunostaining performed in (D) and expressed as a nucleus:cytoplasm expression ratio, represented as the mean (n = 11 WT, n = 13 S572A, n = 13 S572E cells) ± SEM (**p ≤ 0.01. NS, not significant). See also Figure S3.
Figure 4
Figure 4. p38γ Negatively Regulates Asymmetric Satellite Stem Cell Division and is Required for Symmetric Self-Renewal
(A) Schematic of siRNA-treated myofiber culture experiments performed in Figure 4. (EDL, extensor digitorum longus. PLA, proximity ligation assay. IF, immunofluorescence). (B) Carm1:Pax7 PLA (red) performed on satellite cells cultured for 42h on myofibers that were treated with indicated siRNAs. Satellite cells are marked by expression of Sdc4 (green) and nuclei were counterstained with DAPI (blue). Scale bar represents 10 μm. (C) Quantification of PLA signal from (B), represented as the mean (n = 39 si-Ctrl, n = 54 si-p38γ, n = 47 siCarm1 cells from 3 mice) ± SEM (*p ≤ 0.05). The PLA was quantified by counting the number of nuclear PLA puncta for each satellite cell. (D) Immunofluorescence of satellite cells cultured for 42h on myofibers that were treated with either control (si-Ctrl) or p38γ (si-p38γ) siRNA. Cells were immunostained for Sdc4 (green), and Myf5 (red). Nuclei were counterstained with DAPI (blue). Scale bar represents 10 μm. (E) Quantification of mean fluorescence intensity of Myf5 staining from (D), represented as the mean (n = 67 si-Ctrl, n = 69 si-p38γ cells from 3 mice) ± SEM (***p ≤ 0.001). (F) Quantification of the number of asymmetric satellite stem cell (Pax7+/YFP) divisions per myofiber, represented as the mean (n = 9 mice) ± SEM (**p ≤ 0.01. NS, not significant). (G) Quantification of the number of symmetric satellite stem cell (Pax7+/YFP) divisions per myofiber, represented as the mean (n = 9 mice) ± SEM (*p ≤ 0.05. NS, not significant). (H) Quantification of the number of committed satellite progenitor cell (Pax7+/YFP+) divisions per myofiber, represented as the mean (n = 9 mice) ± SEM (NS, not significant). See also Figure S4.
Figure 5
Figure 5. Satellite Cell-Specific Genetic Deletion of p38γ Impairs Muscle Regeneration
(A) Description of mice and schematic of muscle regeneration experiment performed in Figure 5 (CTX, cardiotoxin). (B) Representative H&E stained sections of CTX-injured TA muscle from mice as described in (A). Scale bar represents 50 μm. (C) Quantification of Pax7+ satellite cells normalized to TA cross-sectional area, represented as the mean (n = 4 p38γ+/+, n = 3 p38γfl/+, n = 3 p38γfl/fl mice) ± SEM (*p ≤ 0.05, **p ≤ 0.01). (D) Ratio of the weight of injured TA muscle to total body weight, represented as the mean ± SEM (*p ≤ 0.05, **p ≤ 0.01). See also Figure S5.
Figure 6
Figure 6. p38γ/Carm1 interacts with β1-Syntrophin in Satellite Cells
(A) Immunofluorescence of satellite cells cultured for 36h on myofibers isolated from wild type (WT) or mdx mice. Cells were immunostained for α7 integrin (white), β1-syntrophin (green), and p38γ (red). Nuclei were counterstained with Hoechst (blue). Scale bar represents 10 μm. (B, C, and D) PLA with indicated antibodies (red) performed on satellite cells cultured for 36h on single EDL myofibers. Satellite cells were identified by their expression of α7 integrin (white) and nuclei were counterstained with DAPI (blue). Scale bar represents 10 μm. (E, and F) PLA with indicated antibodies (red) performed on satellite cells cultured for 36h on single myofibers isolated from either WT or mdx mice. Satellite cells were identified by their expression of Sdc4 (green) and nuclei were counterstained with DAPI (blue). Scale bar represents 10 μm. (G) Quantification of PLA in (F), represented as the relative mean (n = 21 WT, n = 26 mdx cells from 3 mice) ± SEM (**p ≤ 0.01). The PLA was quantified by measuring mean fluorescence intensity of the PLA signal for each satellite cell. See also Figures S6 and S7.
Figure 7
Figure 7. Carm1-Mediated Epigenetic Regulation of Myf5 Expression is Altered in mdx Cells
(A) Carm1:Pax7 PLA (red) performed on satellite cells cultured for 36h on single myofibers isolated from either wild type (WT) or mdx mice. Satellite cells were identified by their expression of Sdc4 (green) and nuclei were counterstained with DAPI (blue). Scale bar represents 10 μm. (B) Quantification of PLA in (A), represented as the relative mean (n = 81 WT, n = 137 mdx cells from 3 mice) ± SEM (***p ≤ 0.001). The PLA was quantified by counting the number of nuclear PLA puncta for each satellite cell. (C) Carm1:Pax7 PLA (red) performed on satellite cells cultured for 36h on myofibers that were treated with either control or β1-syntrophin siRNA. Satellite cells are marked by expression of Sdc4 (green) and nuclei were counterstained with DAPI (blue). Scale bar represents 10 μm. (D) Quantification of PLA in (C), represented as the relative mean (n = 53 si-Ctrl, n = 73 si-SNTB1 cells from 3 mice) ± SEM (*p ≤ 0.05). The PLA was quantified by counting the number of nuclear PLA puncta for each satellite cell. (E) Chromatin immunoprecipitation (ChIP)-qPCR analysis of H3K4me3 at Myf5 in WT and mdx primary myoblasts represented as the mean (n = 4 WT, n = 4 mdx mice) ± SEM (*p ≤ 0.05, **p ≤ 0.01). (F) RT-qPCR analysis of Myf5 expression in freshly sorted satellite cells from WT and mdx mice represented as the mean (n = 3 WT, n = 4 mdx mice) ± SEM (**p ≤ 0.01). (G) RT-qPCR analysis of Myf5 expression in WT and mdx primary myoblasts represented as the mean (n = 11 WT, n = 4 mdx mice) ± SEM (*p ≤ 0.05). (H) RT-qPCR analysis of indicated genes in satellite cell-derived primary myoblasts isolated from WT and mdx mice that were treated with control and p38γ siRNA. Fold changes are shown relative to control siRNA-treated cells on a log base 2 axis and are represented as the mean (n = 3 replicates from 3 mice) ± SEM (**p ≤ 0.01, ***p ≤ 0.001). See also Figure S7.

References

    1. Bernet JD, Doles JD, Hall JK, Kelly Tanaka K, Carter TA, Olwin BB. p38 MAPK signaling underlies a cell-autonomous loss of stem cell self-renewal in skeletal muscle of aged mice. Nat Med. 2014;20:265–271. - PMC - PubMed
    1. Bibee KP, Cheng YJ, Ching JK, Marsh JN, Li AJ, Keeling RM, Connolly AM, Golumbek PT, Myerson JW, Hu G, et al. Rapamycin nanoparticles target defective autophagy in muscular dystrophy to enhance both strength and cardiac function. FASEB J. 2014;28:2047–2061. - PMC - PubMed
    1. Bulfield G, Siller WG, Wight PA, Moore KJ. X chromosome-linked muscular dystrophy (mdx) in the mouse. Proc Natl Acad Sci U S A. 1984;81:1189–1192. - PMC - PubMed
    1. Burgess A, Vigneron S, Brioudes E, Labbe JC, Lorca T, Castro A. Loss of human Greatwall results in G2 arrest and multiple mitotic defects due to deregulation of the cyclin B-Cdc2/PP2A balance. Proc Natl Acad Sci U S A. 2010;107:12564–12569. - PMC - PubMed
    1. Campbell KP, Kahl SD. Association of dystrophin and an integral membrane glycoprotein. Nature. 1989;338:259–262. - PubMed

Publication types

MeSH terms

Substances

LinkOut - more resources