

Body size reference norms and subjective weight status: A gender and life course approach
- PMID: 29681662
- PMCID: PMC5905672
- DOI: 10.1093/sf/sox073
Body size reference norms and subjective weight status: A gender and life course approach
Abstract
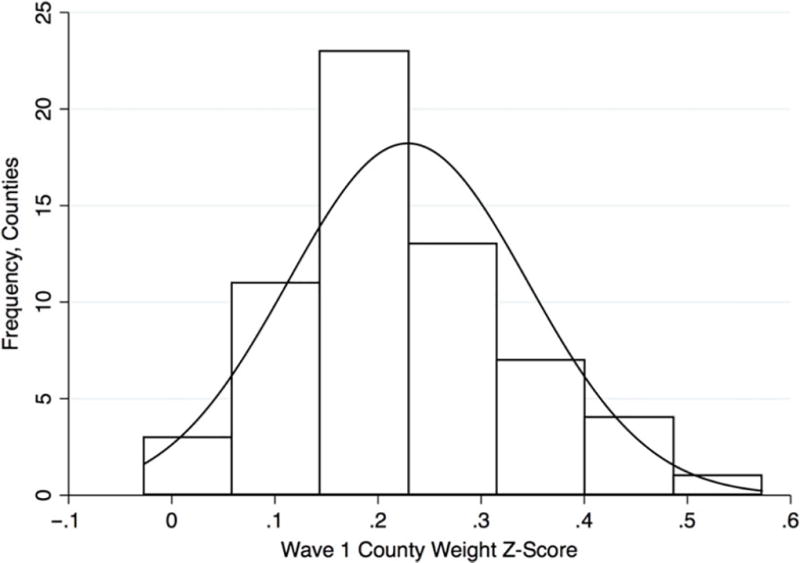
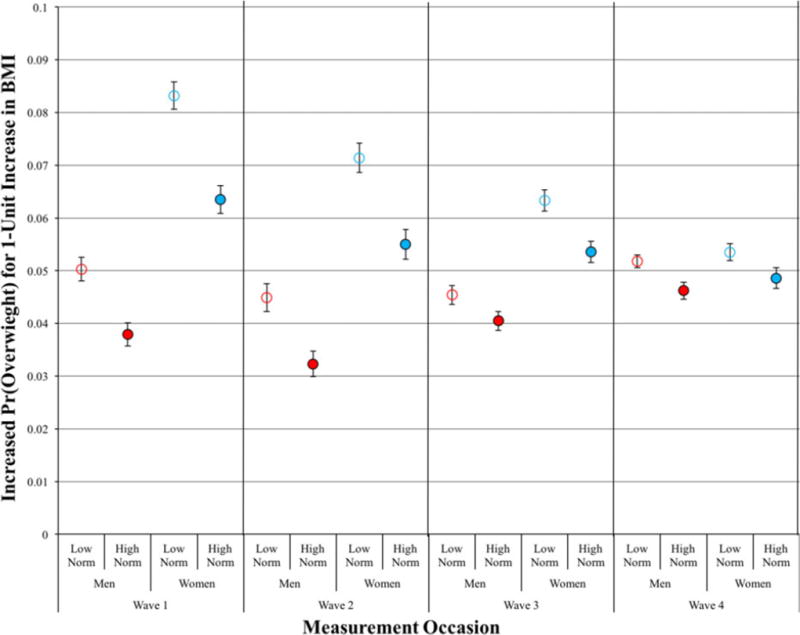
This paper uses data from The National Longitudinal Study of Adolescent to Adult Health (Add Health) to describe county-level variation in norms regarding physical weight among adolescents in the United States. We demonstrate that regardless of one's physical size, those residing in counties with a heavier weight norm are significantly less likely to see themselves as overweight than those residing in counties with a light weight norm. We further show that the local weight norm during adolescence (Wave 1) is associated with individuals' weight perceptions through adolescence and into young adulthood (Wave 4), though these associations attenuate in strength as respondents age. Our results suggest that weight norms have a stronger influence on weight perceptions among women compared to men and that the role of gender is particularly important during adolescence. We encourage life course researchers to consider the normative health environment during adolescence as an important context for understanding disparities in health and health lifestyles as people age.
Keywords: contextual variation; gender; life course; reference groups; self-perceived weight status; weight norms.
Figures
Similar articles
-
Gender Norms and Gender Equality in Full-Time Employment and Health: A 97-Country Analysis of the World Values Survey.Front Psychol. 2022 May 31;13:689815. doi: 10.3389/fpsyg.2022.689815. eCollection 2022. Front Psychol. 2022. PMID: 35769749 Free PMC article.
-
Overweight or about right? A norm comparison explanation of perceived weight status.Obes Sci Pract. 2017 Mar;3(1):36-43. doi: 10.1002/osp4.89. Epub 2017 Jan 25. Obes Sci Pract. 2017. PMID: 28392930 Free PMC article.
-
Breakfast consumption in adolescence and young adulthood: parental presence, community context, and obesity.J Am Diet Assoc. 2009 Aug;109(8):1384-91. doi: 10.1016/j.jada.2009.05.008. J Am Diet Assoc. 2009. PMID: 19631044
-
A gender framework for understanding health lifestyles.Soc Sci Med. 2020 Nov;265:113182. doi: 10.1016/j.socscimed.2020.113182. Epub 2020 Jul 29. Soc Sci Med. 2020. PMID: 32942201 Free PMC article.
-
Adolescent gender norms and adult health outcomes in the USA: a prospective cohort study.Lancet Child Adolesc Health. 2019 Aug;3(8):529-538. doi: 10.1016/S2352-4642(19)30160-9. Epub 2019 May 30. Lancet Child Adolesc Health. 2019. PMID: 31155319 Free PMC article.
Cited by
-
Social body weight norms: a population-based profile in Germany, the Netherlands, and the United States.BMC Public Health. 2025 Mar 5;25(1):876. doi: 10.1186/s12889-025-21449-5. BMC Public Health. 2025. PMID: 40045236 Free PMC article.
-
Different Categories of Social Media Use and Their Association With Body Image Among Adolescents in 42 Countries.Int J Public Health. 2024 Jul 3;69:1606944. doi: 10.3389/ijph.2024.1606944. eCollection 2024. Int J Public Health. 2024. PMID: 39022445 Free PMC article.
-
The associations between relative and absolute body mass index with mortality rate based on predictions from stigma theory.SSM Popul Health. 2022 Aug 10;19:101200. doi: 10.1016/j.ssmph.2022.101200. eCollection 2022 Sep. SSM Popul Health. 2022. PMID: 36033349 Free PMC article.
-
Do high school experiences shape midlife body weight?Soc Sci Med. 2025 Feb;367:117693. doi: 10.1016/j.socscimed.2025.117693. Epub 2025 Jan 16. Soc Sci Med. 2025. PMID: 39892044
-
Body Weight Perception and Other Factors Associated with Overweight and Obesity in U.S. Adolescents.Children (Basel). 2025 Jan 29;12(2):169. doi: 10.3390/children12020169. Children (Basel). 2025. PMID: 40003273 Free PMC article.
References
-
- Andreyeva Tatiana, Puhl Rebecca M, Brownell Kelly D. Changes in Perceived Weight Discrimination among Americans, 1995–1996 through 2004–2006. Obesity. 2008;16:1129–1134. - PubMed
-
- Anderson Charles B, Bulik Cynthia M. Gender Differences in Compensatory Behaviors, Weight and Shape Salience, and Drive for Thinness. Eating Behaviors. 2004;5(1):1–11. - PubMed
-
- Archer Edward, et al. Validation of a Novel Protocol for Calculating Estimated Energy Requirements and Average Daily Physical Activity Ratio for the US Population: 2005–2006. Mayo Clinic Proceedings. 2013;88(12) - PubMed
Grants and funding
LinkOut - more resources
Full Text Sources
Other Literature Sources
