. 2018 Mar:89:177-301.
doi: 10.1016/j.simyco.2018.03.002. Epub 2018 Mar 7.

Cladosporium species in indoor environments

Affiliations

Cladosporium species in indoor environments

K Bensch et al. Stud Mycol. 2018 Mar.

Abstract

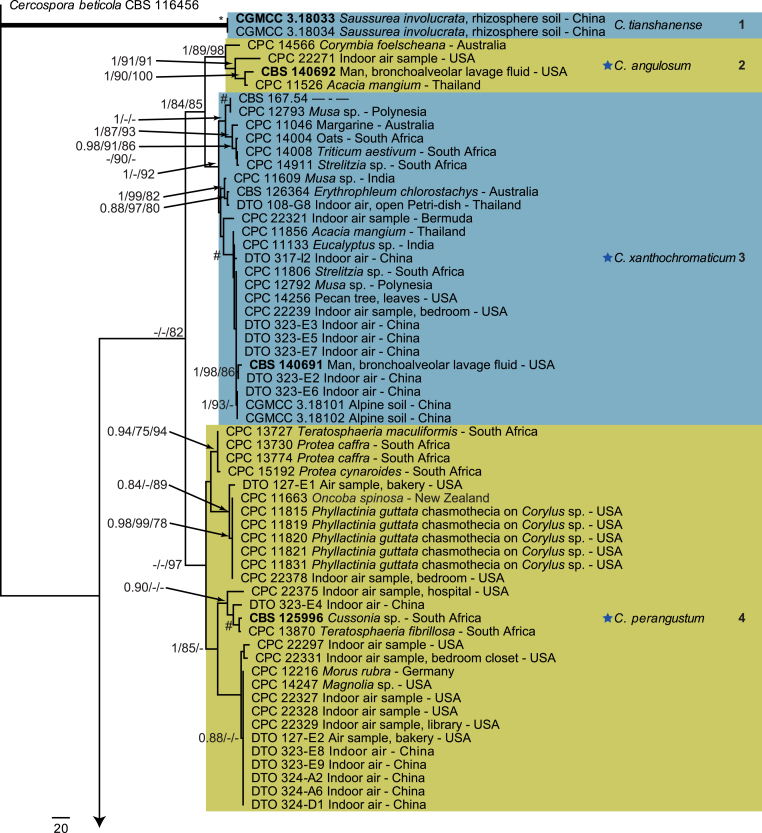
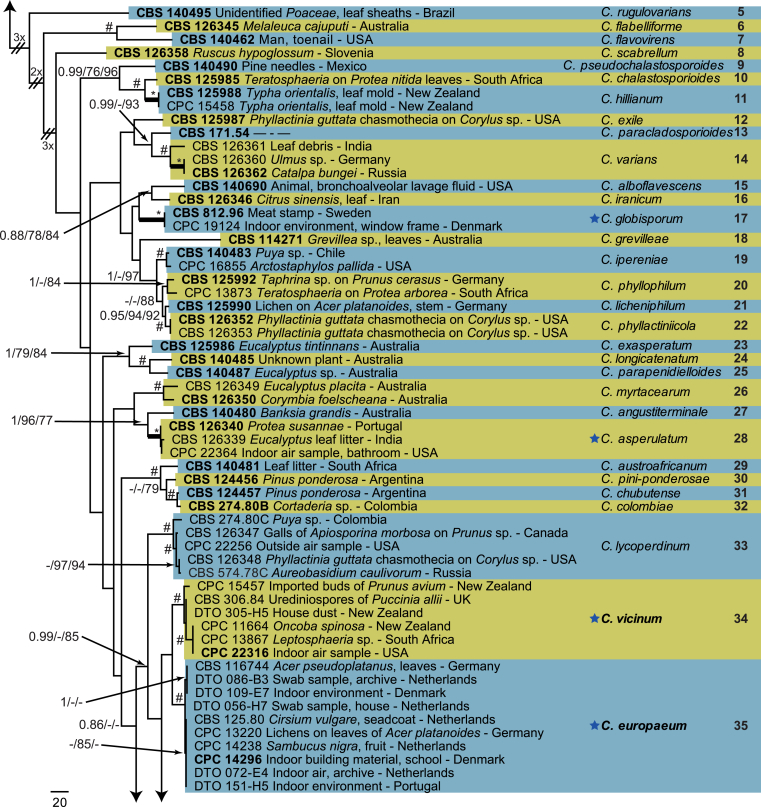
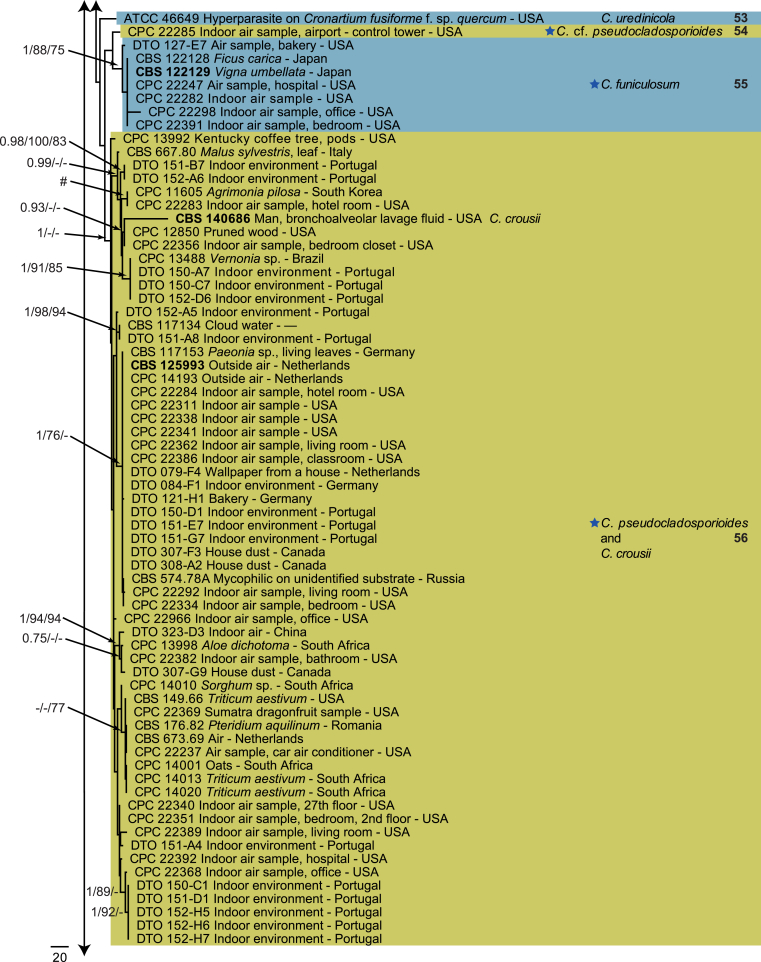
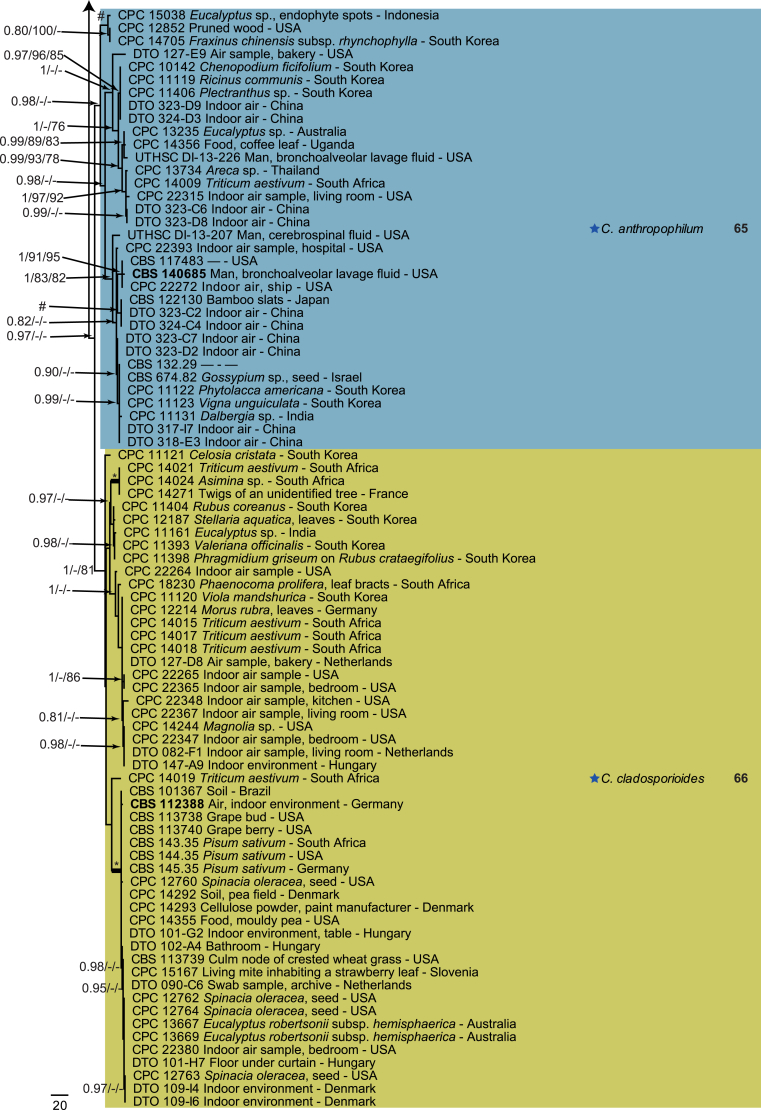
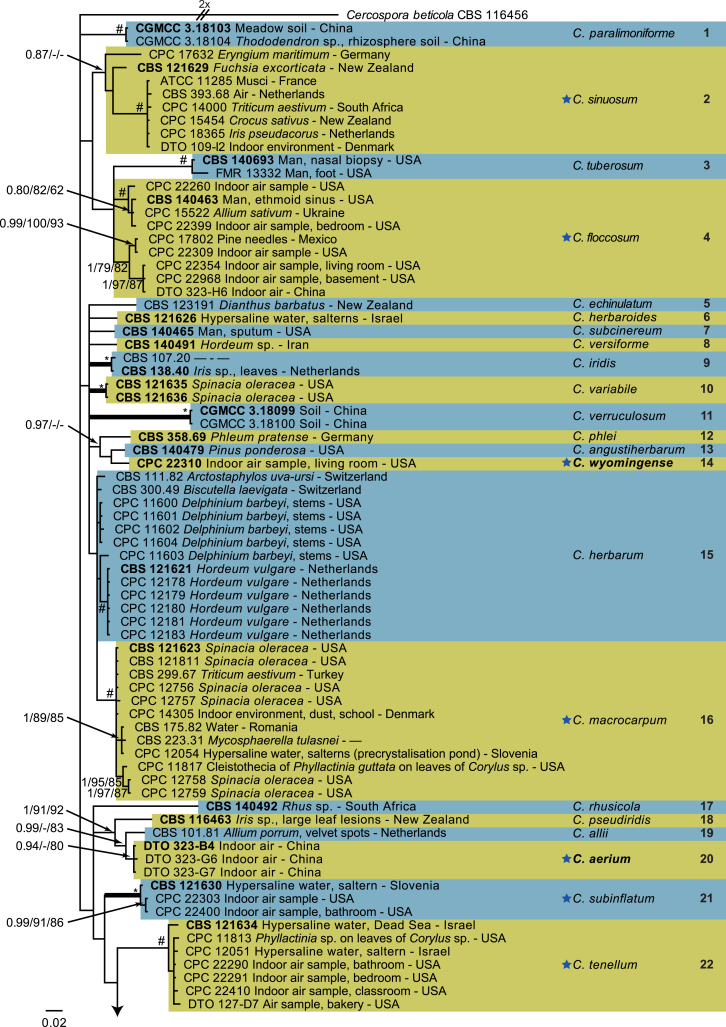
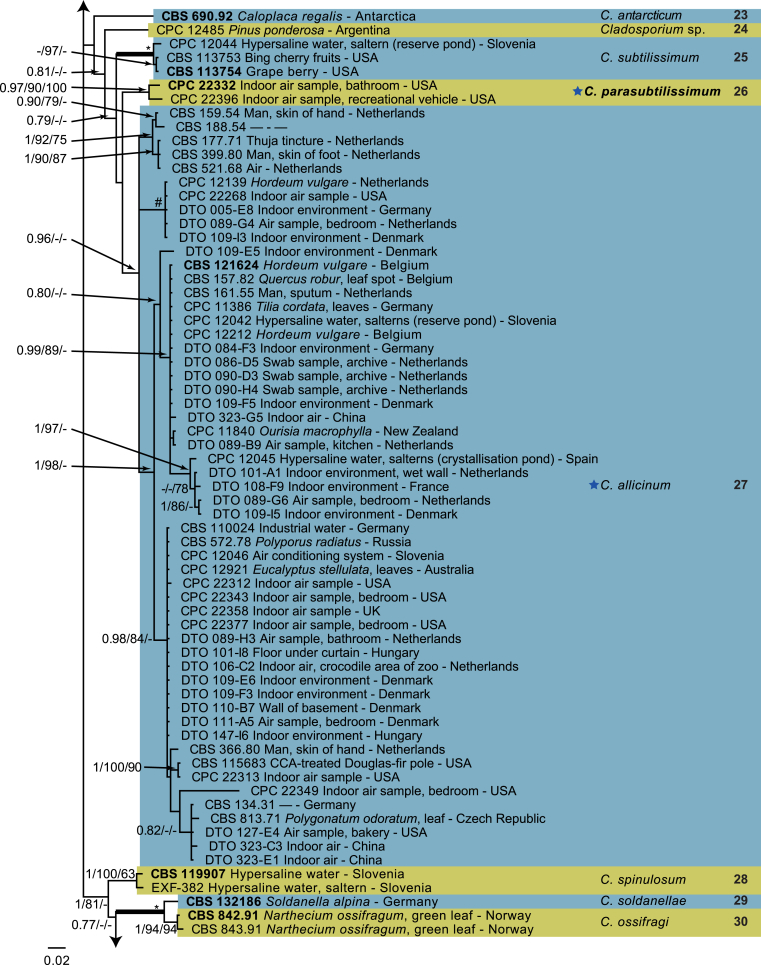
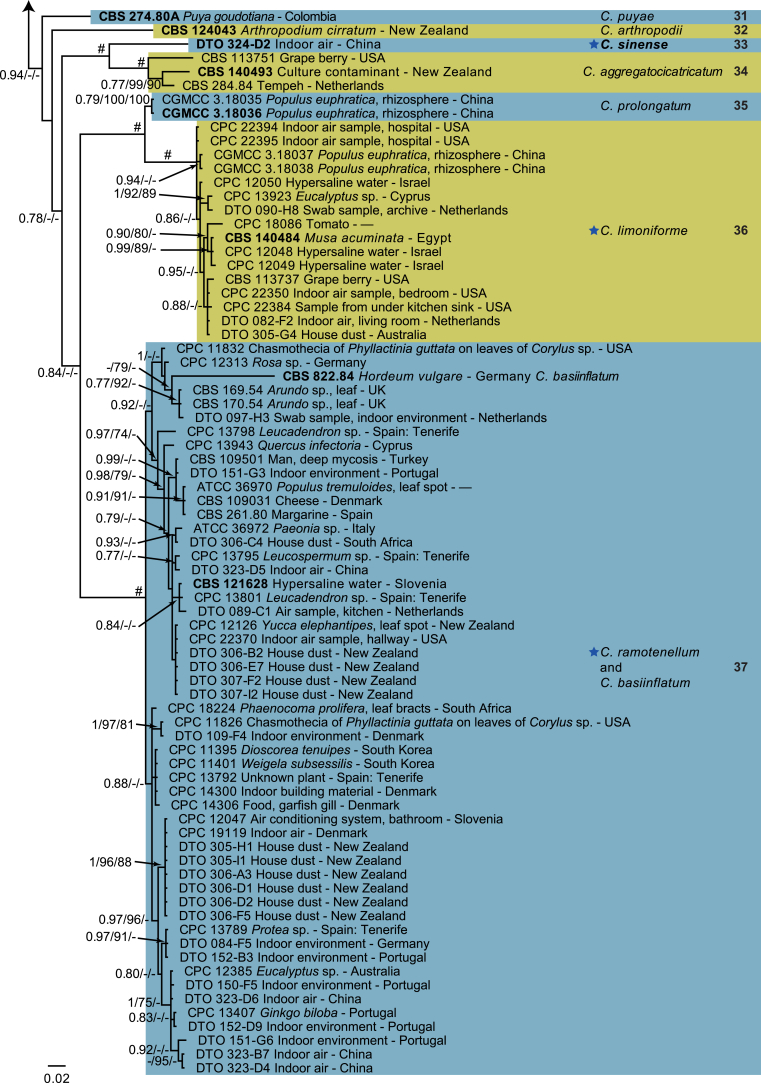
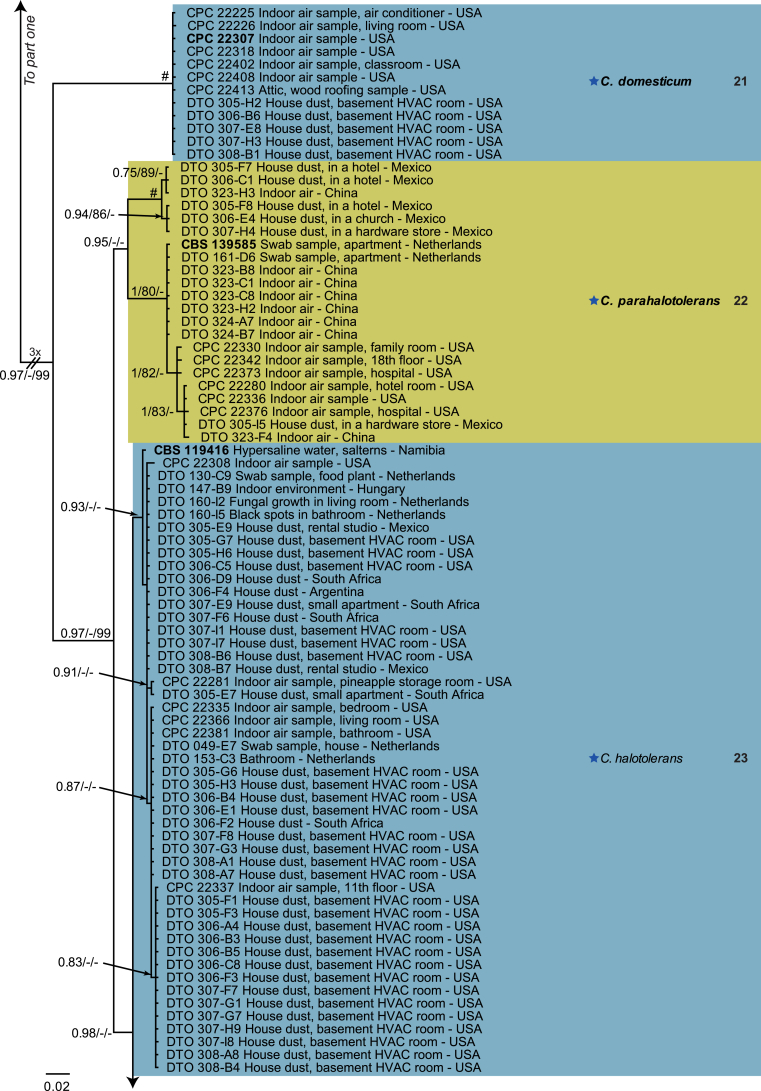
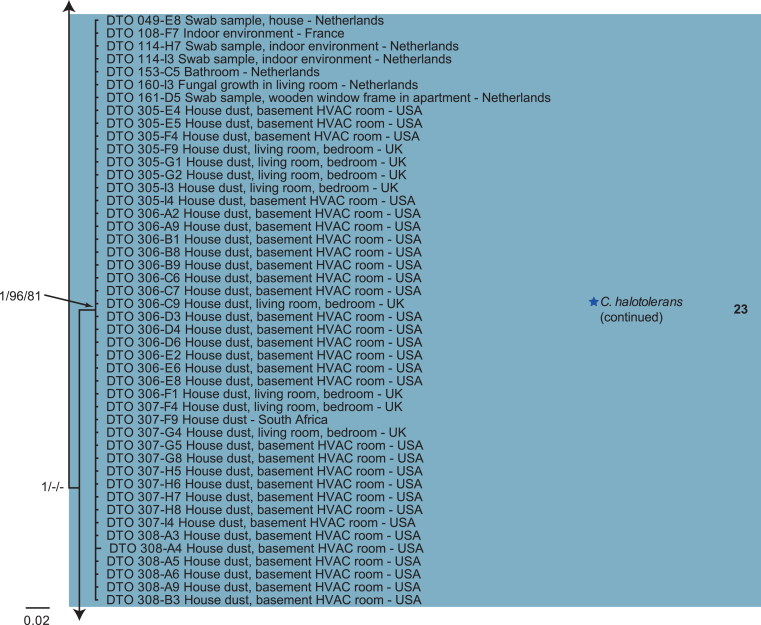
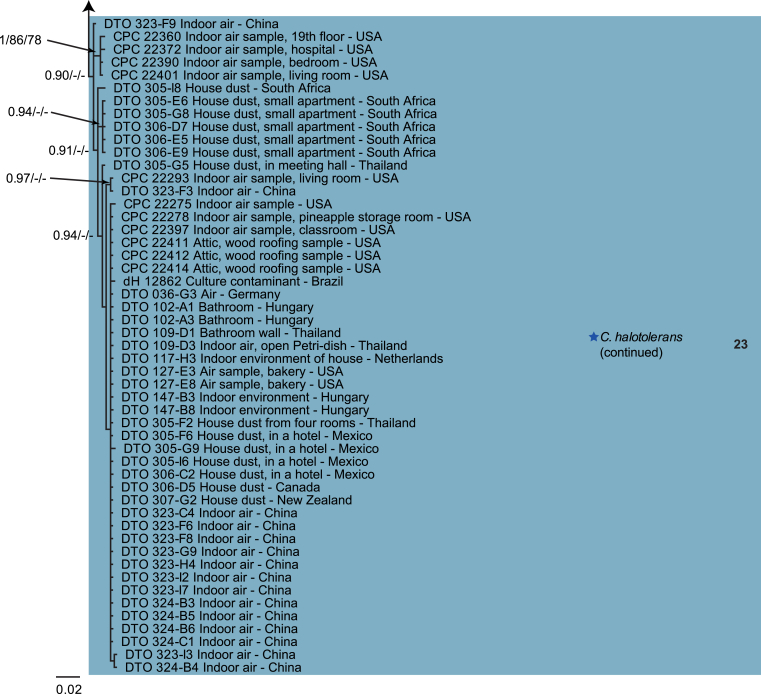
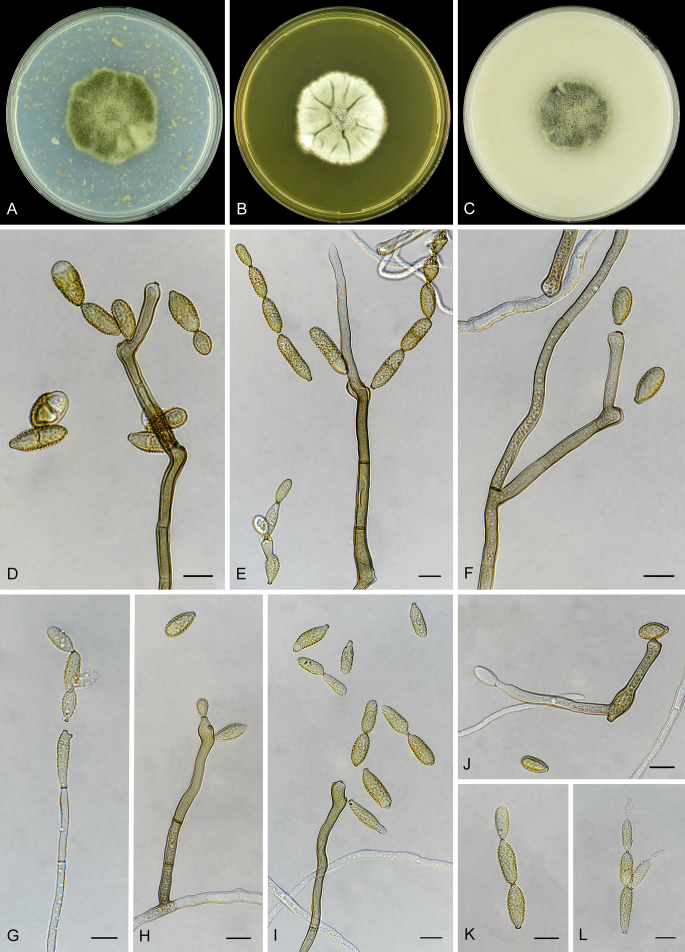
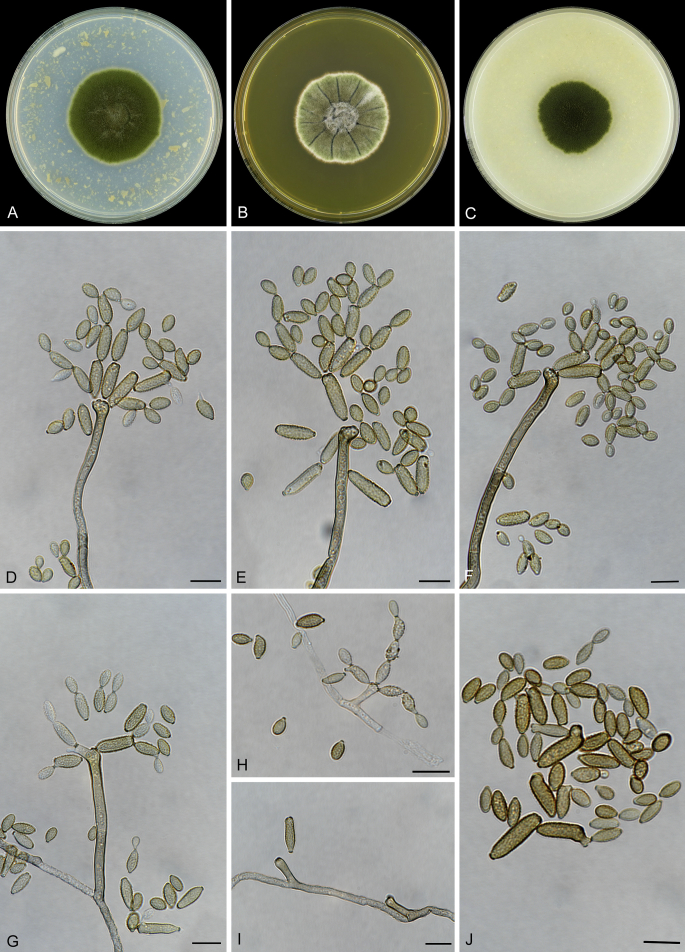
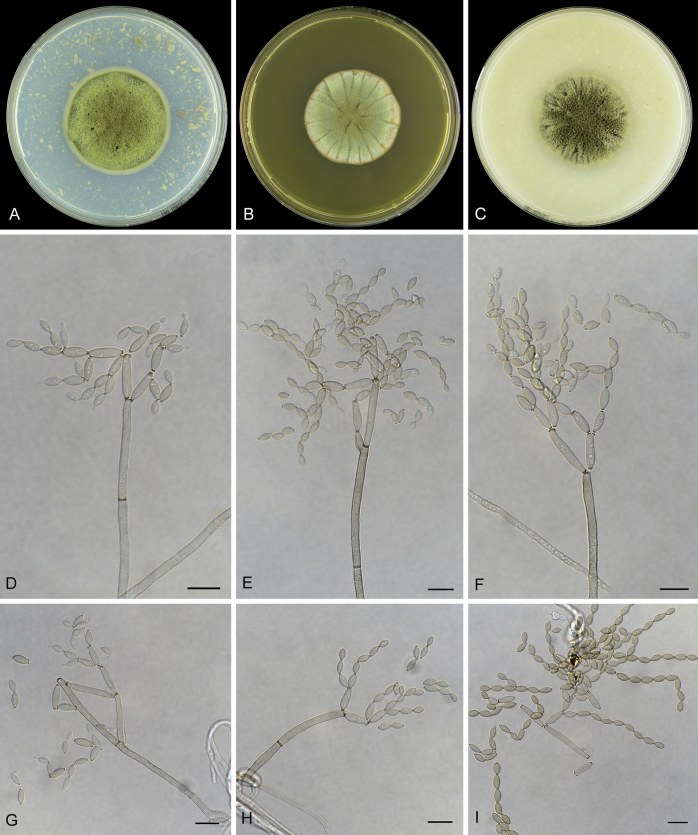
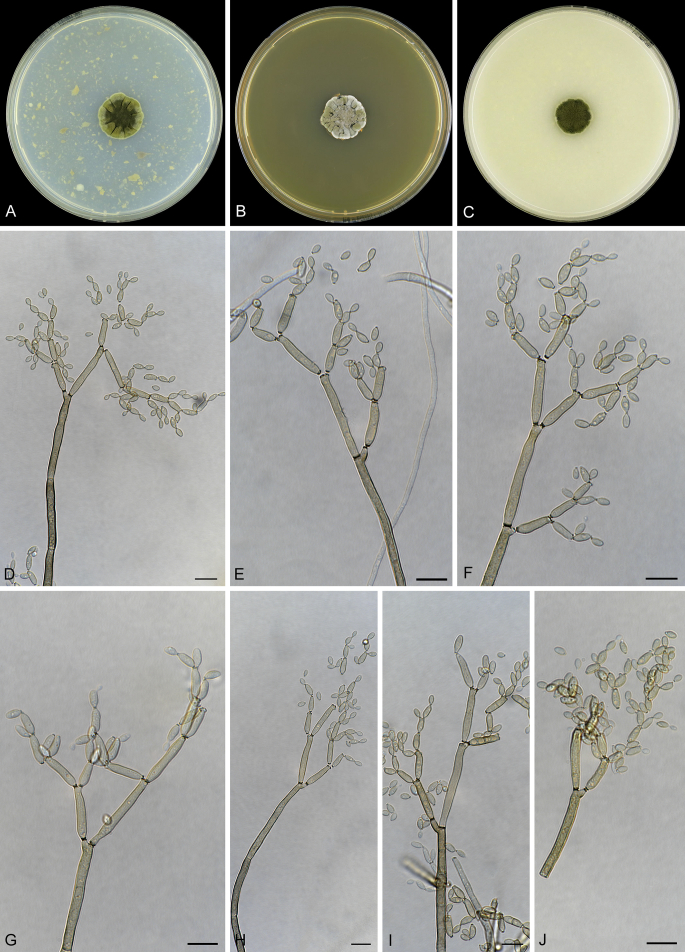
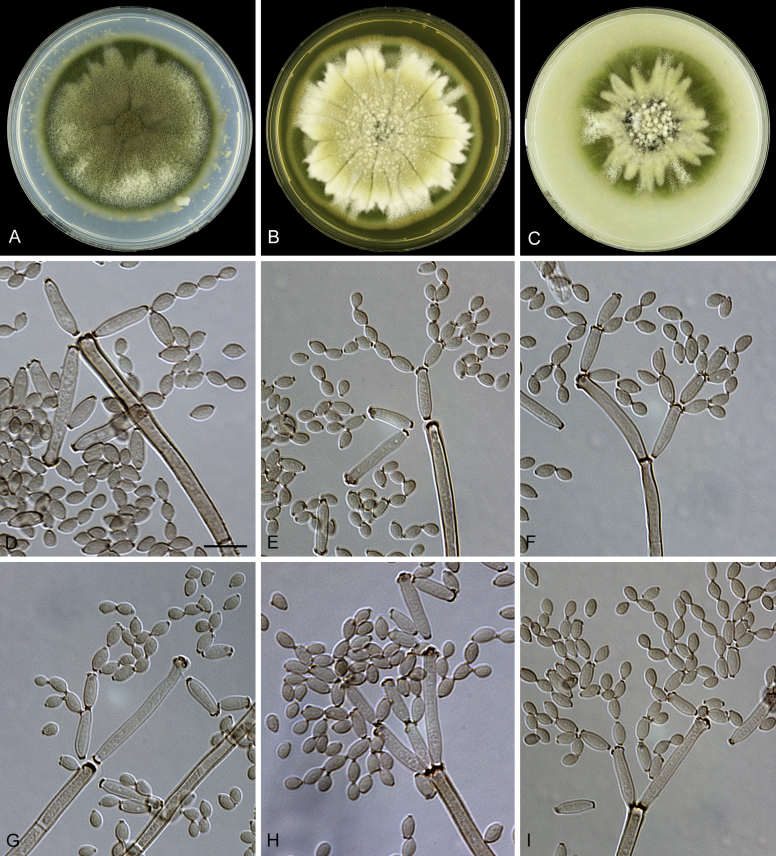
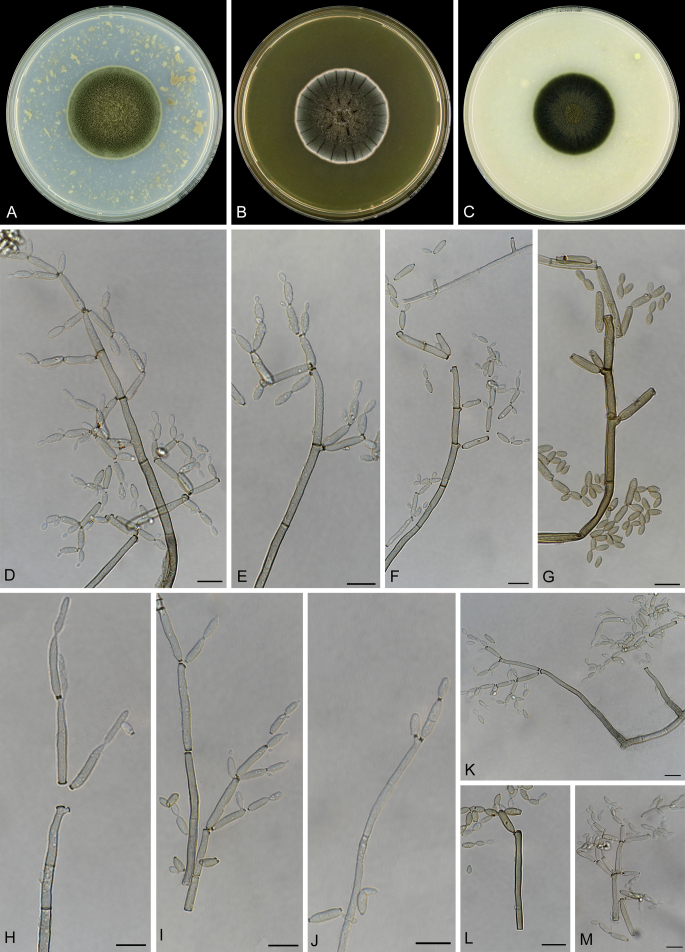
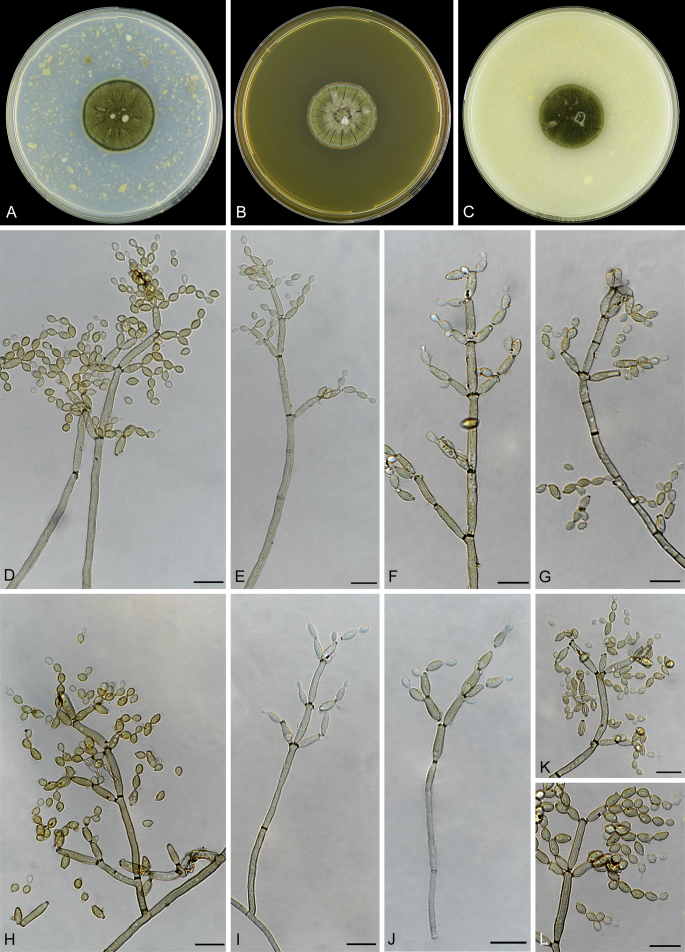
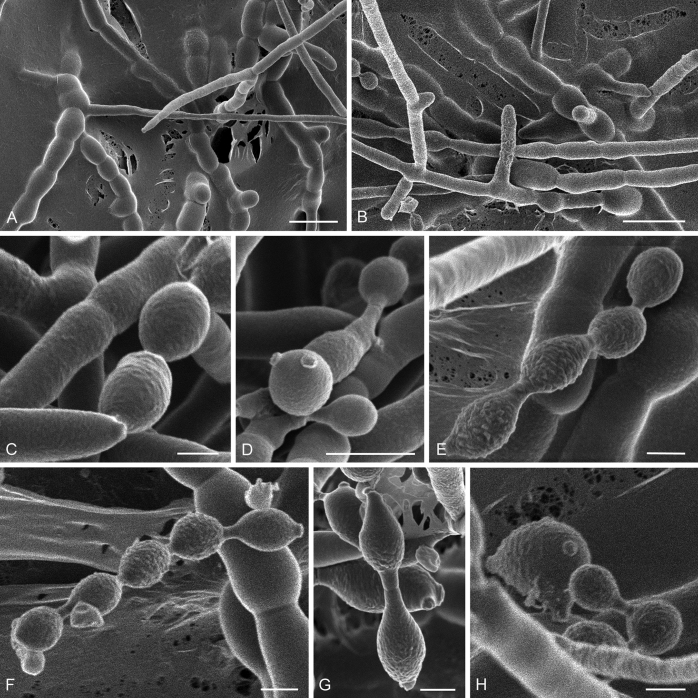
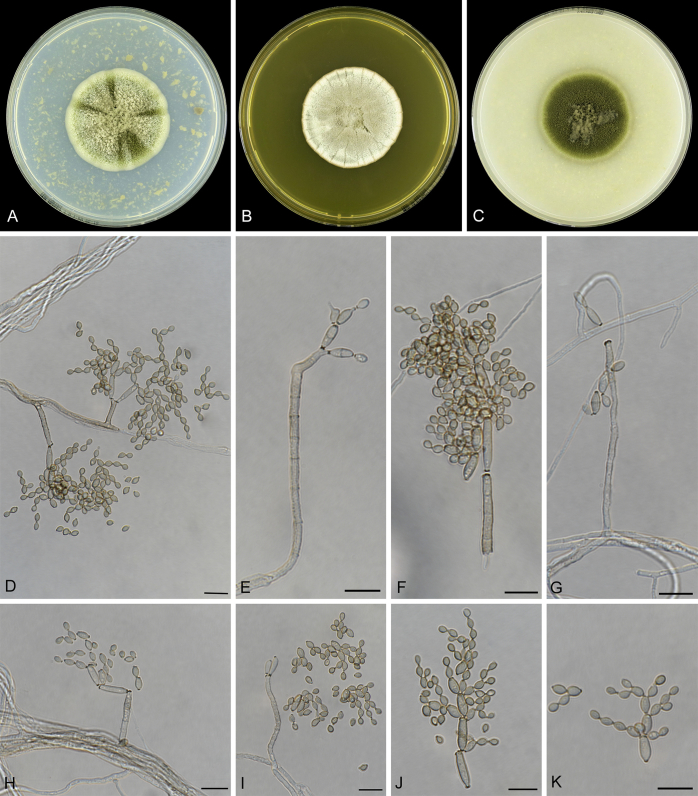
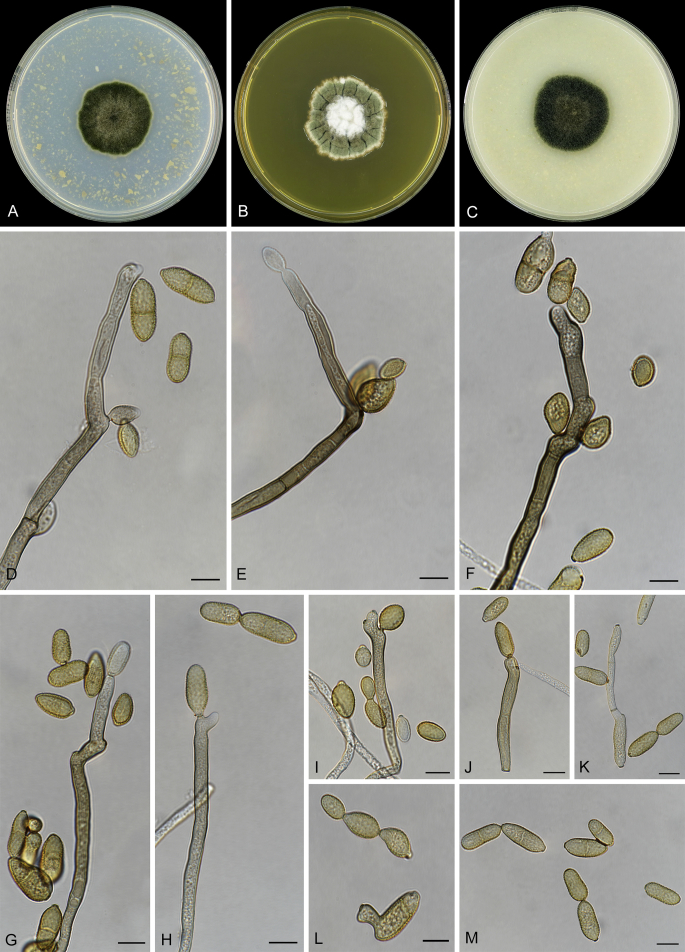
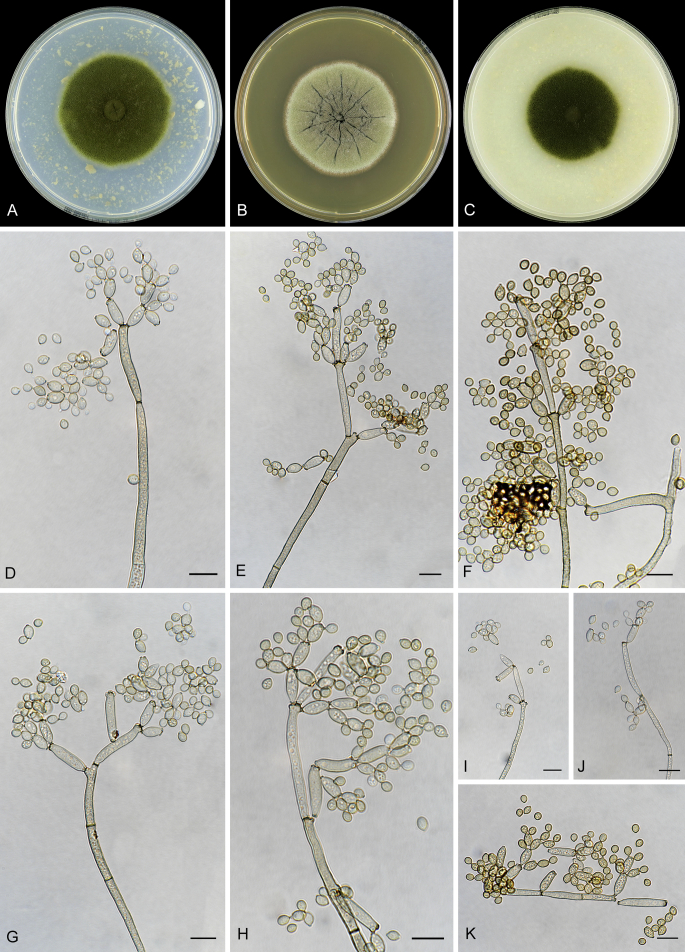
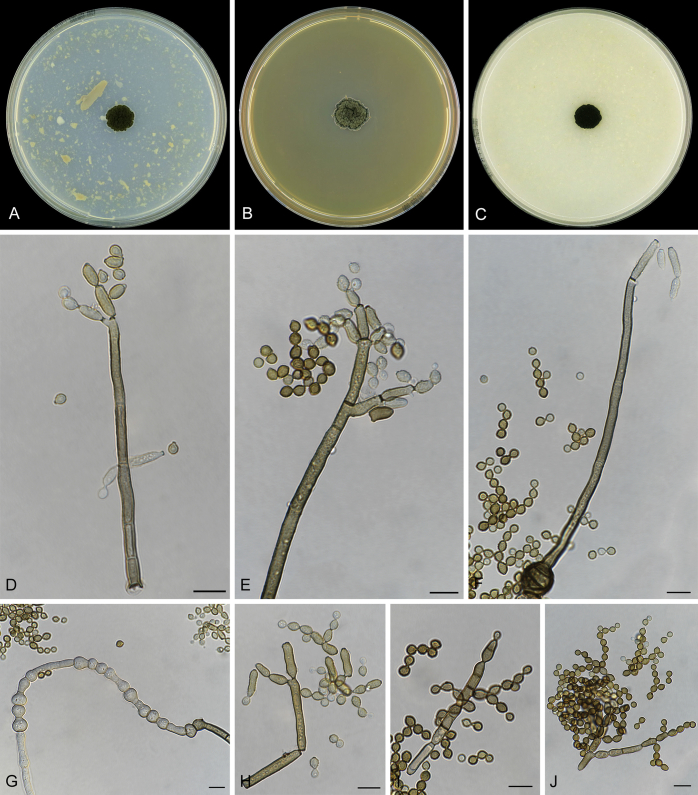
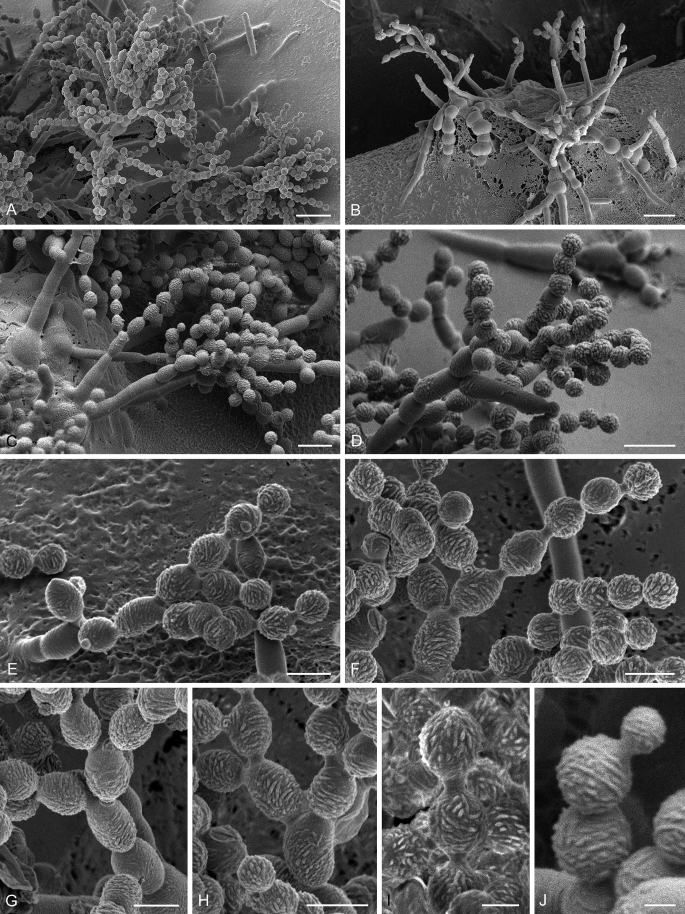
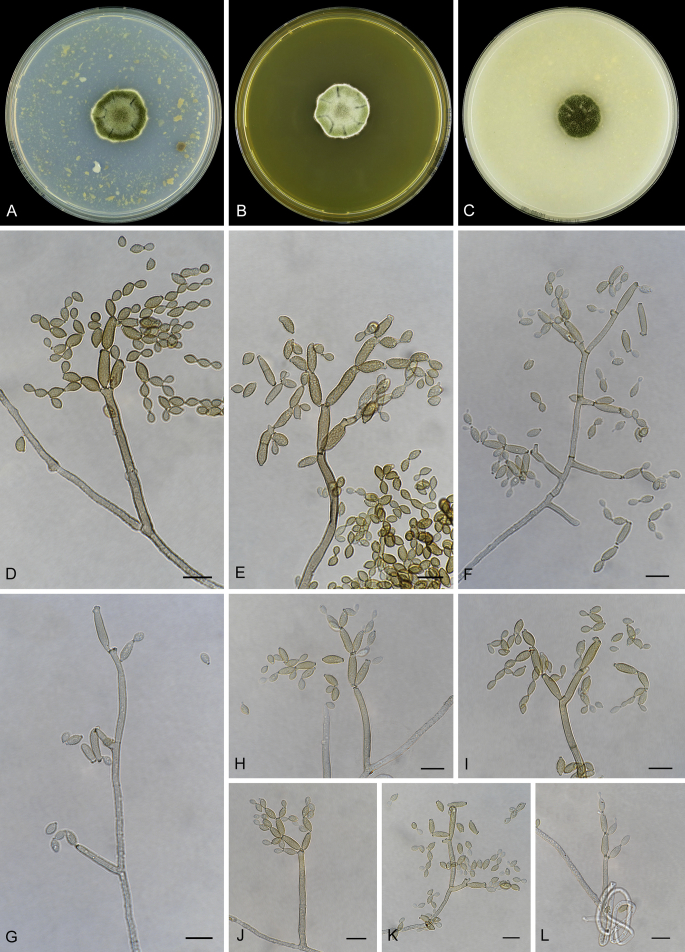
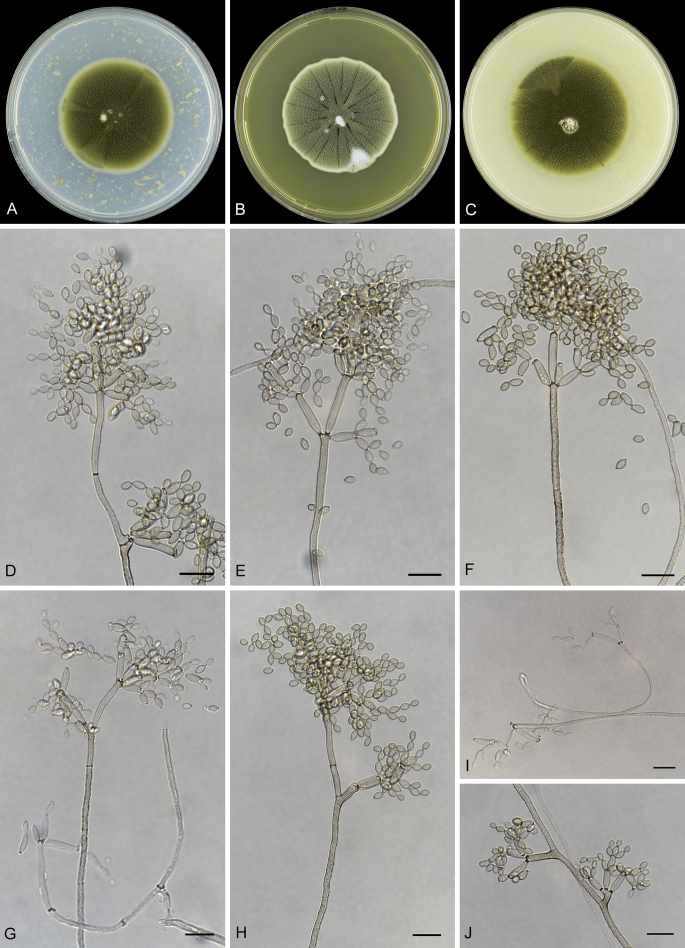
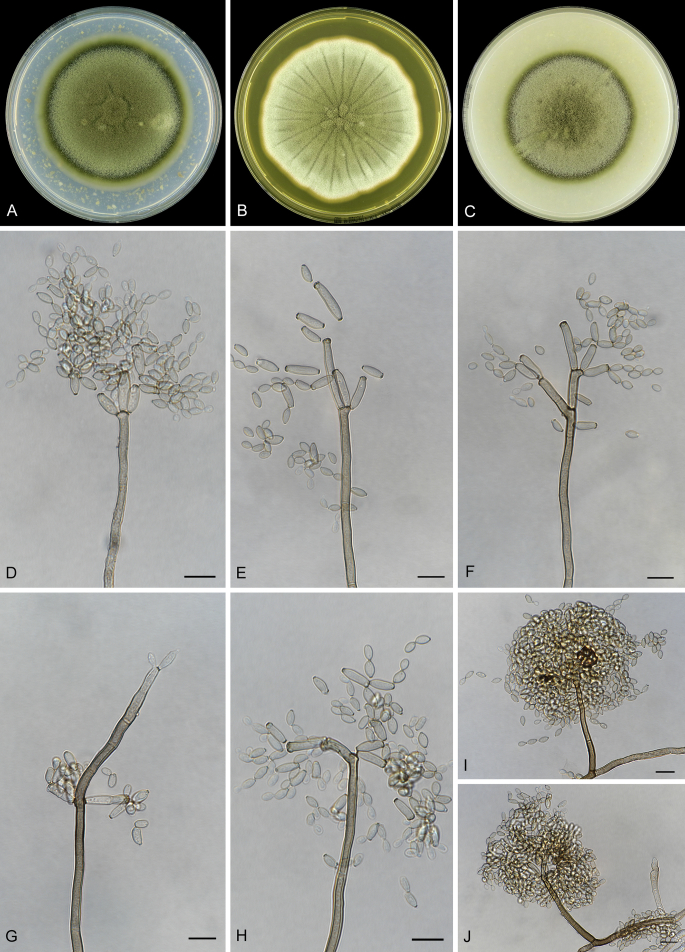
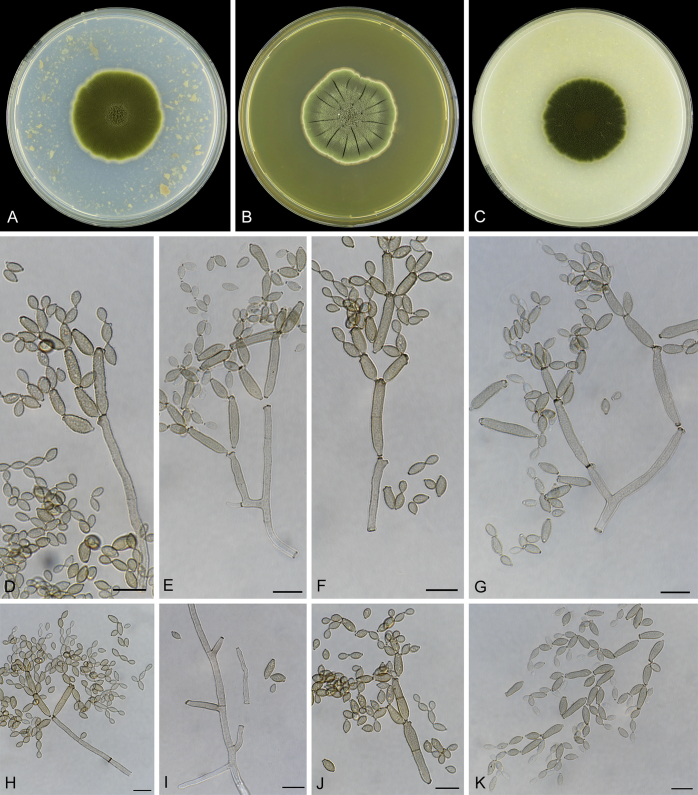
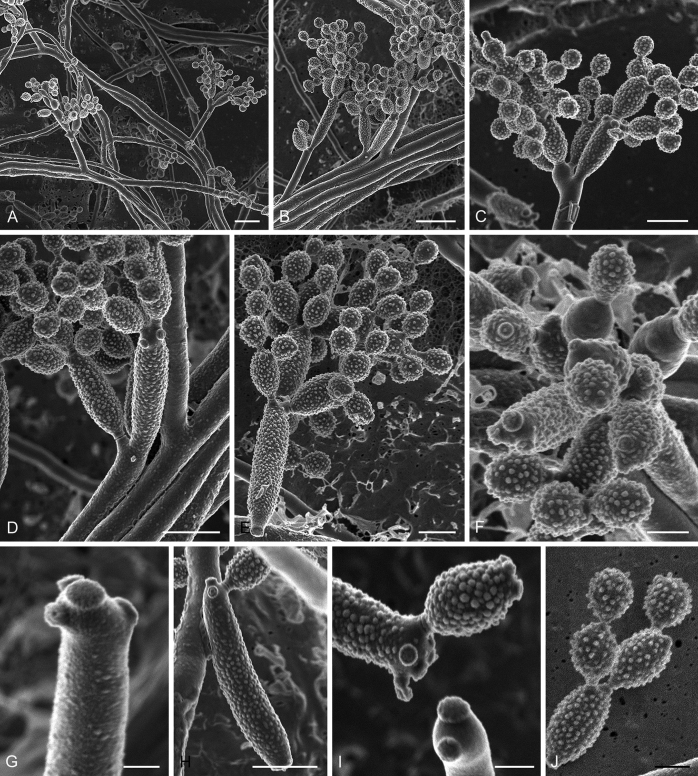
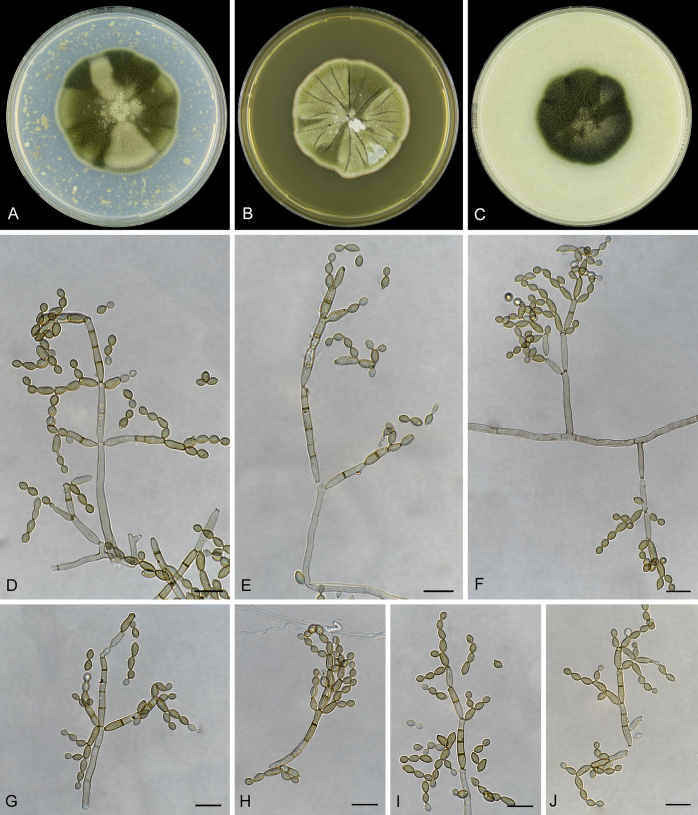
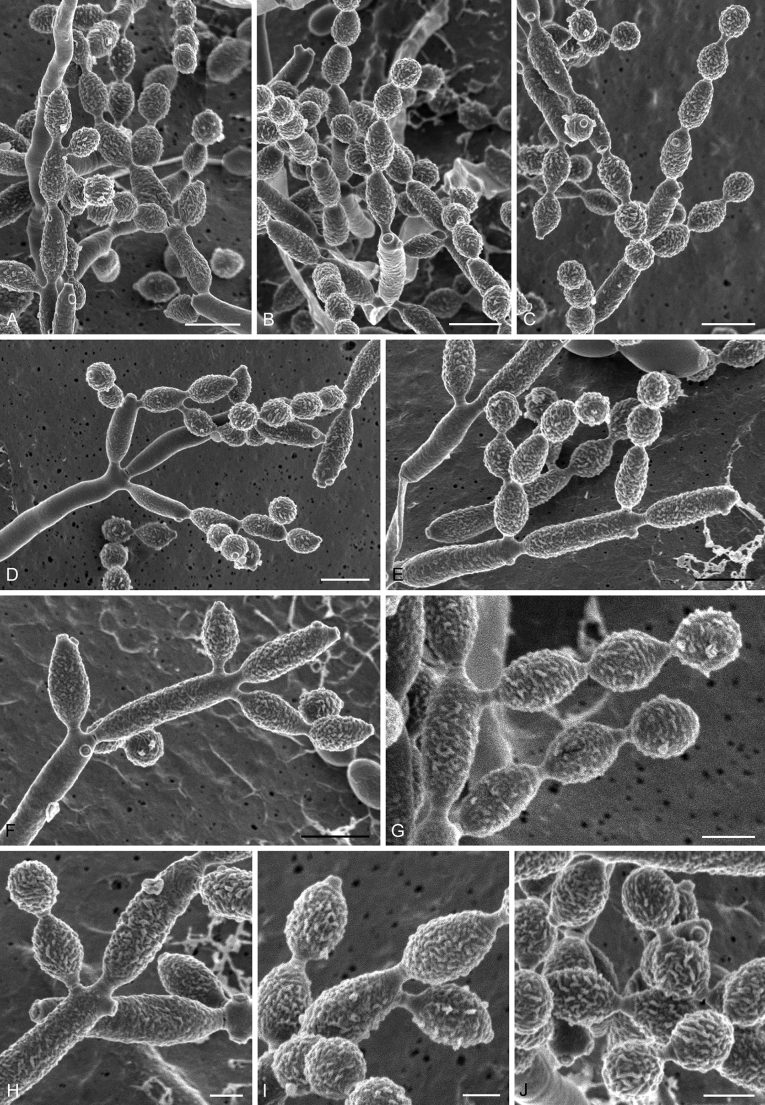
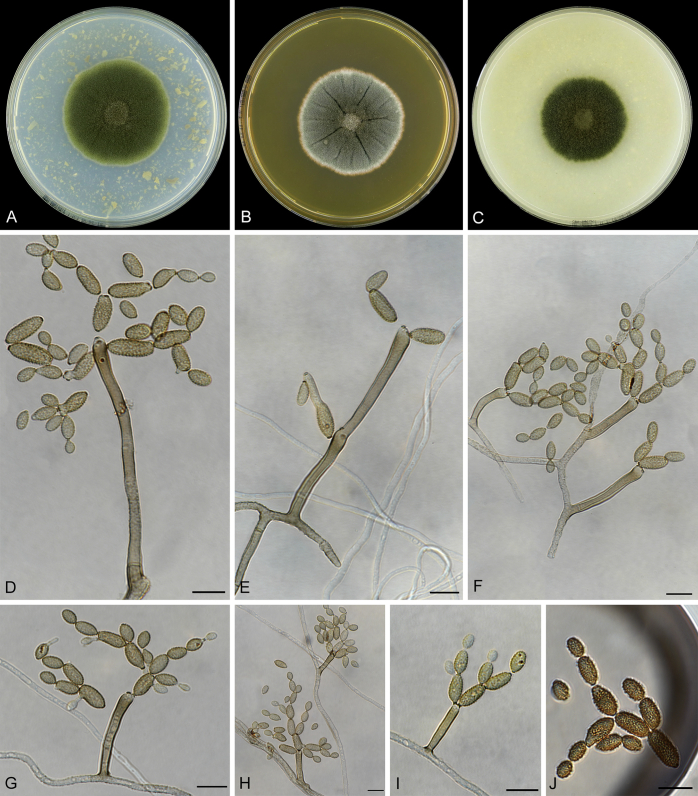
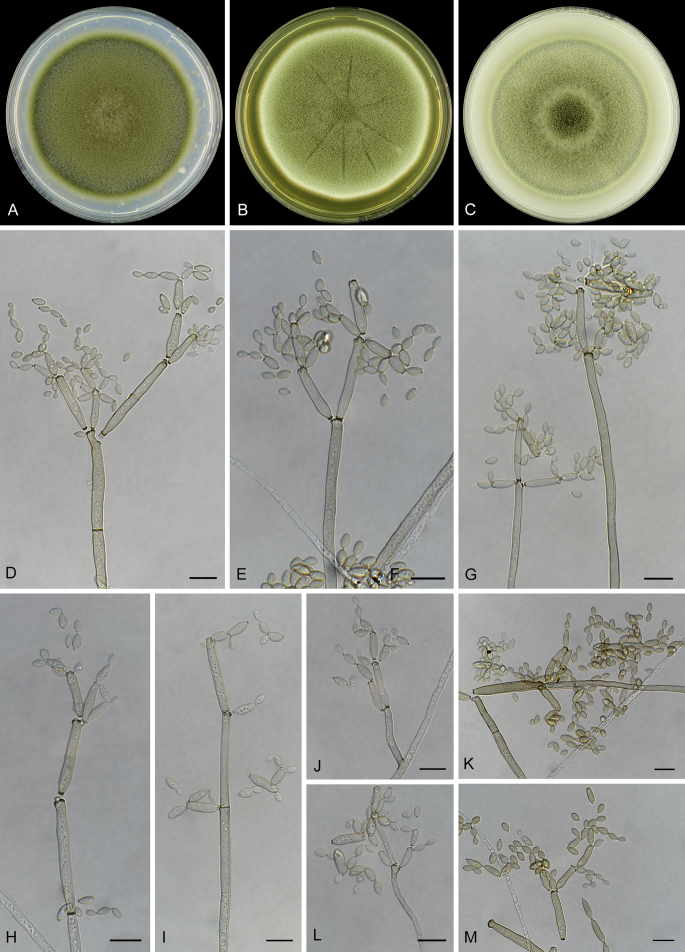
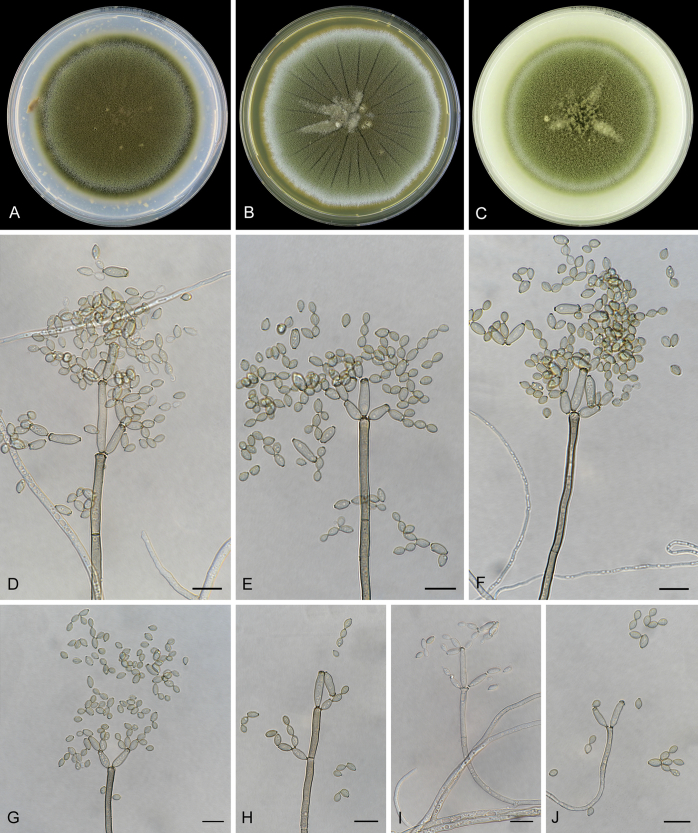
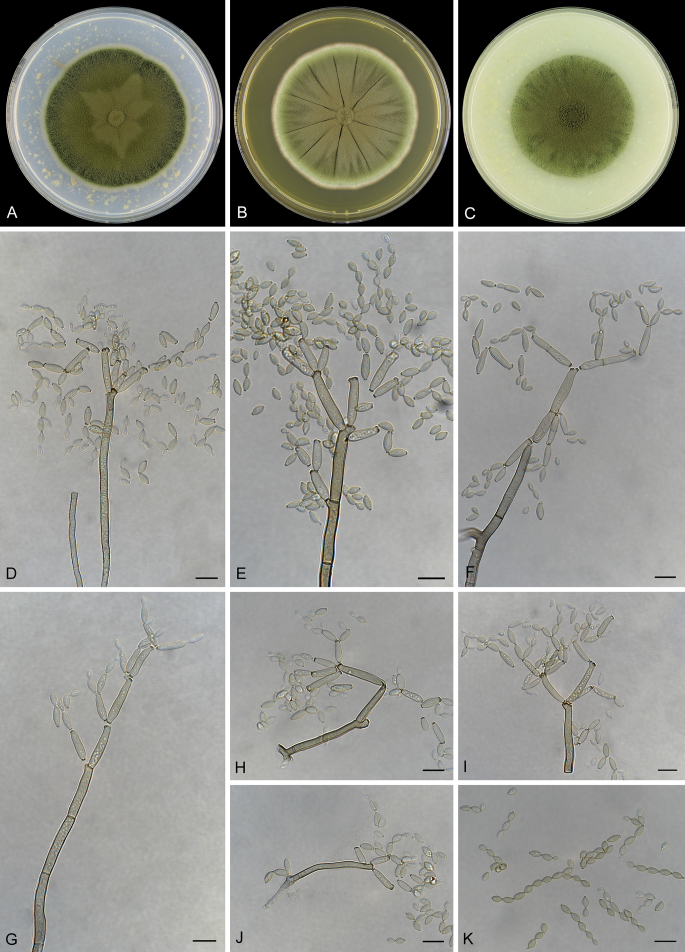
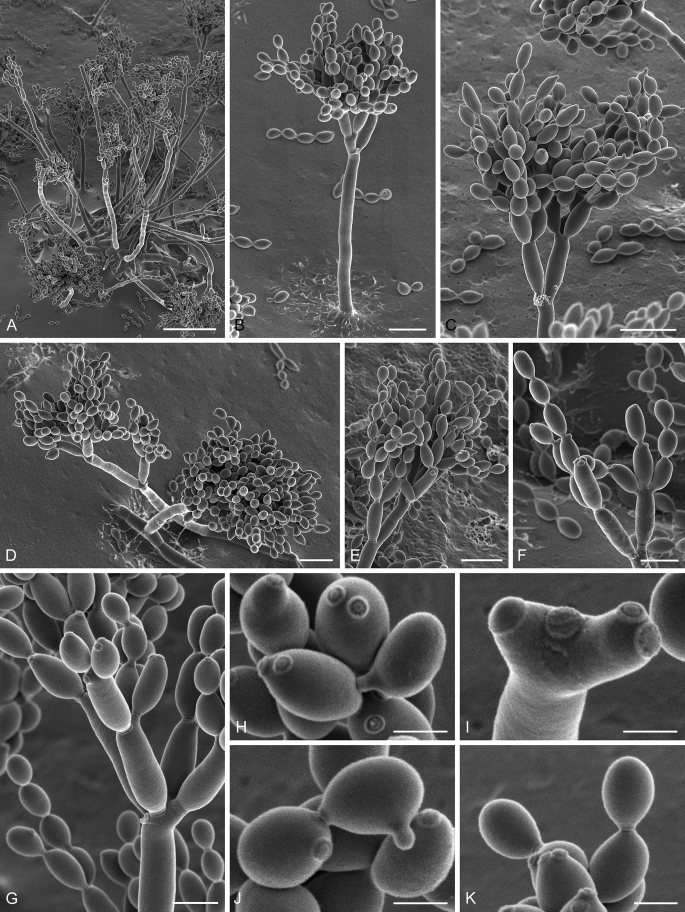
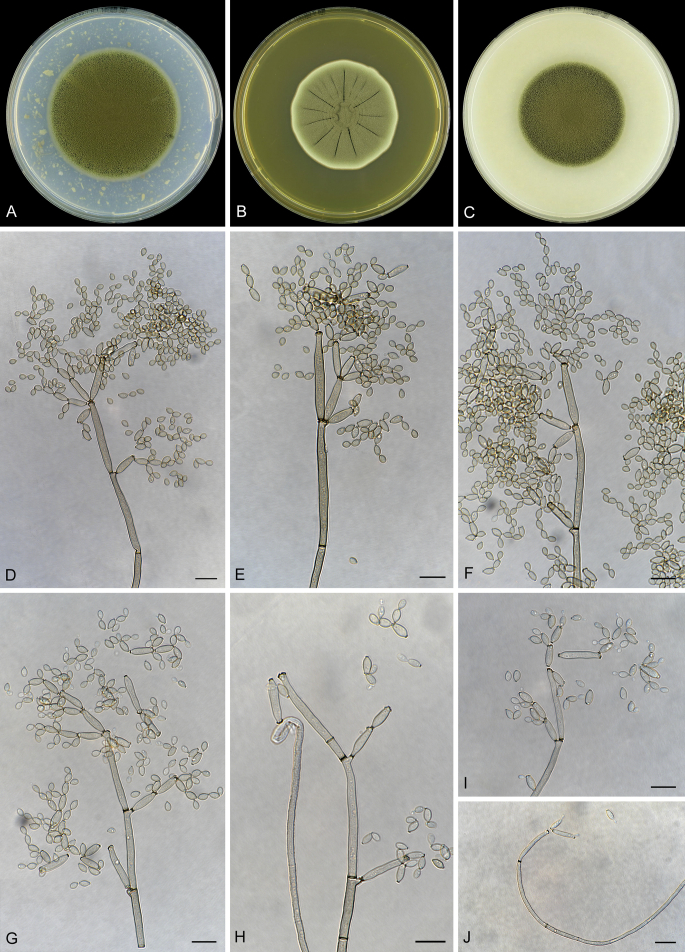
As part of a worldwide survey of the indoor mycobiota about 520 new Cladosporium isolates from indoor environments mainly collected in China, Europe, New Zealand, North America and South Africa were investigated by using a polyphasic approach to determine their species identity. All Cladosporium species occurring in indoor environments are fully described and illustrated. Fourty-six Cladosporium species are treated of which 16 species are introduced as new. A key for the most common Cladosporium species isolated from indoor environments is provided. Cladosporium halotolerans proved to be the most frequently isolated Cladosporium species indoors.

Keywords: 16 new taxa; C. coloradense Bensch & Samson; C. domesticum Bensch & Samson; C. europaeum Bensch & Samson; C. needhamense Bensch & Samson; C. neerlandicum Bensch & Samson; C. neolangeronii Bensch & Samson; C. parahalotolerans Bensch & Samson; C. parasubtilissimum Bensch & Samson; C. pulvericola Bensch & Samson; C. sinense Bensch & Samson; C. sloanii Bensch & Samson; C. uwebraunianum Bensch & Samson; C. vicinum Bensch & Samson; C. westerdijkiae Bensch & Samson; C. wyomingense Bensch & Samson; Cladosporium aerium Bensch & Samson; Indoor molds; New species; Phylogeny; Taxonomy.


Figures

Fig. 1
Fig. 1
The first of 1 000 equally most parsimonious trees obtained from a heuristic search of the C. cladosporioides species complex alignment. Bayesian posterior probabilities (BPP; >0.74), maximum-likelihood bootstrap support values (MLBS; >74 %) and maximum parsimony bootstrap support values (PBS; >74 %)) are shown at the nodes (BPP/MLBS/PBS). Thickened lines with an asterisk (*) represent nodes with PP = 1.00, MLBS = 100 % and PBS = 100 % and a hash (#) represents nodes with PP = >0.94, MLBS = >94 % and PBS = >94 %. The scale bar represents the number of changes. Species names are indicated to the right of the tree and clades/lineages are numbered to facilitate easier reference in the text. Species boundaries are indicated with coloured blocks. Names of novel species and culture numbers with type status are printed in bold face. Species from indoor environments are indicated with a blue star symbol in front of the species name. Isolation source and country of origin information are provided where known. The tree was rooted to Cercospora beticola (strain CBS 116456).
Fig. 1
Fig. 1
The first of 1 000 equally most parsimonious trees obtained from a heuristic search of the C. cladosporioides species complex alignment. Bayesian posterior probabilities (BPP; >0.74), maximum-likelihood bootstrap support values (MLBS; >74 %) and maximum parsimony bootstrap support values (PBS; >74 %)) are shown at the nodes (BPP/MLBS/PBS). Thickened lines with an asterisk (*) represent nodes with PP = 1.00, MLBS = 100 % and PBS = 100 % and a hash (#) represents nodes with PP = >0.94, MLBS = >94 % and PBS = >94 %. The scale bar represents the number of changes. Species names are indicated to the right of the tree and clades/lineages are numbered to facilitate easier reference in the text. Species boundaries are indicated with coloured blocks. Names of novel species and culture numbers with type status are printed in bold face. Species from indoor environments are indicated with a blue star symbol in front of the species name. Isolation source and country of origin information are provided where known. The tree was rooted to Cercospora beticola (strain CBS 116456).
Fig. 2
Fig. 2
Bayesian consensus phylogram (50 % majority rule) of the C. herbarum species complex alignment. Bayesian posterior probabilities (BPP; >0.74), maximum-likelihood bootstrap support values (MLBS; >74 %) and maximum parsimony bootstrap support values (PBS; >74 %)) are shown at the nodes (BPP/MLBS/PBS). Thickened lines with an asterisk (*) represent nodes with PP = 1.00, MLBS = 100 % and PBS = 100 % and a hash (#) represents nodes with PP = >0.94, MLBS = >94 % and PBS = >94 %. The scale bar represents the expected changes per site. Species names are indicated to the right of the tree and clades/lineages are numbered to facilitate easier reference in the text. Species boundaries are indicated with coloured blocks. Names of novel species and culture numbers with type status are printed in bold face. Species from indoor environments are indicated with a blue star symbol in front of the species name. Isolation source and country of origin information are provided where known. The tree was rooted to Cercospora beticola (strain CBS 116456).
Fig. 2
Fig. 2
Bayesian consensus phylogram (50 % majority rule) of the C. herbarum species complex alignment. Bayesian posterior probabilities (BPP; >0.74), maximum-likelihood bootstrap support values (MLBS; >74 %) and maximum parsimony bootstrap support values (PBS; >74 %)) are shown at the nodes (BPP/MLBS/PBS). Thickened lines with an asterisk (*) represent nodes with PP = 1.00, MLBS = 100 % and PBS = 100 % and a hash (#) represents nodes with PP = >0.94, MLBS = >94 % and PBS = >94 %. The scale bar represents the expected changes per site. Species names are indicated to the right of the tree and clades/lineages are numbered to facilitate easier reference in the text. Species boundaries are indicated with coloured blocks. Names of novel species and culture numbers with type status are printed in bold face. Species from indoor environments are indicated with a blue star symbol in front of the species name. Isolation source and country of origin information are provided where known. The tree was rooted to Cercospora beticola (strain CBS 116456).
Fig. 3
Fig. 3
Bayesian consensus phylogram (50 % majority rule) of the C. sphaerospermum species complex alignment. Bayesian posterior probabilities (BPP; >0.74), maximum-likelihood bootstrap support values (MLBS; >74 %) and maximum parsimony bootstrap support values (PBS; >74 %)) are shown at the nodes (BPP/MLBS/PBS). Thickened lines with an asterisk (*) represent nodes with PP = 1.00, MLBS = 100 % and PBS = 100 % and a hash (#) represents nodes with PP = >0.94, MLBS = >94 % and PBS = >94 %. The scale bar represents the expected changes per site. Species names are indicated to the right of the tree and clades/lineages are numbered to facilitate easier reference in the text. Species boundaries are indicated with coloured blocks. Names of novel species and culture numbers with type status are printed in bold face. Species from indoor environments are indicated with a blue star symbol in front of the species name. Isolation source and country of origin information are provided where known. The tree was rooted to Cercospora beticola (strain CBS 116456).
Fig. 3
Fig. 3
Bayesian consensus phylogram (50 % majority rule) of the C. sphaerospermum species complex alignment. Bayesian posterior probabilities (BPP; >0.74), maximum-likelihood bootstrap support values (MLBS; >74 %) and maximum parsimony bootstrap support values (PBS; >74 %)) are shown at the nodes (BPP/MLBS/PBS). Thickened lines with an asterisk (*) represent nodes with PP = 1.00, MLBS = 100 % and PBS = 100 % and a hash (#) represents nodes with PP = >0.94, MLBS = >94 % and PBS = >94 %. The scale bar represents the expected changes per site. Species names are indicated to the right of the tree and clades/lineages are numbered to facilitate easier reference in the text. Species boundaries are indicated with coloured blocks. Names of novel species and culture numbers with type status are printed in bold face. Species from indoor environments are indicated with a blue star symbol in front of the species name. Isolation source and country of origin information are provided where known. The tree was rooted to Cercospora beticola (strain CBS 116456).
Fig. 4
Fig. 4
Cladosporium aerium (CBS 143356). A–C. Colonies on PDA, MEA and OA. D–I. Conidiophores and conidia. J. Microcyclic conidiogenesis with a secondary ramoconidium forming a conidiophore with a conidium attached. K–L. Conidial chains. Scale bars = 10 μm.
Fig. 5
Fig. 5
Cladosporium allicinum (DTO 109-E5). A–C. Colonies on PDA, MEA and OA. D–G. Macronematous conidiophores with conidial chains. H–I. Micronematous conidiophores. J. Conidia. Scale bars = 10 μm.
Fig. 6
Fig. 6
Cladosporium angustisporum (CPC 22345). A–C. Colonies on PDA, MEA and OA. D–H. Conidiophores and conidial chains. I. Ramoconidium and conidia. J–L. Conidial chains. Scale bars = 10 μm.
Fig. 7
Fig. 7
Cladosporium asperulatum (CPC 22364). A–C. Colonies on PDA, MEA and OA. D–H. Conidiophores and conidial chains. I. Ramoconidium with conidial chains. Scale bars = 10 μm.
Fig. 8
Fig. 8
Cladosporium austrohemisphaericum (DTO 305-E8). A–C. Colonies on PDA, MEA and OA. D–I. Unbranched or branched conidiophores with conidial chains. J. Ramoconidium with conidial chains. Scale bars = 10 μm.
Fig. 9
Fig. 9
Cladosporium cladosporioides (CBS 112388, adapted from Bensch et al. 2012). A–C. Colonies on PDA, MEA and OA. D–I. Macronematous conidiophores and conidial chains. Scale bar = 10 μm.
Fig. 10
Fig. 10
Cladosporium coloradense (CBS 143357). A–C. Colonies on PDA, MEA and OA. D–K. Conidiophores and conidial chains. L–M. Ramoconidia and conidial chains. Scale bars = 10 μm.
Fig. 11
Fig. 11
Cladosporium delicatulum (DTO 167-H5). A–C. Colonies on PDA, MEA and OA. D–I. Conidiophores and conidial chains. Scale bars = 10 μm.
Fig. 12
Fig. 12
Cladosporium domesticum (CBS 143358). A–C. Colonies on PDA, MEA and OA. D–H. Macronematous conidiophores with conidial chains. I–J. Micronematous conidiophores with conidial chains. K–L. Conidial chains. Scale bars = 10 μm.
Fig. 13
Fig. 13
Cladosporium domesticum (DTO 305-H2). A, B. Shows rows of rounded cells present at agar level that can form aerial hyphae and/or conidiophores. C–H. Details of conidia next to aerial or substrate fungal structures. Note the less distinct ornamentation of the C. sphaerospermum type containing out of ridges and warts. Scars on conidia (D, H) and ramoconidia (with differences in size, G) are visible. Note the very long “neck” area between conidia in D, F–H. Scale bars = 2 (C, E–H), 5 (D), 10 (A, B) μm.
Fig. 14
Fig. 14
Cladosporium dominicanum (CPC 22244). A–C. Colonies on PDA, MEA and OA. D–I. Conidiophores with conidial chains. J–K. Conidial chains. Scale bars = 10 μm.
Fig. 15
Fig. 15
Cladosporium floccosum (CPC 22399). A–C. Colonies on PDA, MEA and OA. D–I. Conidiophores and conidia. J. Ramoconidium. K–L. Microcyclic conidiogenesis with conidia forming secondary conidiophores. M. Conidia. Scale bars = 10 μm.
Fig. 16
Fig. 16
Cladosporium funiculosum (DTO 127-E7). A–C. Colonies on PDA, MEA and OA. D–H. Conidiophores and conidia. I–J. Long conidial chains. Scale bars = 10 μm.
Fig. 17
Fig. 17
Cladosporium globisporum (CPC 19124). A–C. Colonies on PDA, MEA and OA. D–H. Conidiophores and conidial chains. I–J. Micronematous conidiophores. K. Conidial chain. Scale bars = 10 μm.
Fig. 18
Fig. 18
Cladosporium halotolerans (DTO 161-D3). A–F. Conidiophores and conidial chains. G–I. Conidial chains. Scale bars = 10 μm.
Fig. 19
Fig. 19
Cladosporium inversicolor (CPC 22300). A–C. Colonies on PDA, MEA and OA. D–H. Conidiophores and conidial chains. J. Ramoconidium and conidia. K–L. Conidia. Scale bars = 10 μm.
Fig. 20
Fig. 20
Cladosporium langeronii (DTO 124-D5). A–C. Colonies on PDA, MEA and OA. D–F. Conidiophores and conidia. G. Superficial mycelium. H. Ramoconidium and conidial chains. I–J. Conidial chains. Scale bars = 10 μm.
Fig. 21
Fig. 21
Cladosporium langeronii (DTO 124-D5). A. Survey of colony structure of conidia on conidiophores. B. Young conidiophores formed on series of rounded cells, in one case with a transverse septum. C. As B, Here the distinct ornamentation of conidia is visible. D. Conidial chains, showing markedly less ornamentation at the apical end of the ramoconidia. E. Young conidiophore, with conidial chain, showing smooth apical zones and smooth necks between spores. F. Conidial chains showing the more distinct ornamentation in terminal conidia. Ornamentation exists out of distinct ridges that are more or less parallel. G–J. Details of conidial ornamentation with smooth apical zones and necks except in terminal conidia. Figure J shows a conidium initial. Scale bars = 2 (I, J), 5 (E–H), 10 (B–D), 20 (A) μm.
Fig. 22
Fig. 22
Cladosporium limoniforme (CPC 22395). A–C. Colonies on PDA, MEA and OA. D–K. Conidiophores and conidial chains. L–M. Conidia. Scale bars = 10 μm.
Fig. 23
Fig. 23
Cladosporium needhamense (CBS 143359). A–C. Colonies on PDA, MEA and OA. D–G. Macronematous conidiophores and conidia. H, J. Micronematous conidiophores and conidia. I. Ramoconidium and conidial chains. K. Conidial chains. Scale bars = 10 μm.
Fig. 24
Fig. 24
Cladosporium neerlandicum (CBS 143360). A–C. Colonies on PDA, MEA and OA. D–I. Conidiophores and conidia. J. Conidial chains. Scale bars = 10 μm.
Fig. 25
Fig. 25
Cladosporium neolangeronii (CBS 797.97). A–C. Colonies on PDA, MEA and OA. D–H. Macronematous conidiophores and conidia. I, K. Micronematous conidiophores and conidia. J. Ramoconidium and conidia. Scale bars = 10 μm.
Fig. 26
Fig. 26
Cladosporium parahalotolerans (CBS 139585). A–C. Colonies on PDA, MEA and OA. D–I. Conidiophores and conidial chains. J–K. Ramoconidium and conidial chains. L–M. Micronematous conidiophores and conidia. Scale bars = 10 μm.
Fig. 27
Fig. 27
Cladosporium parasubtilissimum (CBS 143361). A–C. Colonies on PDA, MEA and OA. D–L. Macro- and micronematous conidiophores and conidial chains. Scale bars = 10 μm.
Fig. 28
Fig. 28
Cladosporium perangustum (DTO 127-E1). A–C. Colonies on PDA, MEA and OA. D–H. Macronematous conidiophores and conidial chains. I–J. Micronematous conidiophores and conidia. Scale bars = 10 μm.
Fig. 29
Fig. 29
Cladosporium pseudocladosporioides (DTO 151-A4). A–C. Colonies on PDA, MEA and OA. D–J. Conidiophores and conidial chains. Scale bars = 10 μm.
Fig. 30
Fig. 30
Cladosporium psychrotolerans (DTO 307-H2). A–C. Colonies on PDA, MEA and OA. D–H. Conidiophores and conidia. I. Micronematous conidiophores. J–L. Ramoconidia and conidia. M. Conidia. Scale bars = 10 μm.
Fig. 31
Fig. 31
Cladosporium pulvericola (CBS 143362). A–C. Colonies on PDA, MEA and OA. D–F, J. Macronematous conidiophores and conidial chains. G–I, L–N. Micronematous conidiophores and conidial chains. K. Conidia. Scale bars = 10 μm.
Fig. 32
Fig. 32
Cladosporium ramotenellum (DTO 097-H3). A–C. Colonies on PDA, MEA and OA. D–H. Macronematous conidiophores and conidial chains. I. Micronematous conidiophores. J–K. Conidial chains. Scale bars = 10 μm.
Fig. 33
Fig. 33
Cladosporium sinense (CBS 143363). A–C. Colonies on PDA, MEA and OA. D–G, J. Conidiophores and conidia. H. Surface ornamentation of conidiophores and conidia shown in an air bubble. I, K–L. Conidial chains. Scale bars = 10 μm.
Fig. 34
Fig. 34
Cladosporium sinense (CBS 143363). A. Overview of bundles of aerial hyphae, conidiophores and conidia. B. Bundles of hyphae also end as conidiophores. The conspicuous ornamentation of the C. herbarum type is already visible at the ends of the conidiophores. C. Detail of A. showing a smooth conidiophore stipe with short branch, ramoconidia, terminal conidia and conidium initial. D. Detail of B showing the transition of a branch of an aerial hyphae (see B) into a ramoconidium. Note the scars on the ramoconidium and the round terminal ornamented conidia. E. Nearly intact top end of a conidiophore containing ramoconidium and most derived structures. F. Details of conidia and scars. Note the distinct ornamentation of conidia consisting out of single regular extensions. G–J. Details of conidiophores and conidia. The different sizes of the scars on conidiophore stipes are well visible (G and I). These flattened scars are different from the scars on conidia that exhibit a core surrounded by a rim structure. Scale bars = 2 (F–G, I–J), 5 (C–E, H), 10 (A, B) μm.
Fig. 35
Fig. 35
Cladosporium sinuosum (DTO 109-I2). A–C. Colonies on PDA, MEA and OA. D–G. Conidiophores and conidia. H. Superficial mycelium. I. Ramoconidium and conidia. J. Conidia. Scale bars = 10 μm.
Fig. 36
Fig. 36
Cladosporium sloanii (CBS 143364). A–C. Colonies on DG18 and MA + 20 % sucrose. C–G, I. Conidiophores and conidia. H, J–L. Ramoconidia and conidia. M. Conidial chains. Scale bars = 10 μm.
Fig. 37
Fig. 37
Cladosporium sphaerospermum (DTO 160-I2). A–C. Colonies on PDA, MEA and OA. D–H. Conidiophores and conidial chains. I–J. Conidial chains. Scale bars = 10 μm.
Fig. 38
Fig. 38
Cladosporium sphaerospermum (DTO 160-I2). A. Conidiophores, ramoconidia and terminal conidia showing characteristic ornamentation. B. Scars on ramoconidia and conidial chains. Note the smooth apical zones on the spores. C. Conidial chains and scars. Note that terminal conidia do not have smooth regions. D. Conidiophore with primary and secondary ramoconidia and conidial chains. Note the smooth cell wall of conidiophore stipe and primary ramoconidium. E. Ramoconidia and chains. F. Branching points on ramoconidium with smooth apical zones and scars. G–J. Details of ramoconidia, intercalary conidia and terminal conidia. Note the ornamentation consisting out of ridges, which are often twisted (see I, J); the smooth cells wall next to the scars (H) and between conidia (G). Scale bars = 2 (G–J), 5 (A–F) μm.
Fig. 39
Fig. 39
Cladosporium subinflatum (CPC 22303). A–C. Colonies on PDA, MEA and OA. D–G. Conidiophores and conidial chains. H–I. Micronematous conidiophores. J. Conidial chains with conidia showing the densely verruculose to echinulate surface ornamentation. Scale bars = 10 μm.
Fig. 40
Fig. 40
Cladosporium subuliforme (DTO 324-C7). A–C. Colonies on PDA, MEA and OA. D–H. Macronematous conidiophores and conidial chains. I, K. Micronematous conidiophores. J. Ramoconidium seceded at a conidiophore. L. Conidial chains. Scale bars = 10 μm.
Fig. 41
Fig. 41
Cladosporium tenellum (CPC 22290). A–C. Colonies on PDA, MEA and OA. D–H. Conidiophores and conidial chains. I–J. Micronematous conidiophores. K. Ramoconidium and conidia. Scale bars = 10 μm.
Fig. 42
Fig. 42
Cladosporium tenuissimum (DTO 323-G3). A–C. Colonies on PDA, MEA and OA. D–H. Macronematous conidiophores and conidial chains. I–J. Micronematous conidiophores and conidia. Scale bars = 10 μm.
Fig. 43
Fig. 43
Cladosporium uwebraunianum (CBS 143365). A–C. Colonies on PDA, MEA and OA. D–H, J. Conidiophores and conidial chains. I. Ramoconidium and conidial chains. K. Conidial chains. Scale bars = 10 μm.
Fig. 44
Fig. 44
Cladosporium uwebraunianum (CBS 143365). A. Survey of conidiophores sprouting from a common base, consisting out of a tissue of broadened connected cells, partially located under the agar surface. B. Free-standing conidiophore with intact stipes, ramoconidia, intercalary and terminal conidia. C. Conidia on conidiophore. Conidia are very smooth; some bear a subtle net-like ornamentation (typical for the C. cladosporioides complex). Some initials are visible; other chains are broken as judged by the scars on the conidia. D. Two intact conidiophores bearing numerous spores. This micrograph shows the compactness of the spore mass and also illustrates that conidial chains support each other throughout formation. E. Conidia on conidiophore showing some initials. F. Chains of conidia, two of the ending in terminally conidia. Scars are visible on a secondary ramoconidium. G. Details of the conidiophore. Note the very smooth surface of the conidia and conidiophore. Fine breaks delineate several spores. H, J, K. Details of scars of intercalary and also terminal conidia (H, J) and initial (J). I. Details of scars on a conidiophore. Note the difference in size of the scars, compare with the lines in Figure G. Scale bars = 2 (H–K), 5 (F, G), 10 (B–E), 50 (A) μm.
Fig. 45
Fig. 45
Cladosporium velox (DTO 317-H1). A–C. Colonies on PDA, MEA and OA. D–H. Macronematous conidiophores and conidial chains. I–J. Micronematous conidiophores and conidia. Scale bars = 10 μm.
Fig. 46
Fig. 46
Cladosporium wyomingense (CBS 143367). A–C. Colonies on PDA, MEA and OA. D–F, H–J. Macronematous conidiophores and conidial chains. G, K–L. Micronematous conidiophores and conidia. M. Ramoconidium and conidia. N–O. Conidial chains. Scale bars = 10 μm.

References

    1. Bensch K., Braun U., Groenewald J.Z. The genus Cladosporium. Studies in Mycology. 2012;72:1–401. - PMC - PubMed
    1. Bensch K., Groenewald J.Z., Braun U. Common but different: The expanding realm of Cladosporium. Studies in Mycology. 2015;82:23–74. - PMC - PubMed
    1. Bensch K., Groenewald J.Z., Dijksterhuis J. Species and ecological diversity within the Cladosporium cladosporioides complex (Davidiellaceae, Capnodiales) Studies in Mycology. 2010;67:1–94. - PMC - PubMed
    1. Bezerra J.D.P., Sandoval-Denis M., Paiva L.M. New endophytic Toxicocladosporium species from cacti in Brazil, and description of Neocladosporium gen. nov. IMA Fungus. 2017;8(1):77–97. - PMC - PubMed
    1. Braun U., Crous P.W., Dugan F.M. Phylogeny and taxonomy of cladosporium-like hyphomycetes, including Davidiella gen. nov., the teleomorph of Cladosporium s.str. Mycological Progress. 2003;2(1):3–18.