

The response to neoadjuvant chemoradiotherapy with 5-fluorouracil in locally advanced rectal cancer patients: a predictive proteomic signature
- PMID: 29681787
- PMCID: PMC5898006
- DOI: 10.1186/s12014-018-9192-2
The response to neoadjuvant chemoradiotherapy with 5-fluorouracil in locally advanced rectal cancer patients: a predictive proteomic signature
Abstract
Background: Colorectal cancer is the third most common and the fourth most lethal cancer in the world. In the majority of cases, patients are diagnosed at an advanced stage or even metastatic, thus explaining the high mortality. The standard treatment for patients with locally advanced non-metastatic rectal cancer is neoadjuvant radio-chemotherapy (NRCT) with 5-fluorouracil (5-FU) followed by surgery, but the resistance rate to this treatment remains high with approximately 30% of non-responders. The lack of evidence available in clinical practice to predict NRCT resistance to 5-FU and to guide clinical practice therefore encourages the search for biomarkers of this resistance.
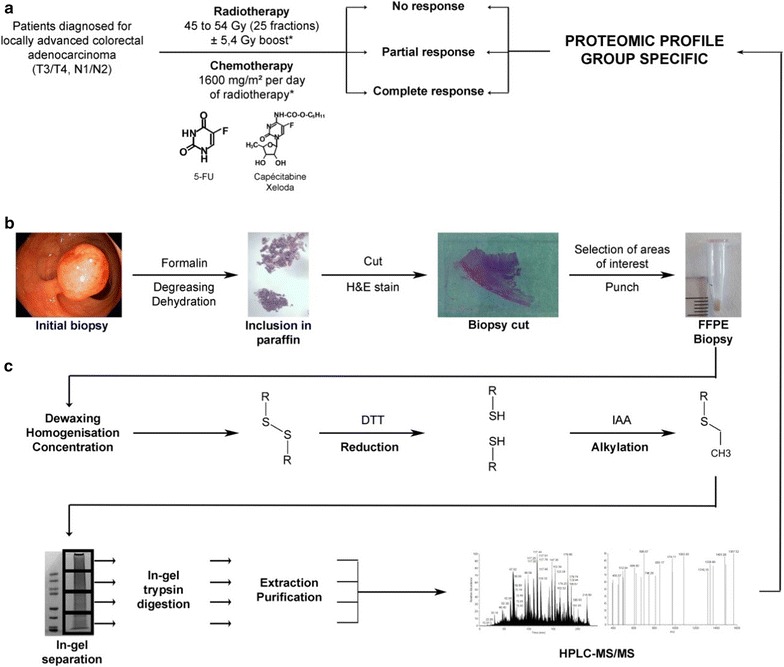
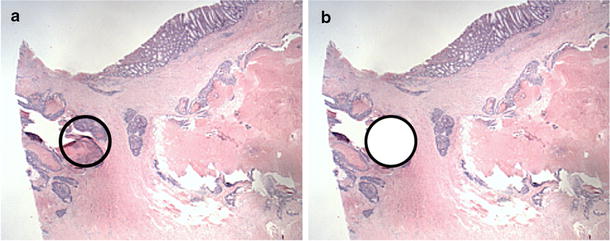
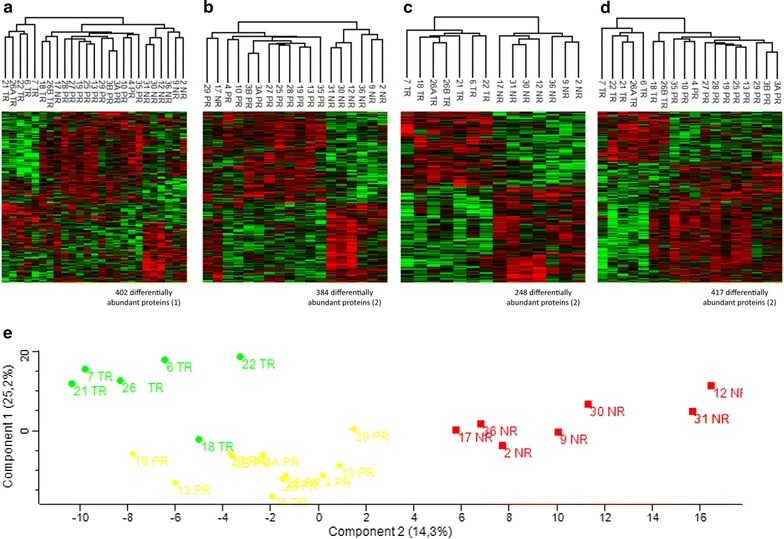
Methods: From twenty-three formalin-fixed paraffin-embedded (FFPE) biopsies performed before NRCT with 5-FU of locally advanced non-metastatic rectal cancer patients, we extracted and analysed the tumor proteome of these patients. From clinical data, we were able to classify the twenty-three patients in our cohort into three treatment response groups: non-responders (NR), partial responders (PR) and total responders (TR), and to compare the proteomes of these different groups.
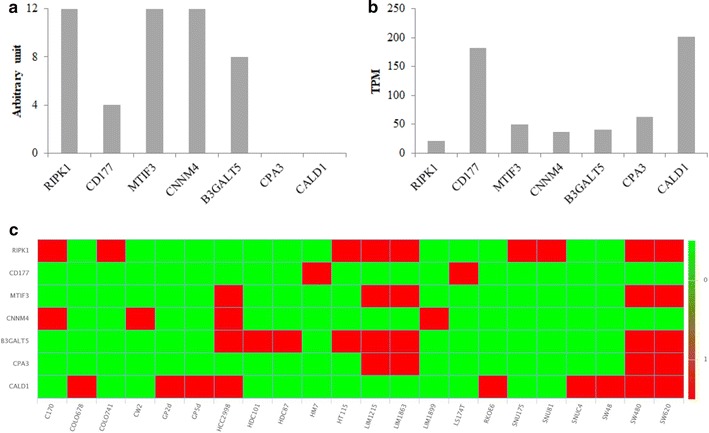
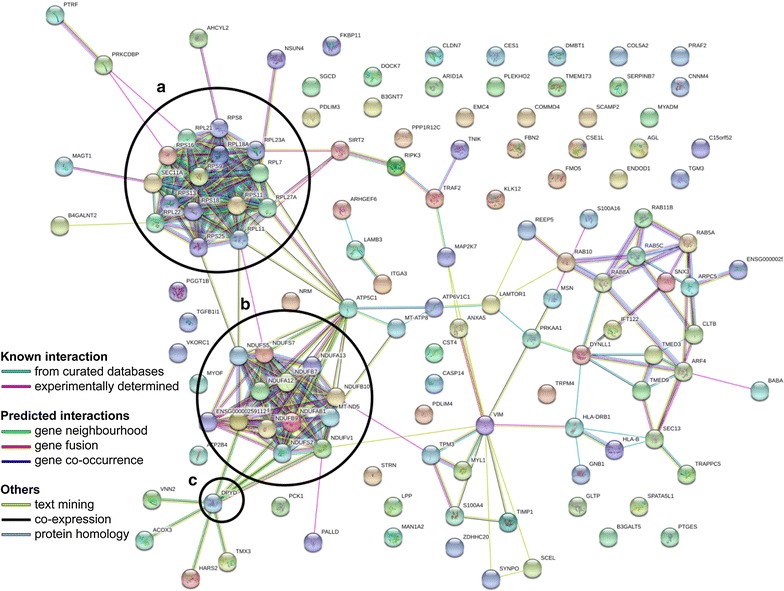
Results: We have highlighted 384 differentially abundant proteins between NR and PR, 248 between NR and TR and 417 between PR and TR. Among these proteins, we have identified many differentially abundant proteins identified as having a role in cancer (IFIT1, FASTKD2, PIP4K2B, ARID1B, SLC25A33: overexpressed in TR; CALD1, CPA3, B3GALT5, CD177, RIPK1: overexpressed in NR). We have also identified that DPYD, the main degradation enzyme of 5-FU, was overexpressed in NR, as well as several ribosomal and mitochondrial proteins also overexpressed in NR. Data are available via ProteomeXchange with identifier PXD008440.
Conclusions: From these retrospective study, we implemented a protein extraction protocol from FFPE biopsy to highlight protein differences between different response groups to RCTN with 5-FU in patients with locally advanced non-metastatic rectal cancer. These results will pave the way for a larger cohort for better sensitivity and specificity of the signature to guide decisions in the choice of treatment.
Keywords: 5-Fluorouracil; Mass spectrometry; Predictive biomarkers; Proteomics; Rectal cancer; Resistance to neoadjuvant radio-chemotherapy.
Figures
Similar articles
-
Identification of proteomic markers for prediction of the response to 5-Fluorouracil based neoadjuvant chemoradiotherapy in locally advanced rectal cancer patients.Cancer Cell Int. 2022 Mar 15;22(1):117. doi: 10.1186/s12935-022-02530-0. Cancer Cell Int. 2022. PMID: 35292026 Free PMC article.
-
microRNAs combined to radiomic features as a predictor of complete clinical response after neoadjuvant radio-chemotherapy for locally advanced rectal cancer: a preliminary study.Surg Endosc. 2023 May;37(5):3676-3683. doi: 10.1007/s00464-022-09851-1. Epub 2023 Jan 13. Surg Endosc. 2023. PMID: 36639577
-
Pilot proteomic study of locally advanced rectal cancer before and after neoadjuvant chemoradiotherapy indicates high metabolic activity in non-responders' tumor tissue.Proteomics Clin Appl. 2023 Jan;17(1):e2100116. doi: 10.1002/prca.202100116. Epub 2022 Sep 7. Proteomics Clin Appl. 2023. PMID: 35997210
-
MicroRNA expression profile associated with response to neoadjuvant chemoradiotherapy in locally advanced rectal cancer patients.Radiat Oncol. 2012 Nov 20;7:195. doi: 10.1186/1748-717X-7-195. Radiat Oncol. 2012. PMID: 23167930 Free PMC article.
-
[Application value of texture analysis of magnetic resonance images in prediction of neoadjuvant chemoradiotherapy efficacy for rectal cancer].Zhonghua Wei Chang Wai Ke Za Zhi. 2018 Sep 25;21(9):1051-1058. Zhonghua Wei Chang Wai Ke Za Zhi. 2018. PMID: 30269327 Chinese.
Cited by
-
Data-Independent Acquisition Mass Spectrometry Analysis of FFPE Rectal Cancer Samples Offers In-Depth Proteomics Characterization of the Response to Neoadjuvant Chemoradiotherapy.Int J Mol Sci. 2023 Oct 21;24(20):15412. doi: 10.3390/ijms242015412. Int J Mol Sci. 2023. PMID: 37895091 Free PMC article.
-
Carboxypeptidase A3 expression in canine mast cell tumors and tissue-resident mast cells.Vet Pathol. 2022 Mar;59(2):236-243. doi: 10.1177/03009858211062636. Epub 2021 Dec 12. Vet Pathol. 2022. PMID: 34894899 Free PMC article.
-
Predicting response to neoadjuvant chemoradiotherapy in rectal cancer: from biomarkers to tumor models.Ther Adv Med Oncol. 2022 Feb 21;14:17588359221077972. doi: 10.1177/17588359221077972. eCollection 2022. Ther Adv Med Oncol. 2022. PMID: 35222695 Free PMC article. Review.
-
Downregulation of KRAB zinc finger proteins in 5-fluorouracil resistant colorectal cancer cells.BMC Cancer. 2022 Apr 4;22(1):363. doi: 10.1186/s12885-022-09417-3. BMC Cancer. 2022. PMID: 35379199 Free PMC article.
-
Conserved RNA Binding Activity of Phosphatidyl Inositol 5-Phosphate 4-Kinase (PIP4K2A).Front Mol Biosci. 2021 May 28;8:631281. doi: 10.3389/fmolb.2021.631281. eCollection 2021. Front Mol Biosci. 2021. PMID: 34124142 Free PMC article.
References
-
- International Agency for Research on Cancer—World Health Organization. GLOBOCAN 2012: estimated cancer incidence, mortality and prevalence worldwide in 2012. http://globocan.iarc.fr.
-
- Cellini F, Valentini V. Current perspectives on preoperative integrated treatments for locally advanced rectal cancer: a review of agreement and controversies. Oncology. 2012;26:730–735. - PubMed
-
- Sauer R, Liersch T, Merkel S, Fietkau R, Hohenberger W, Hess C, et al. Preoperative versus postoperative chemoradiotherapy for locally advanced rectal cancer: Results of the German CAO/ARO/AIO-94 randomized phase III trial after a median follow-up of 11 years. J Clin Oncol. 2012;30:1926–1933. doi: 10.1200/JCO.2011.40.1836. - DOI - PubMed
LinkOut - more resources
Full Text Sources
Other Literature Sources
Molecular Biology Databases
Research Materials
Miscellaneous