. 2018 Apr 6:9:458.
doi: 10.3389/fpls.2018.00458. eCollection 2018.

Dehydration Stress Contributes to the Enhancement of Plant Defense Response and Mite Performance on Barley

Affiliations

Dehydration Stress Contributes to the Enhancement of Plant Defense Response and Mite Performance on Barley

M E Santamaria et al. Front Plant Sci. .

Abstract

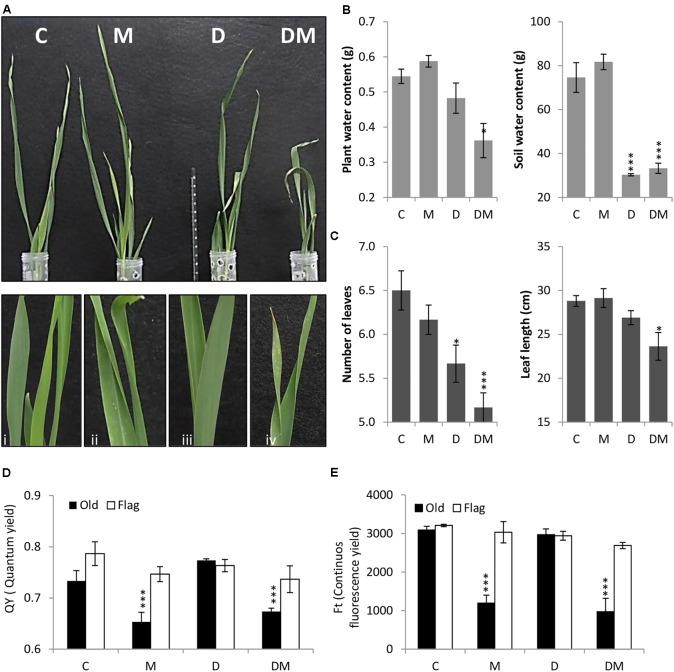
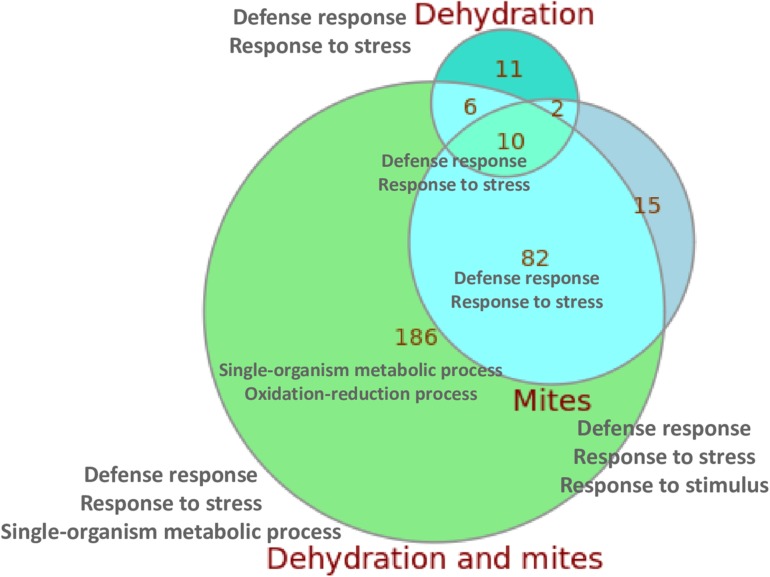
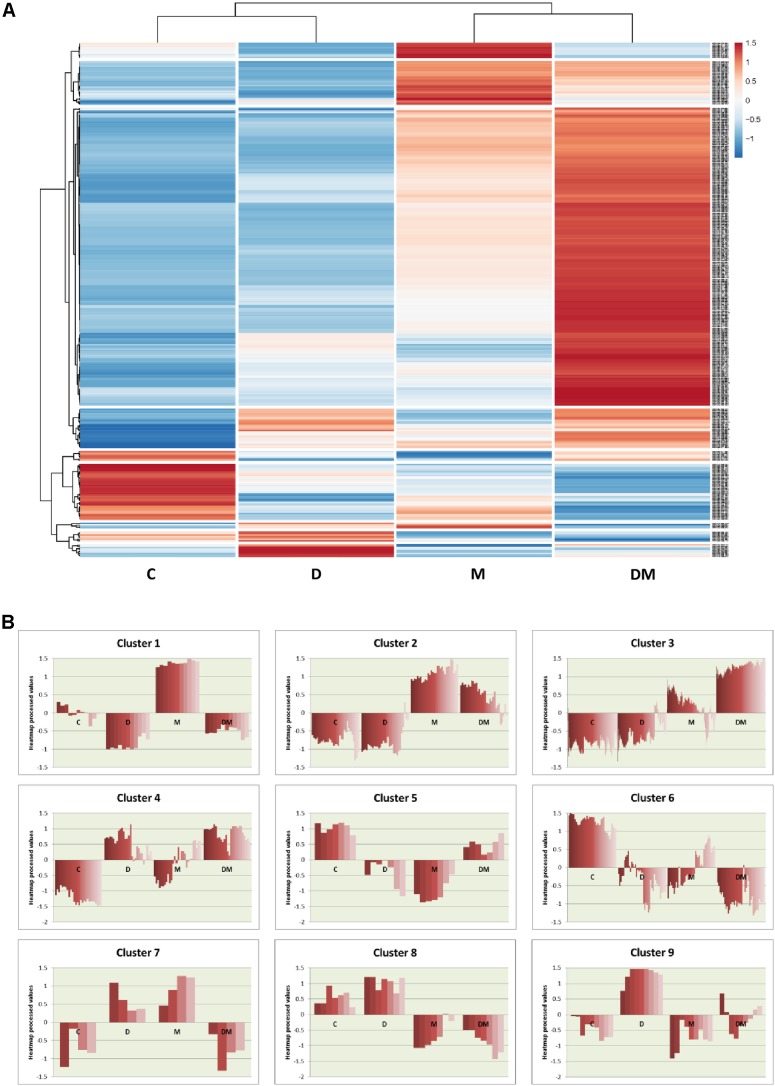
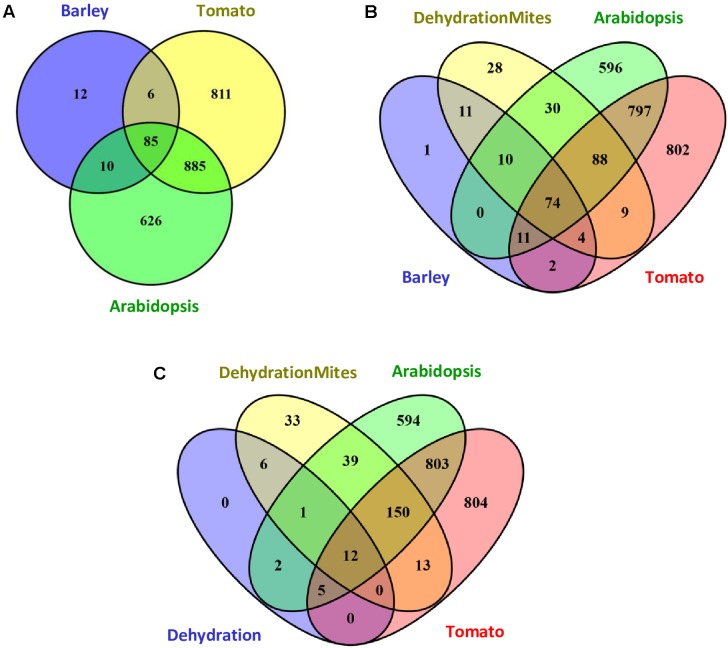
Under natural conditions, plants suffer different stresses simultaneously or in a sequential way. At present, the combined effect of biotic and abiotic stressors is one of the most important threats to crop production. Understanding how plants deal with the panoply of potential stresses affecting them is crucial to develop biotechnological tools to protect plants. As well as for drought stress, the economic importance of the spider mite on agriculture is expected to increase due to climate change. Barley is a host of the polyphagous spider mite Tetranychus urticae and drought produces important yield losses. To obtain insights on the combined effect of drought and mite stresses on the defensive response of this cereal, we have analyzed the transcriptomic responses of barley plants subjected to dehydration (water-deficit) treatment, spider mite attack, or to the combined dehydration-spider mite stress. The expression patterns of mite-induced responsive genes included many jasmonic acid responsive genes and were quickly induced. In contrast, genes related to dehydration tolerance were later up-regulated. Besides, a higher up-regulation of mite-induced defenses was showed by the combined dehydration and mite treatment than by the individual mite stress. On the other hand, the performance of the mite in dehydration stressed and well-watered plants was tested. Despite the stronger defensive response in plants that suffer dehydration and mite stresses, the spider mite demonstrates a better performance under dehydration condition than in well-watered plants. These results highlight the complexity of the regulatory events leading to the response to a combination of stresses and emphasize the difficulties to predict their consequences on crop production.

Keywords: Hordeum vulgare; Tetranychus urticae; dehydration stress; differential gene expression; plant-biotic-abiotic interaction.


Figures

FIGURE 1
FIGURE 1
Phenotypical, physiological and biochemical parameters of barley plants 7 days post treatment. (A) Phenotype of barley plants 7 days post spider mite infestation (M), dehydration (D), spider mite infestation + dehydration (DM) or control conditions (C) after taking out plastic cylinders to avoid mite dispersion. Plant details are showed in i, ii, iii, and iv. (B) Plant/Soil water content (g). (C) Number of leaves and leaf length (cm). (D) Quantum yield of the photosystem II (QY). (E) Continuous fluorescence yield (FT). Data represent the mean ± SE of n = 3 replicates. Asterisks indicate significant differences among control plants and each treatment determined by a One-way ANOVA test (P < 0.05, Dunnett’s post hoc test).
FIGURE 2
FIGURE 2
Euler diagram showing the number of specific and shared DEGs detected after the different treatments. The main enriched GO categories for each group/subgroup are indicated.
FIGURE 3
FIGURE 3
Hierarchical clustering of differentially expressed genes among the different treatments. (A) Heatmap showing normalized color intensity from the expression values of the 350 DEGs. (B) Main clusters identified from hierarchical gene tree cluster analysis showing heatmap expression processed values for every gene after the different treatments. C, control; D, dehydration; M, mites; DM, dehydration and mites.
FIGURE 4
FIGURE 4
Venn diagrams showing the number of specific and shared Interpro identifiers. (A) Interpro identifiers from DEGs after mites treatment in Arabidopsis, tomato and barley. (B) Interpro identifiers from DEGs after mites treatment in Arabidopsis, tomato and barley, including the overlap with the dehydration and mites treatment in barley. (C) Interpro identifiers from DEGs after dehydration and dehydration and mites treatments in barley including the overlap with the mites treatment in Arabidopsis and tomato.
FIGURE 5
FIGURE 5
Messenger expression levels of selected differentially expressed barley genes after 4, 7, 10, and 13 days of stress treatment assayed by RT-qPCR. Total RNA was extracted from leaves after dehydration treatment (green), mites treatment (red), dehydration and mites treatment (purple) and non-treated leaves (blue). Data were expressed as relative mRNA levels normalized to barley cyclophilin mRNA content. Genes from the same cluster identified in the hierarchical analysis have the same background color.
FIGURE 6
FIGURE 6
Effect of barley dehydration on T. urticae performance. (A) Quantification of T. urticae Ribosomal Protein 49 (TuRP49) mRNA expression. (B) TuVTG (Vitellogenin) mRNA expression normalized to the spider mite population (TuRP49). (C) TuATG13 (Autophagy related protein) mRNA expression normalized to the spider mite population (TuRP49). Expression levels were quantified 4, 7, 10, and 13 days post infestation under control or dehydration stress conditions. Different letters indicate significant differences determined by a One-way ANOVA test (P < 0.05, Student Newman–Keuls post hoc test).
FIGURE 7
FIGURE 7
Schematic model summarizing the main effects of dehydration and spider mite treatments. Ovals include information on the variations found in plant phenotype features and gene expression. Up arrows, down arrows and equal signs mean positive effect, negative effect or no-effect, respectively. Line drawings show the predicted time course of the expression of defense and drought-related genes, and the performance of the mite throughout the different treatments.

Similar articles

Cited by

References

    1. Agut B., Gamir J., Jaques J. A., Flors V. (2015). Tetranychus urticae-triggered responses promote genotype-dependent conspecific repellence or attractiveness in citrus. New Phytol. 207 790–804. 10.1111/nph.13357 - DOI - PubMed
    1. Ament K., Kant M. R., Sabelis M. W., Haring M. A., Schuurink R. C. (2004). Jasmonic acid is a key regulator of spider mite-induced volatile terpenoid and methyl salicylate emission in tomato. Plant Physiol. 135 2025–2037. 10.1104/pp.104.048694 - DOI - PMC - PubMed
    1. Atkinson N. J., Lilley C. J., Urwin P. E. (2013). Identification of genes involved in the response of Arabidopsis to simultaneous biotic and abiotic stresses. Plant Physiol. 162 2028–2041. 10.1104/pp.113.222372 - DOI - PMC - PubMed
    1. Atkinson N. J., Urwin P. E. (2012). The interaction of plant biotic and abiotic stresses: from genes to the field. J. Exp. Bot. 63 3523–3543. 10.1093/jxb/ers100 - DOI - PubMed
    1. Barnabás B., Jäger K., Fehér A. (2008). The effect of drought and heat stress on reproductive processes in cereals. Plant Cell Environ. 31 11–38. 10.1111/j.1365-3040.2007.01727.x - DOI - PubMed