. 2018 Mar 30;9(24):17066-17077.
doi: 10.18632/oncotarget.24899.

Ferric citrate and ferric EDTA but not ferrous sulfate drive amphiregulin-mediated activation of the MAP kinase ERK in gut epithelial cancer cells

Affiliations

Ferric citrate and ferric EDTA but not ferrous sulfate drive amphiregulin-mediated activation of the MAP kinase ERK in gut epithelial cancer cells

Nathalie M Scheers et al. Oncotarget. .

Abstract

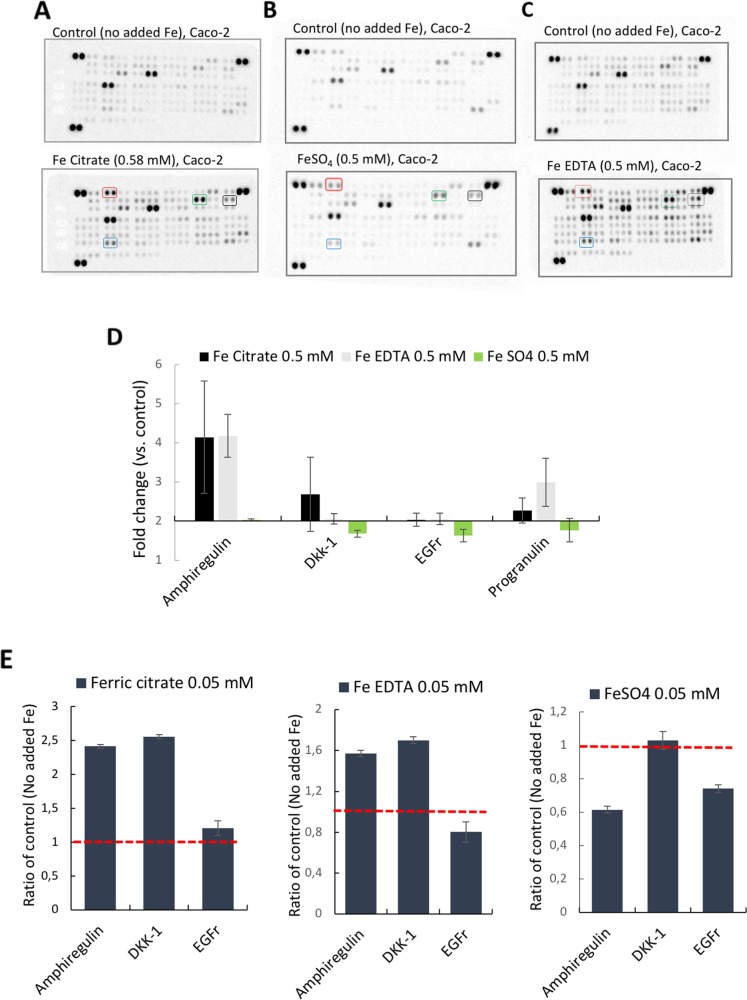
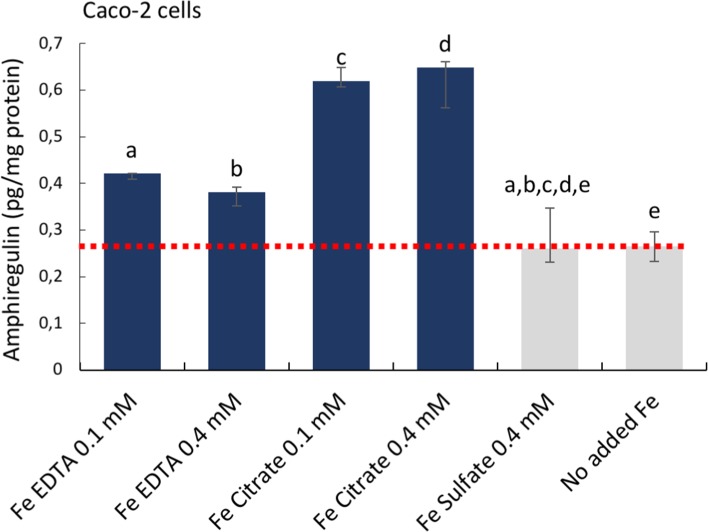
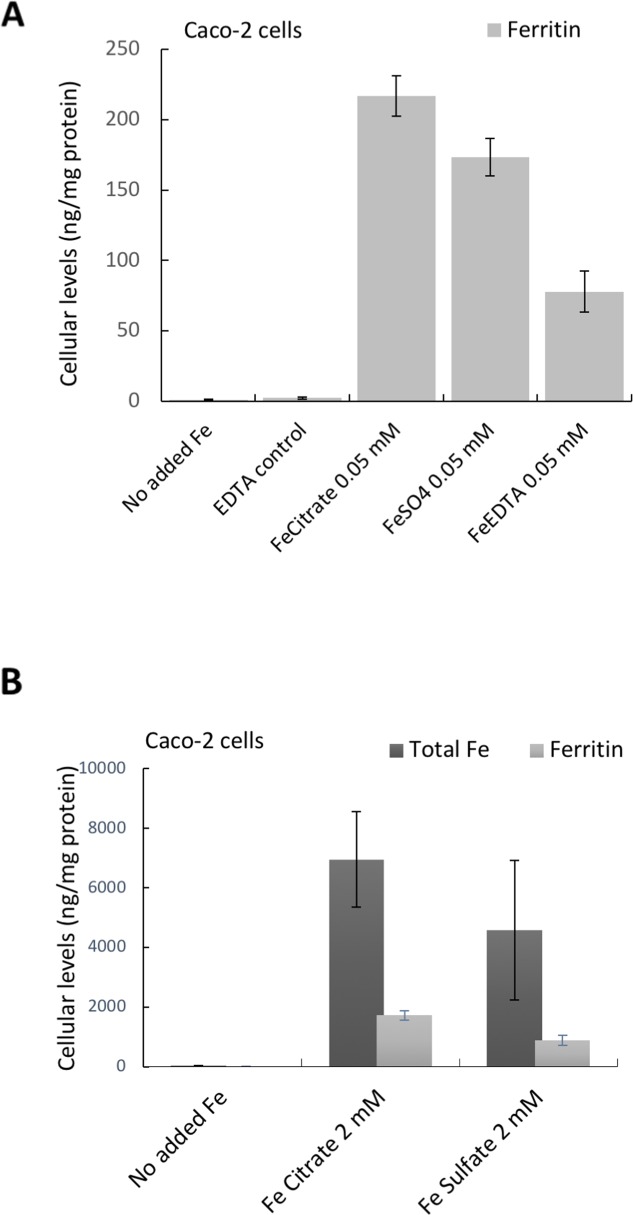
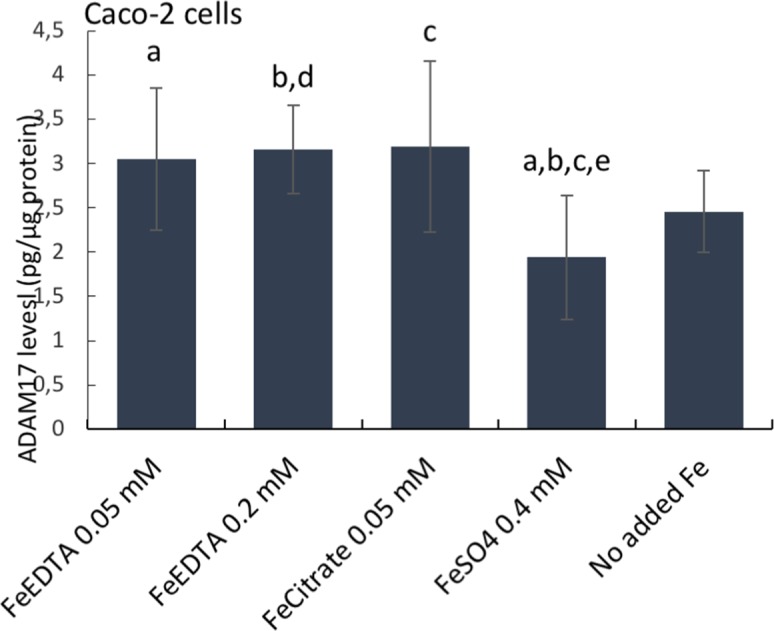
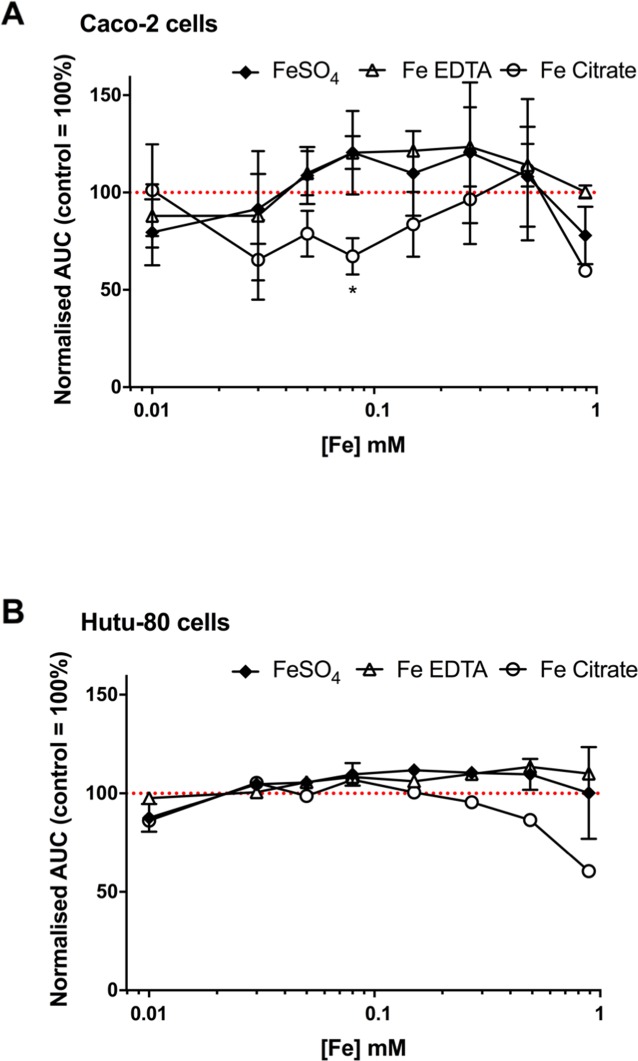
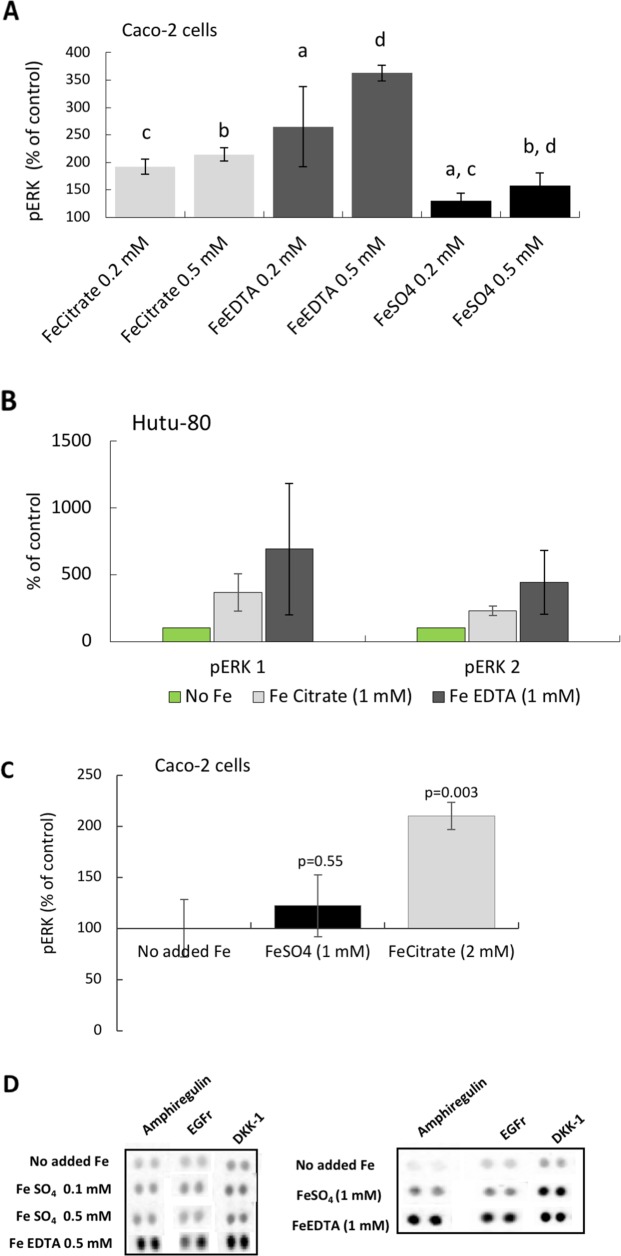
Ferric chelates may be used as oral iron supplements or phosphate binders but both ferric citrate and ferric EDTA have been shown to promote tumor burden in murine models of colon cancer. Here we studied their effects on cancer cell growth, at typical supplemental iron levels encountered in the gastrointestinal tract (0.01-0.2 mM). Caco-2 and/or Hutu-80 cells were exposed to these forms of chelated iron or to ferrous sulfate and outcomes were assessed using cell proliferation assays, proteome profiler arrays, western blot, and ELISA. Ferric EDTA and ferric citrate increased cellular levels of the onco-protein amphiregulin and its receptor (EGFr) which in turn stimulated the activation of the MAP kinase ERK. Simultaneously, the expression of the negative Wnt regulator, DKK-1, increased suggesting that cell proliferation through the Wnt pathway may be less pronounced in the presence of ferric EDTA and ferric citrate, unlike for ferrous sulfate. Moreover, ferrous sulfate did not increase levels of cellular amphiregulin or EGFr. We conclude that specific iron compounds affect cell signaling differently and some may increase the risk of colon cancer advancement in an amphiregulin-dependent fashion. Further scrutiny of safe oral iron use is merited.

Keywords: amphiregulin; ferric EDTA; ferric citrate; iron; pERK.


Conflict of interest statement

CONFLICTS OF INTEREST DIAP, NF, and JJP are inventors of MRC-owned technologies for iron supplementation or phosphate binding other than those described herein and for which they have financially benefitted via consultancy and MRC Awards to Inventor Scheme. The authors could also receive future awards to inventors for these technologies. Notwithstanding, the authors declare no conflict of interest.

Figures

Figure 1
Figure 1. Proteome profiler™ arrays on human epithelial colorectal adenocarcinoma Caco-2 cells incubated with different iron compounds
The cells were incubated with (A) Ferric citrate (0.5 mM), (B) Ferrous sulfate (0.5 mM), (C) Ferric EDTA (0.5 mM). Red box= Amphiregulin, Black box = EGFr, Green box= DKK-1, Blue box= Progranulin. (D) Quantative data based on the arrays (n=3). Fold changes ≥2 and signal ≥10% of the internal controls were considered as significant. (E) Bar graphs of array data for Amphiregulin (AREG), DKK-1, and EGFr at 0.05 mM, presented as ratio of control (Fold change) ± SD (n=2).
Figure 2
Figure 2. Cellular amphiregulin levels in human epithelial colorectal adenocarcinoma Caco-2 cells incubated with iron compounds
Quantative data measured with Thermo Scientific™ hAREG ELISA kit. Data are presented as means, n=3 ± SD. The significance of the differences is expressed as letters a-e where a: p=2,5E−7, b: p=2,4E−5, c: p=1,14E−10, d: p=9.9E−7, e: p=0.6. Differences of p <0.05 were considered as significant.
Figure 3
Figure 3
Cellular Ferritin (A, B) and total iron levels (B) in Caco-2 cells incubated with the different iron compounds. (A) Cellular ferritin levels of cells incubated with ferric EDTA (0.05 mM) was lower than in cells incubated with ferrous sulfate (0.05 mM). Data are presented as means ± SD (n=3). (B) Cellular levels of total iron and the corresponding ferritin levels in cells incubated with ferric citrate and ferrous sulfate (2 mM). Data are presented as means ± SD (n=4).
Figure 4
Figure 4. ADAM17 protein levels in human epithelial duodenum adenocarcinoma Caco-2 cells
The cells were incubated with ferric citrate, ferric EDTA, ferrous sulfate, or control cells with no additional iron to the growth medium. ADAM17 levels were measured with the Thermo Scientific™ hTACE ELISA kit. Data are expressed as means ± SD (n=3). The significance of the differences is expressed as letters a-d where a: p=0.029, b: p=0.026, c: p=0.028, d: p=0.04, e: p=0.08. Differences of p <0.05 were considered as significant.
Figure 5
Figure 5
Confluence curves in the human epithelial colorectal adenocarcinoma cell line Caco-2 (A) and the human epithelial duodenum adenocarcinoma cell line Hutu-80 (B) with different iron compounds. Cells were treated for an average of 66 h with the indicated iron compounds in complete growth media containing 5% FBS. Data shown as area under the confluence curve for cells grown in media supplemented with each compound divided by the area under the curve for cells grown in un-supplemented media (i.e. media without any of the added iron compounds). Data are presented as mean with SD (n = 2 or 1 independent experiments with 3 replicates for each experiment).
Figure 6
Figure 6. Phosphorylation of the MAP kinases ERK 1 and 2 in epithelial adenocarcinoma cells
(A) Total phospho-ERK 1 and 2 levels in Caco-2 cells at iron levels that could be found in the human gut. Data are presented as Means ± SD (n=3) measured with instantOne™ phospho-ERK 1/2 assay. The significance of the differences is expressed as letters a-d where a: p=0.05, b: p=0.5, c: p=0.002, d: p=0.04. (B) Western blot data presented as a bar graph (n=2) ofphosphorylated ERK 1 and 2, respectively, in the human epithelia adenocarcinoma cell line Hutu-80 cells at slightly higher than normal gut concentration of iron (1 mM). (C) Total phospho-ERK 1 and 2 levels in Caco-2 cells at slightly higher iron concentration. (D) Protein Array data of amphiregulin, EGFr, and DKK-1 levels at comparative iron concentrations are presented for the purpose of comparison to the phosphorylation (activation) of ERK.

Similar articles

Cited by

References

    1. Short MW, Domagalski JE. Iron deficiency anemia: evaluation and management. Am Fam Physician. 2013;87:98–104. - PubMed
    1. Floege J, Covic AC, Ketteler M, Rastogi A, Chong EM, Gaillard S, Lisk LJ, Sprague SM, Group PAS. A phase III study of the efficacy and safety of a novel iron-based phosphate binder in dialysis patients. Kidney Int. 2014;86:638–47. https://doi.org/10.1038/ki.2014.58 - DOI - PMC - PubMed
    1. Yokoyama K, Hirakata H, Akiba T, Sawada K, Kumagai Y. Effect of oral JTT-751 (ferric citrate) on hyperphosphatemia in hemodialysis patients: results of a randomized, double-blind, placebo-controlled trial. Am J Nephrol. 2012;36:478–87. https://doi.org/10.1159/000344008 - DOI - PubMed
    1. Liao J, Seril DN, Yang AL, Lu GG, Yang GY. Inhibition of chronic ulcerative colitis associated adenocarcinoma development in mice by inositol compounds. Carcinogenesis. 2007;28:446–54. - PubMed
    1. Radulescu S, Brookes MJ, Salgueiro P, Ridgway RA, McGhee E, Anderson K, Ford SJ, Stones DH, Iqbal TH, Tselepis C, Sansom OJ. Luminal iron levels govern intestinal tumorigenesis after apc loss in vivo. Cell Rep. 2016;17:2805–7. https://doi.org/10.1016/j.celrep.2016.10.028 - DOI - PubMed