

Heterogeneity in hepatitis C treatment prescribing and uptake in Australia: a geospatial analysis of a year of unrestricted treatment access
- PMID: 29682303
- PMCID: PMC5892674
- DOI: 10.1016/S2055-6640(20)30253-3
Heterogeneity in hepatitis C treatment prescribing and uptake in Australia: a geospatial analysis of a year of unrestricted treatment access
Abstract
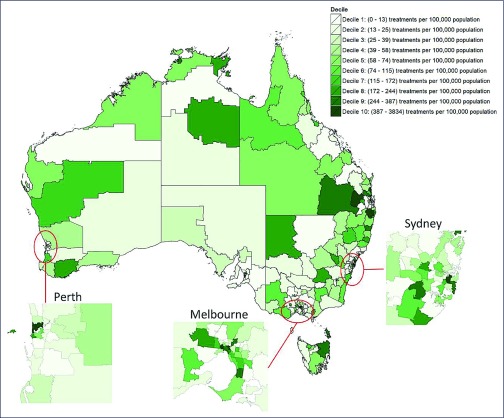
Background and aim: Direct-acting antiviral (DAA) treatments became available for all people living with hepatitis C virus (HCV) in Australia in March 2016. We assess variations in treatment rates and prescribing patterns across Australia's 338 Statistical Area 3 (SA3) geographical units.
Methods: Geocoded DAA treatment initiation data were analysed for the period 1 March 2016 to 30 June 2017. Regression models tested associations between the population demographics and healthcare service coverage of geographical areas and (a) their treatment rates; and (b) the proportion of prescriptions written by specialists compared to non-specialists.
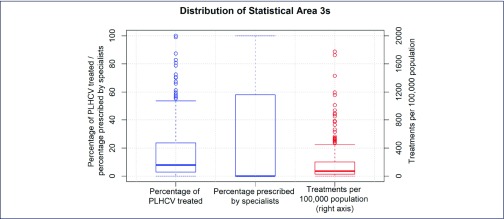
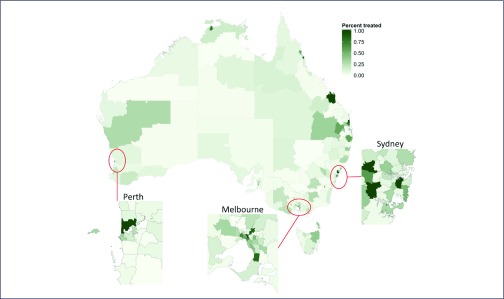
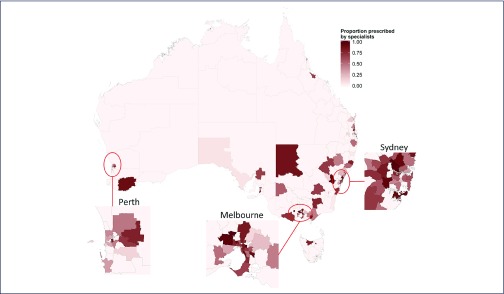
Results: Across the 320 areas (95%) recording treatments, a median 76 (interquartile range [IQR] 35-207, range 4-3834) per 100,000 were initiated, corresponding to an estimated median 7.9% (IQR 2.9-23.6%, range 0-100%) treatment uptake. Major cities, areas of socioeconomic advantage and areas with lower proportions of the population born overseas had the highest per capita treatment rates. Non-specialists prescribed 46% (20,323/44,382) of treatment initiations. Prescriptions were written by non-specialists only in 163 areas (51%), while in other areas a median 40.0% (IQR 21.8-62.5%) of prescriptions were written by non-specialists. Non-specialist prescribing was higher in regional areas, as well as areas that had greater proportions of Indigenous Australians.
Conclusions: High national-level treatment uptake of 20% in Australia masks underlying health system limitations; more than half of geographical areas may have treated less than 8% of people living with HCV. Areas of socioeconomic disadvantage and areas with a higher proportion of the population born overseas may need targeting with interventions to improve treatment uptake.
Keywords: direct-acting antivirals; elimination; geospatial analysis; hepatitis C virus.
Figures
References
-
- World Health Organization Global health sector strategy on viral hepatitis 2016–2021. Available at: www.who.int/hepatitis/strategy2016-2021/ghss-hep/en ( accessed March 2018).
-
- Scott N, McBryde ES, Thompson A et al. Treatment scale-up to achieve global HCV incidence and mortality elimination targets: a cost-effectiveness model. Gut 2017; 66: 1507– 1515. - PubMed
-
- Australian Government Department of Health: The Pharmaceutical Benefits Scheme November 2015 – Positive Recommendations. 2015. Available at: www.pbs.gov.au/info/industry/listing/elements/pbac-meetings/pbac-outcome... ( accessedMarch 2018).
-
- Australian Government Department of Health: The Pharmaceutical Benefits Scheme General statement for drugs for the treatment of hepatitis C. Available at: www.pbs.gov.au/healthpro/explanatory-notes/general-statement-pdf/general... ( accessed March 2018).
-
- Kirby Institute. Annual Surveillance Report of HIV, viral hepatitis, STIs 2016. Available at: https://kirby.unsw.edu.au/report/annual-surveillance-report-hiv-viral-he... ( accessed March 2018).
Publication types
LinkOut - more resources
Full Text Sources