. 2018 Jan 18;4(4):FSO282.
doi: 10.4155/fsoa-2017-0115. eCollection 2018 Apr.

Validation of quantitative polymerase chain reaction with Southern blot method for telomere length analysis

Affiliations

Validation of quantitative polymerase chain reaction with Southern blot method for telomere length analysis

Mohamad Tarik et al. Future Sci OA. .

Abstract

Aim: Telomere length (TL) measurement by quantitative polymerase chain reaction (PCR) has been widely accepted, but limited information regarding its validation with a gold-standard technique is available.

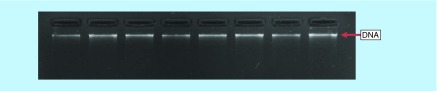
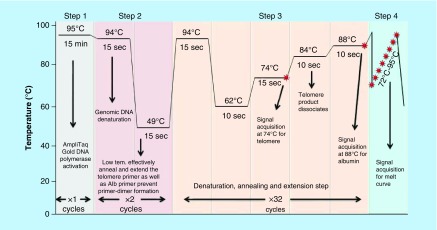
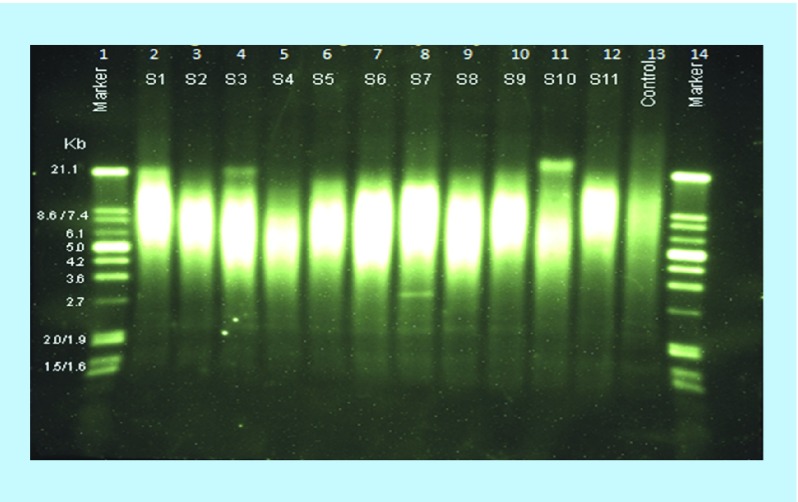
Materials & methods: We measured TL by Southern blot and monochrome multiplex quantitative PCR (MMqPCR) and validated the results of TL in leukocytes of 94 participants with mean age 43.2 years, BMI 19-41 (mean 27.8 ± 4.3) kg/m2.

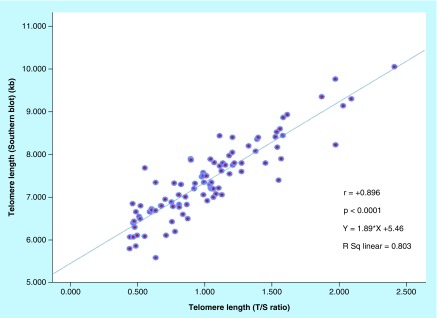
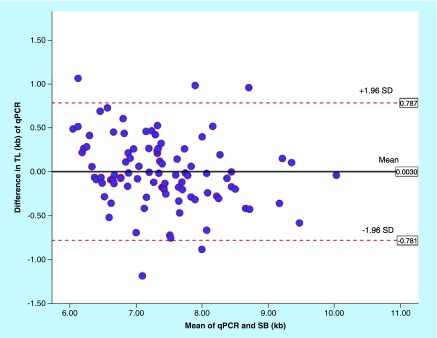
Results: A significant positive correlation was observed between TL measured by MMqPCR and Southern blot assay (correlation coefficient r = +0.896, p < 0.0001). The inter- and intra-assay CVs of the MMqPCR assay were 5.3 and 4.07%, respectively.

Conclusion: We observed that experimental discrepancies have an impact on TL analysis and there is a need to improve the optimum conditions.

Keywords: MMqPCR; Southern blot; correlation; qPCR; reliability; reproducibility; telomere biology.


Conflict of interest statement

Financial & competing interests disclosure The authors would like to thank the participants and New Delhi Birth Cohort Study team members who took part in this study. The authors would like to acknowledge the Department of Biotechnology, Ministry of Science and Technology, India for providing the financial support for conducting experimental work. The authors have no other relevant affiliations or financial involvement with any organization or entity with a financial interest in or financial conflict with the subject matter or materials discussed in the manuscript apart from those disclosed. No writing assistance was utilized in the production of this manuscript.

Figures

<b>Figure 1.</b>
Figure 1.. Visualization of genomic DNA on 0.8% agarose gel.
A single band of good intensity shows a good quality and integrity of the genomic DNA.
<b>Figure 2.</b>
Figure 2.. Thermal cycling protocol for monochrome multiplex quantitative polymerase chain reaction on Real-Time PCR machine (IQ5, Bio-Rad).
In the first step, Taq DNA polymerase was activated and genomic DNA was denatured. In second step, primers were annealed and extended effectively at low temperature in two cycles. In third step, the cycles were repeated. The acquisition at 74°C provided the Ct values for telomeres and the acquisition at 88°C provided the Ct values for the single-copy gene (albumin). In the final step, melt curve was prepared by increasing temperature at the end of the experiment. Tem.: Temperature.
<b>Figure 3.</b>
Figure 3.. Melt curve and melt peak and standard curve of telomere and albumin gene.
To prepare melting curves, reactions were cooled to 72°C after the completion of step 3 of thermal cycling and signals were acquired from 72 to 95°C, in 0.5°C steps, with a 30 s dwell period per step. The melt curve (A) and melt peak (B) show good homogeneity and specificity of amplified product of telomere and albumin. In the semi log plot of DNA concentration versus cycle threshold, both standard curves (C & D) were linear over the 81-fold DNA concentration range of standard DNA (R2 = 0.999). The efficiency and slope of standard curves of telomere (E = 103.5%, slope = -3.241) and albumin (E = 102.9%, slope = -3.254) were noted.
<b>Figure 4.</b>
Figure 4.. Chemiluminescence detection of absolute telomere length by Southern blot.
Lane1, 14: Molecular marker; Lane 2–12: Unknown sample; Lane 13: Control. Telomeric restriction fragments were transferred to the nylone membrane and exposed to the imaging device using chemileumenescence detection system and telomeric restriction fragments were visualized. Telomere-restricted fragments length of each lane containing a different DNA sample was analyzed separately on the basis of migration distance of telomeric DNA in comparison to a known MW DNA marker. Bands in lane 4, 8 and 11 at the position 21, 2.7 and 21 kb, respectively are also telomeric restriction fragments.
<b>Figure 5.</b>
Figure 5.. Correlation of telomere length measured by monochrome multiplex quantitative polymerase chain reaction with Southern blot.
The scatter diagram comparing relative telomere length (telomeric DNA with fluorescent signals/single-copy housekeeping gene ratios) measured by monochrome multiplex quantitative polymerase chain reaction and absolute telomere length (kilobyte) measured by Southern blot analysis in leukocytes from 94 participants. A strong correlation was observed between both methods (r = +0.896).
<b>Figure 6.</b>
Figure 6.. Bland–Altman agreement between monochrome multiplex quantitative polymerase chain reaction (kilobyte) and Southern blot (kilobyte) analysis for leukocyte telomere length.
Bland–Altman plot for agreement analysis of quantitative polymerase chain reaction (kilobyte) and Southern blot analysis (kilobyte). The bias was 0.003 kb and limits of agreement ranged from -0.781 to 0.787 kb. qPCR: Quantitative polymerase chain reaction; SB: Southern blot; SD: Stansard deviation; TL: Telomere length.

Similar articles

Cited by

References

    1. Harley CB, Futcher AB, Greider CW. Telomeres shorten during ageing of human fibroblasts. Nature. 1990;345(6274):458–460. - PubMed
    1. Benetos A, Gardner JP, Zureik M, et al. Short telomeres are associated with increased carotid atherosclerosis in hypertensive subjects. Hypertension. 2004;43(2):182–185. - PubMed
    1. Aviv A. Leukocyte telomere length, hypertension, and atherosclerosis: are there potential mechanistic explanations? Hypertension. 2009;53(4):590–591. - PubMed
    1. Bhupatiraju C, Saini D, Patkar S, Deepak P, Das B, Padma T. Association of shorter telomere length with essential hypertension in Indian population. Am. J. Hum. Biol. 2012;24(4):573–578. - PubMed
    1. Brouilette S, Singh RK, Thompson JR, Goodall AH, Samani NJ. White cell telomere length and risk of premature myocardial infarction. Arterioscler. Thromb. Vasc. Biol. 2003;23(5):842–846. - PubMed

LinkOut - more resources