

Bootstrap inference when using multiple imputation
- PMID: 29682776
- PMCID: PMC5986623
- DOI: 10.1002/sim.7654
Bootstrap inference when using multiple imputation
Abstract
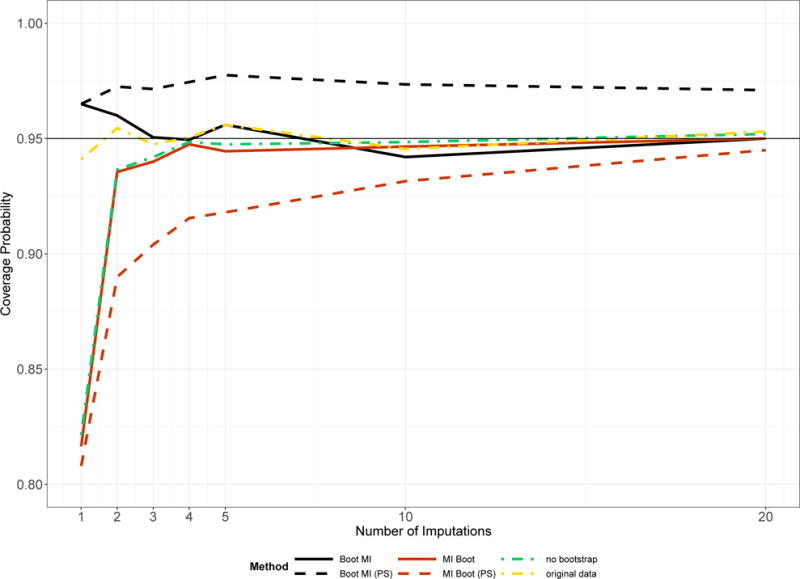
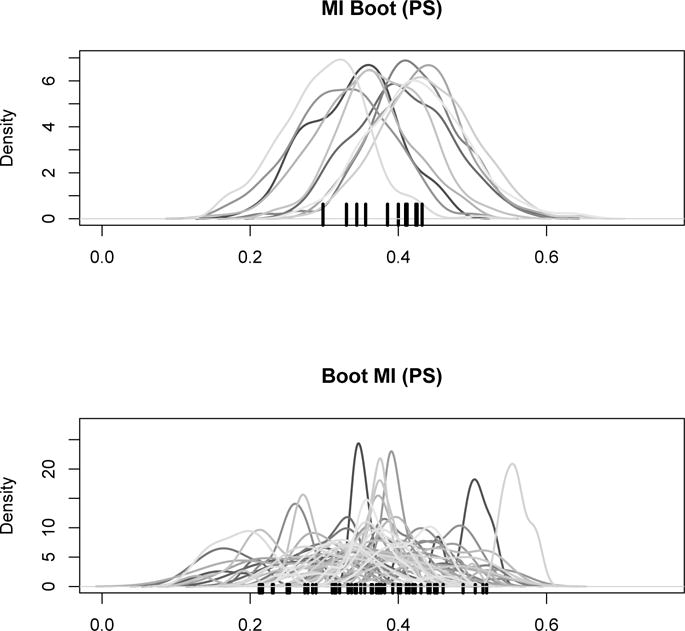
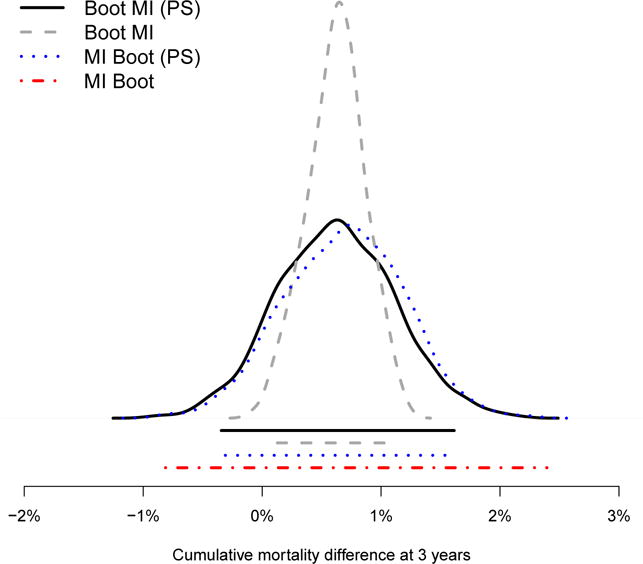
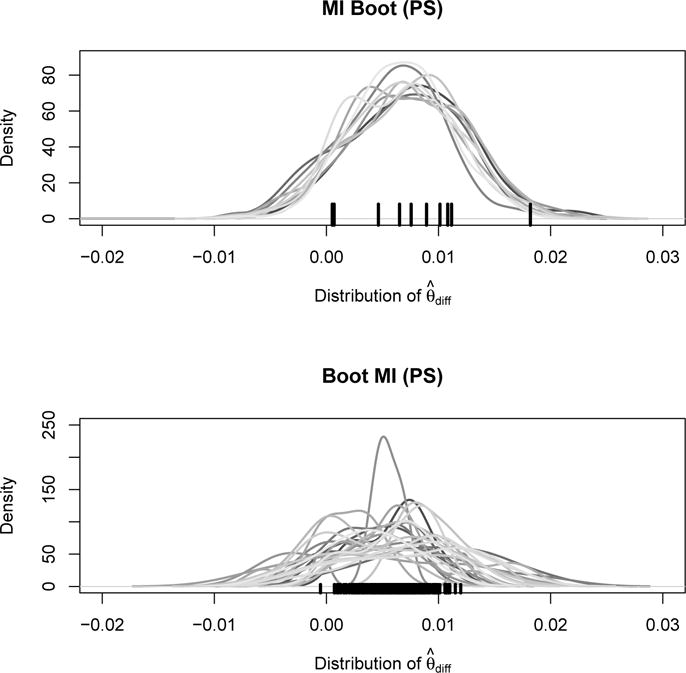
Many modern estimators require bootstrapping to calculate confidence intervals because either no analytic standard error is available or the distribution of the parameter of interest is nonsymmetric. It remains however unclear how to obtain valid bootstrap inference when dealing with multiple imputation to address missing data. We present 4 methods that are intuitively appealing, easy to implement, and combine bootstrap estimation with multiple imputation. We show that 3 of the 4 approaches yield valid inference, but that the performance of the methods varies with respect to the number of imputed data sets and the extent of missingness. Simulation studies reveal the behavior of our approaches in finite samples. A topical analysis from HIV treatment research, which determines the optimal timing of antiretroviral treatment initiation in young children, demonstrates the practical implications of the 4 methods in a sophisticated and realistic setting. This analysis suffers from missing data and uses the g-formula for inference, a method for which no standard errors are available.
Keywords: HIV; causal inference; g-methods; missing data; resampling.
Copyright © 2018 John Wiley & Sons, Ltd.
Figures
References
-
- Rubin DB. Multiple imputation after 18+ years. Journal of the American Statistical Association. 1996;91(434):473–489.
-
- Honaker J, King G, Blackwell M. Amelia II: A program for missing data. Journal of Statistical Software. 2011;45(7):1–47.
-
- van Buuren S, Groothuis-Oudshoorn K. mice: Multivariate imputation by chained equations in R. Journal of Statistical Software. 2011;45(3):1–67.
-
- Royston P, White IR. Multiple imputation by chained equations (mice): Implementation in Stata. Journal of Statistical Software. 2011;45(4):1–20.
Publication types
MeSH terms
Substances
Grants and funding
LinkOut - more resources
Full Text Sources
Other Literature Sources