. 2018 Apr 23;14(4):e1006121.
doi: 10.1371/journal.pcbi.1006121. eCollection 2018 Apr.

Identifying robust hysteresis in networks

Affiliations

Identifying robust hysteresis in networks

Tomáš Gedeon et al. PLoS Comput Biol. .

Abstract

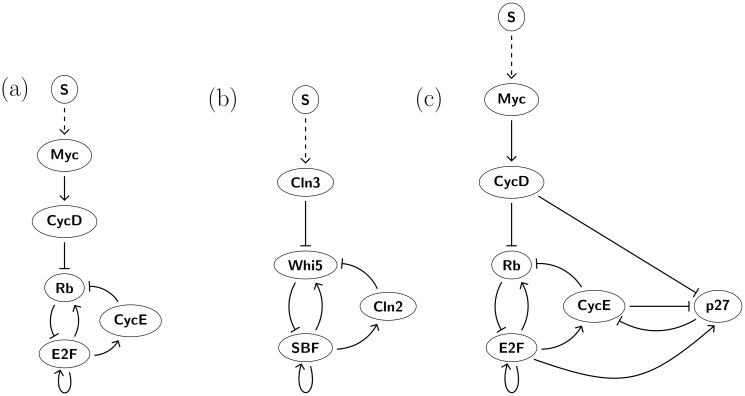
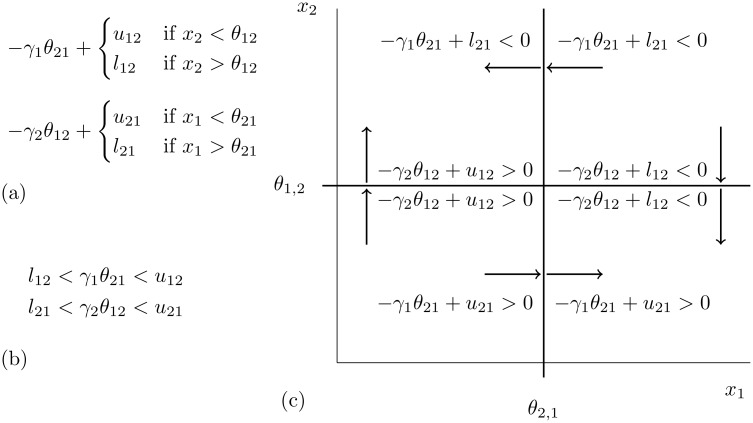
We present a new modeling and computational tool that computes rigorous summaries of network dynamics over large sets of parameter values. These summaries, organized in a database, can be searched for observed dynamics, e.g., bistability and hysteresis, to discover parameter regimes over which they are supported. We illustrate our approach on several networks underlying the restriction point of the cell cycle in humans and yeast. We rank networks by how robustly they support hysteresis, which is the observed phenotype. We find that the best 6-node human network and the yeast network share similar topology and robustness of hysteresis, in spite of having no homology between the corresponding nodes of the network. Our approach provides a new tool linking network structure and dynamics.


Conflict of interest statement

The authors have declared that no competing interests exist.

Figures

Fig 1
Fig 1. Hysteresis and resettable bistability.
Solid (dashed) lines indicate stable (unstable) equilibria for fixed values of input, Off = Low Equilibrium, B = Bistability, and On = High Equilibrium. Resettable bistability: When input signal is withdrawn from a bistable system, and the system resets to the low equilibrium (filled circle). Hysteresis: In addition to resettable bistability, when signal is increased, system goes to high equilibrium (circle). (a) Hysteresis; (b) resettable bistability, but not hysteresis. (c) No resettable bistability.
Fig 2
Fig 2. DSGRN for toggle switch.
(a) Regulatory network for the toggle switch. (b) Thresholds {θ2,1, θ1,2} divide phase space, (0, ∞)2, into four 2-dimensional domains (black dots) and 1-dimensional walls separating the domains (circles). (c) For each choice of parameters, given a domain there is a well-defined direction of dynamics at walls that defines the state transition graph (see Fig 6 for the derivation of this dynamics). State transition graph for parameters in regions 5 and 9 of the parameter graph. The Morse graph for 9 consists of a single node FP(0, 1) where FP indicates that the node is terminal in the Morse graph (a trivial statement for this simple example) and that the vector representation of the associated region is (0, 1). The Morse graph for 5 contains two nodes FP(0, 1) and FP(1, 0). (d) Visual interpretation of SQL DSRGN database for toggle switch organized as a parameter graph with explicit description of parameter domains (inequalities in bottom of each square) and Morse graphs (top part of each square) valid over corresponding parameter domain. Dashed boxes indicate elements of PG(¬1) = {G1, G2, G3}.
Fig 3
Fig 3. 3 node E2F-Rb networks.
(a) 3 node network with potential edges from [4] with signal S acting on MD. (b) Histogram showing 24 regulatory networks expressing full path hysteresis between QS and PS. Five regulatory networks show full path hysteresis in 100% of EPGMD). (c) Histogram showing 27 regulatory networks expressing partial path hysteresis between QS and PS. (d) Histogram showing 25 regulatory networks expressing full path resettable (QS,PS) bistability to QS. (e) Histogram showing 35 regulatory networks expressing full path resettable (QS,PS) bistability to QS. (f)-(j) Five networks that exhibit full path hysteresis along all appropriate paths in EPGMD) These networks are also the top five networks in partial path hysteresis in descending order (f),(g)-(i), (j). Network (f) is also highest in prevalence of partial path resettable bistability, but does not show any full path resettable bistability. Full results for all networks can be find in S1 Table, where the five networks (f)-(j) have numbers 24,39,46,26 and 22.
Fig 4
Fig 4. Search for the best 5 node E2F-Rb network.
(a) Full 5 node E2F-Rb network with input S. We test 12 subnetworks, listed in Table (b), top, for robustness of partial path and full path resettable bistability and hysteresis. (b) Each of the 12 subnetworks contains the unmarked edges in (a). In addition, we either add one of the edges 7 or 8, and/or a subset of the pair of edges (2a, 2b). The second through fifth columns list the percentage of subgraphs in EPGMD) satisfying indicated query. Top three results in each column are emphasized. Note that top three networks in first three queries agree. While the very best network under full path resettable bistability is the same as for full path hyesteresis, none of the top three networks for full path hysteresis has either edge 7 or the edge 8.
Fig 5
Fig 5. Comparison between human and yeast networks.
(a) The best 5-node network from Fig 4(b) that exhibits the most robust full path and partial path hysteresis. (b) Cell cycle initiation network from yeast (START network) [29, 30] exhibits robust resettable bistability in 23.81% of the full paths 12.8%. Because the networks in (a) and (b) only differ by a node with a single input and single output (Myc), the networks in (a) and (b) will give the same results in our analysis. (c) Best 5-node network from Fig 4(b) with added p27 shows full path resettable bistability in 6.43% and full path hysteresis in 0.35% of the corresponding parameter paths.
Fig 6
Fig 6
(a) Field equations for toggle switch. (b) Parameter values that are associated with parameter node 5. (c) Evaluation of field inequalities at four 1-dimensional faces (walls) of domains based on the given parameter value. Arrows indicate direction of dynamics induced by inequalities.

References

    1. Alon U. An introduction to systems biology. Chapman & Hall/CRC; 2007.
    1. Ma W, Trusina A, El-Samad H, Lim WA, Tang C. Defining Network Topologies that Can Achieve Biochemical Adaptation. Cell. 2009;138(4):760–773. doi: 10.1016/j.cell.2009.06.013 - DOI - PMC - PubMed
    1. Shah NA S C. Robust Network Topologies for Generating Switch-Like Cellular Responses. PLoS Comput Biol. 2011;7(6):e1002085 doi: 10.1371/journal.pcbi.1002085 - DOI - PMC - PubMed
    1. Yao G, Tan C, West M, Nevins J, You L. Origin of bistability underlying mammalian cell cycle entry. Molecular Systems Biology. 2011;485(7). - PMC - PubMed
    1. Artzy-Randrup Y, Fleeishman S, Ben-Tal N, Stone L. Comment on Network Motifs: Simple Building Blocks of Complex Networks and Superfamilies of Evolved and Designed Networks. Science. 2004;305:1107c doi: 10.1126/science.1099334 - DOI - PubMed

Publication types

LinkOut - more resources