. 2018 Apr 23;14(4):e1006125.
doi: 10.1371/journal.pcbi.1006125. eCollection 2018 Apr.

Switchable slow cellular conductances determine robustness and tunability of network states

Affiliations

Switchable slow cellular conductances determine robustness and tunability of network states

Guillaume Drion et al. PLoS Comput Biol. .

Abstract

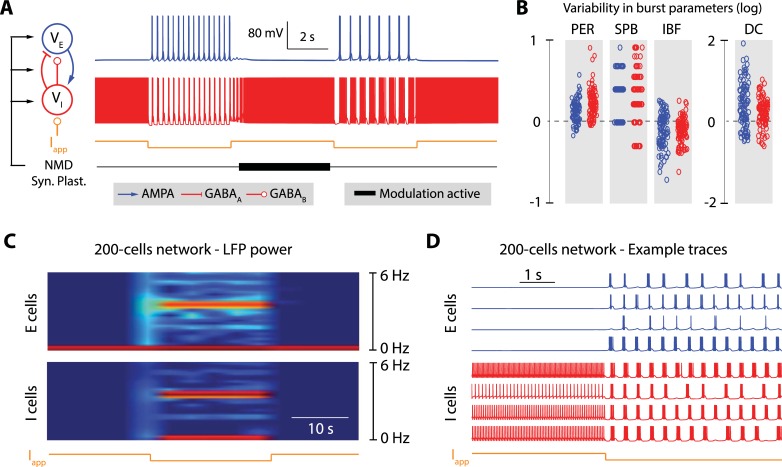
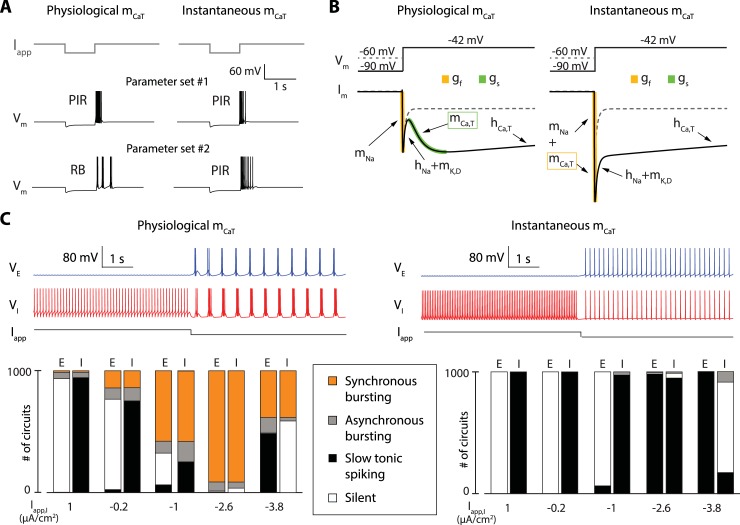
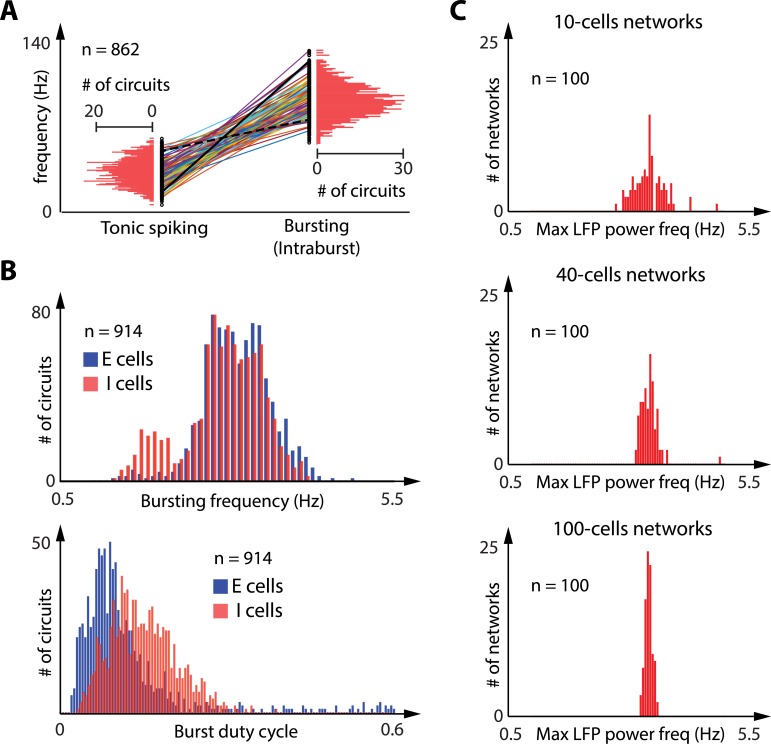
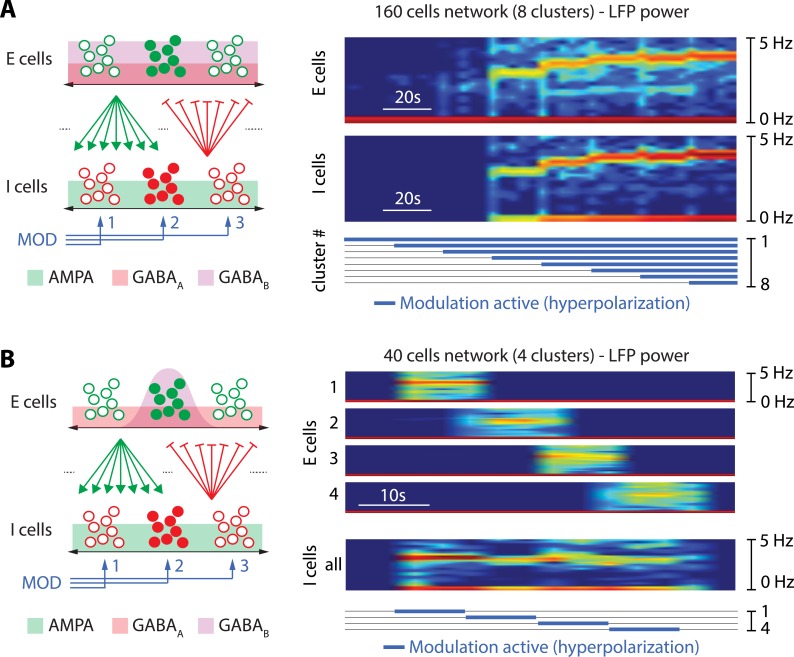
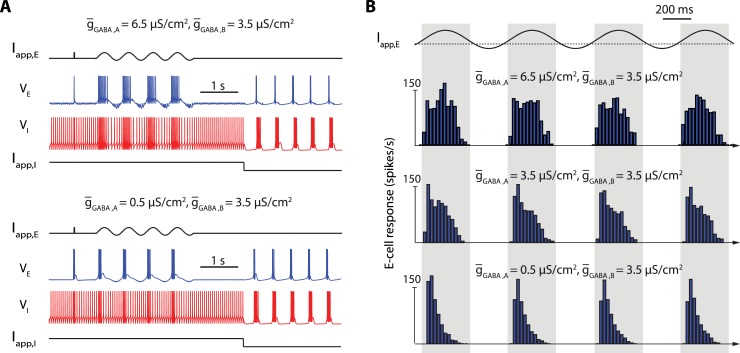
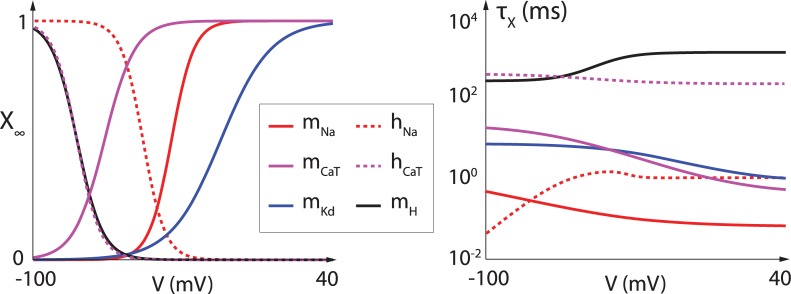
Neuronal information processing is regulated by fast and localized fluctuations of brain states. Brain states reliably switch between distinct spatiotemporal signatures at a network scale even though they are composed of heterogeneous and variable rhythms at a cellular scale. We investigated the mechanisms of this network control in a conductance-based population model that reliably switches between active and oscillatory mean-fields. Robust control of the mean-field properties relies critically on a switchable negative intrinsic conductance at the cellular level. This conductance endows circuits with a shared cellular positive feedback that can switch population rhythms on and off at a cellular resolution. The switch is largely independent from other intrinsic neuronal properties, network size and synaptic connectivity. It is therefore compatible with the temporal variability and spatial heterogeneity induced by slower regulatory functions such as neuromodulation, synaptic plasticity and homeostasis. Strikingly, the required cellular mechanism is available in all cell types that possess T-type calcium channels but unavailable in computational models that neglect the slow kinetics of their activation.


Conflict of interest statement

The authors have declared that no competing interests exist.

Figures

Fig 1
Fig 1. A robust network switch that is compatible with global neuromodulation, synaptic plasticity and homeostasis.
A. Variations of the firing pattern of two interconnected neurons (one excitatory neuron, in blue, and one inhibitory neuron, in red) under the control of an external current (Iapp, in orange), slow neuromodulators (NMD, in black), and synaptic plasticity (Syn. Plast., in black). The tick, black trace depicts periods during which the slow neuromodulator and synaptic plasticity are active. They are modeled as random changes in ion channel and receptor maximal conductances. The excitatory neuron is connected to the inhibitory neuron via AMPA synapses, and the inhibitory neuron is connected to the excitatory neuron via GABAA and GABAB synapses. The external current, which transiently hyperpolarizes the inhibitory neuron, switches the rhythm of the circuit. The fast switch is robust to the rhythmic variability induced by slow neuromodulators and synaptic plasticity (compare the rhythm generated by the fast switch before and after the action of NMD and Syn. Plast.). B. Quantification of the variability of rhythms that can be generated by the action of slow neuromodulators and synaptic plasticity without disrupting the fast switch. The figure plots the difference in bursting period (PER), number of spike per bursts (SPB), intraburst frequency (IBF) and burst duty cycle (DC) of the fast switch-induced rhythm before and after the application of 100 different tones of slow neuromodulation and Syn. Plast. (log(parameter_after/parameter_before)) C. Spectrogram of the local field potentials (LFP’s) of excitatory neuron (top) and inhibitory neuron populations in a 200-cell network (100 excitatory cells fully connected to 100 inhibitory cells with random synaptic weights taken within a fixed range). The orange trace at the bottom depicts the period during which the external hyperpolarizing current is applied to the inhibitory neurons. The hyperpolarization is shown to transiently switch the mean field rhythm of the population, which is shown by the appearance of a transient high power band in the spectrogram. D. Example traces of single neuron activity in the excitatory (in blue) and inhibitory subpopulations (in red) for the network switch shown in C. The orange trace at the bottom depicts the period during which the external hyperpolarizing current is applied to the inhibitory neurons.
Fig 2
Fig 2. The cellular switch requires the kinetics of T-type calcium activation to be slow; it is lost when the activation is modeled as instantaneous.
A. Response of the model neuron to the application of transient hyperpolarization for two different parameter sets in two models that only differ in the activation kinetics of T-type calcium channels, which is either physiologically slow (left) or instantaneous (right). For the first parameter set (middle traces), a release of the hyperpolarization induces the generation of a transient spiking period in both models, a property called post-inhibitory rebound (PIR). This observation shows that PIR is robust to T-type calcium channel activation kinetics. For the second parameter set (bottom traces), a release of the hyperpolarization induces the generation of a transient bursting period in the model having slow T-type calcium channel activation kinetics (left), a property called rebound bursting (RB), whereas it induces a PIR in the model having instantaneous T-type calcium channel activation kinetics (right). This observation shows that, contrary to PIR, RB is sensitive to T-type calcium channel activation kinetics. B. Voltage-clamp experiments in two single neuron models that only differ in the activation kinetics of T-type calcium channels, which is either physiologically slow (left) or instantaneous (right), all other parameters being identical. The top traces show the two voltage steps applied to the neurons. These steps only differ in the initial, holding potential, which is either -60 mV (dashed grey trace) or -90 mV (full black trace). The bottom traces show the ionic currents recorded over time during the application of either voltage steps (the dashed grey traces are the current corresponding to the -60 mV holding potential, the full black traces are the current corresponding to the -90 mV holding potential). The responses of both models to the step starting at -60 mV are the same (T-type calcium channels are inactivated, and all other parameters are identical between the two models). The responses of both models to the step starting at -90 mV are very different. The model with physiologically slow T-type calcium channel activation kinetics show two phases of increasing inward current, a fast one (in orange) and a slow one (in green). The model with instantaneous T-type calcium channel activation kinetics show only one amplified fast phase of increasing inward current (in orange). Both current traces however reach the same current level at steady-state, showing that the difference between the two models is of dynamical nature. C. Comparison of the switching capabilities in 2-cell circuits with random intrinsic and synaptic conductances using neuron models with physiologically slow T-type calcium channel activation kinetics (left) or instantaneous T-type calcium channels activation kinetics (right). The top traces show examples of neuronal activity before and after the application of a hyperpolarizing current onto the inhibitory neuron (the excitatory neuron is depicted in blue, and the inhibitory neuron is depicted in red). The bottom bar graphs quantify the activity of 1000 simulated random circuits under the application of 5 different applied currents. Cells are either silent (white), spiking slowly (black), bursting asynchronously (grey) or involved in a synchronous bursting rhythm (orange). With slow activation of T-type calcium channels, most of 1000 simulated random circuits switch from fast to slow rhythms under hyperpolarization (left). None of them was found to switch when the activation is instantaneous (right).
Fig 3
Fig 3. The robustness of the cellular switch to intrinsic and synaptic variability allows for a large tuning of rhythmic properties.
A: Comparison of the tonic spiking frequency before external hyperpolarization and the intraburst frequency during external hyperpolarization in the 862 random 2-cell circuits (out 1000 random 2-cell simulated circuits) that showed a hyperpolarization-induced switch from tonic spiking to synchronized bursting (values are shown for the inhibitory neurons, the excitatory neurons being mostly silent during the depolarization period). Both values are given for every inhibitory cells (black dots), and a line links values for the same cells. The horizontal red bars quantify the occurrence of cells within each frequency range. Both tonic firing and intraburst frequencies show large variability within the population, but intraburst frequency is consistently higher than tonic firing frequency in a given neuron. B: Comparison of the bursting frequency (top) and the burst duty cycle (bottom) in the 914 random 2-cell circuits (out 1000 random 2-cell simulated circuits) that exhibited a synchronized bursting rhythm during hyperpolarization. Vertical bars quantify the occurrence of excitatory cells (in blue) and inhibitory cells (in red) within each bursting frequency range (top) or within each duty cycle range (bottom). Bursting frequency and bursting duty cycle show large variability within the population, showing that a same circuit switch can produce very different circuit rhythms. C: Distribution of maximum LFP power frequency during hyperpolarization in 100 random, highly heterogeneous 10-cells networks (top), 40-cells network (middle) and 100-cells networks (bottom). The red vertical bars show the occurrence of networks within each frequency range. The mean field spectral power shows large variability within the network population for small networks, but the spread of the mean field spectral power gradually shrinks as the population size increases.
Fig 4
Fig 4. The cellular nature of the switch allows for localized spatiotemporal control of the network state.
A, left. Sketch of the spatial network connectivity and clustering in modulatory pathways. Excitatory cells are sketched by (full and empty) green dots, inhibitory cells by (full and empty) red dots, excitatory synapses by green arrows and inhibitory synapses by red lines with perpendicular bars at their tip (excitatory and inhibitory cells are connected in a all to all fashion). The horizontal, double black arrows represent the spatial dimension, and the green, red and purple background the spatial spread of AMPA, GABAA and GABAB synapses coming from the neurons represented by full dots, respectively (synapses are spread evenly in this case). The blue arrows represent different modulatory pathways (3 pathways are represented: MOD 1, 2 and 3). Each modulatory pathway only affects a subpopulation of the inhibitory cells, represented by grouped sets of red dots. A, right. Spectrogram of the local field potentials (LFP’s) of excitatory neuron (top) and inhibitory neuron populations (bottom) in a 160-cell network (80 excitatory cells fully connected to 80 inhibitory cells with random synaptic weights taken within a fixed range) separated in 8 clusters, each modulated by a specific neuromodulatory pathway. The tick, blue traces at the bottom depict the period during which the hyperpolarization is active for each neuromodulatory pathway (from 1 to 8). Spatial localization of modulatory inputs affects the temporal tuning of mean-frequency and amplitude of the LFP spectral power. B, left: Same as A, left, expect for the fact that, here, GABAB synapses are clustered by the addition of a spatial Gaussian decay in the synaptic strength (the GABAB synapse is strong for neighboring neurons but weak for distant neurons). AMPA and GABAA synapses are still spread evenly. B, right. Spectrogram of the local field potentials (LFP’s) of 4 clusters of excitatory neurons (top) and the inhibitory neuron populations in a 40-cell network (20 excitatory cells fully connected to 20 inhibitory cells with random synaptic weights taken within a fixed range and spatial clustering in GABAB synapses). Both population are separated in 4 clusters, each modulated by a specific neuromodulatory pathway. The tick, blue traces at the bottom depict the period during which the hyperpolarization is active for each neuromodulatory pathway (from 1 to 4). Spatial localization of modulatory inputs and GABAB connectivity affects the spatial tuning of the network state. Spatial localization of the GABAB connections only allows for spatial control of the network state, even though AMPA and GABAA connections are all-to-all.
Fig 5
Fig 5. The network switch is robust to a modulation of the transmission properties in the active network sate.
A: Response of excitatory cells to a pulse of excitatory current and a sinusoidal applied current for a high GABARA/GABARB ratio (top) and a low GABARA/GABARB ratio (bottom) within a 40-cells network. For each GABARA/GABARB ratio, the top, black trace show the current applied to the excitatory neurons over time, the blue trace shows the activity of one targeted excitatory neuron over time, the red trace shows the activity of an inhibitory neuron over time, and the bottom, black trace show the current applied to all inhibitory neurons of the population over time. B: Mean excitatory cells response (in spikes per seconds) to a sinusoidal applied current for a high (top), intermediate (center) and low GABARA/GABARB ratio (bottom). Blue vertical bars show the mean spiking rate for each period of time. A change in the GABARA/GABARB ratio strongly affects the relay properties of the excitatory cells in active state without disrupting the network switch, and bursting in relay cells alone does not trigger the network switch, making this firing pattern compatible with the network active state.
Fig 6
Fig 6. Steady-state channel gating curves (left) and time-constant curves (right) for the different ion channels present in the model neuron.
Full lines represent activation curves. Dashed lines represent inactivation curves. Time-constants are shown on a log scale.

Similar articles

Cited by

References

    1. Zagha E, McCormick DA (2014) Neural control of brain state. Curr Opin Neurobiol. 29:178–86. doi: 10.1016/j.conb.2014.09.010 - DOI - PMC - PubMed
    1. Buzsaki G (2006) Rhythms of the brain New York: Oxford University Press.
    1. Wang XJ (2010) Neurophysiological and computational principles of cortical rhythms in cognition. Physiol Rev. 90:1195–268. doi: 10.1152/physrev.00035.2008 - DOI - PMC - PubMed
    1. Uhlhaas PJ, Singer W (2006) Neural synchrony in brain disorders: relevance for cognitive dysfunctions and pathophysiology. Neuron. 52:155–68. doi: 10.1016/j.neuron.2006.09.020 - DOI - PubMed
    1. Lee SH, Dan Y (2012) Neuromodulation of brain states. Neuron. 76:209–22. doi: 10.1016/j.neuron.2012.09.012 - DOI - PMC - PubMed

Publication types

Substances