. 2018 Dec 1;110(12):1400-1408.
doi: 10.1093/jnci/djy063.

Association Between Proportion of Nuclei With High Chromatin Entropy and Prognosis in Gynecological Cancers

Affiliations

Association Between Proportion of Nuclei With High Chromatin Entropy and Prognosis in Gynecological Cancers

Birgitte Nielsen et al. J Natl Cancer Inst. .

Abstract

Background: Nuclear texture analysis measuring differences in chromatin structure has provided prognostic biomarkers in several cancers. There is a need for improved cell-by-cell chromatin analysis to detect nuclei with highly disorganized chromatin. The purpose of this study was to develop a method for detecting nuclei with high chromatin entropy and to evaluate the association between the presence of such deviating nuclei and prognosis.

Methods: A new texture-based biomarker that characterizes each cancer based on the proportion of high-chromatin entropy nuclei (<25% vs ≥25%) was developed on a discovery set of 175 uterine sarcomas. The prognostic impact of this biomarker was evaluated on a validation set of 179 uterine sarcomas, as well as on independent validation sets of 246 early-stage ovarian carcinomas and 791 endometrial carcinomas. More than 1 million images of nuclei stained for DNA were included in the study. All statistical tests were two-sided.

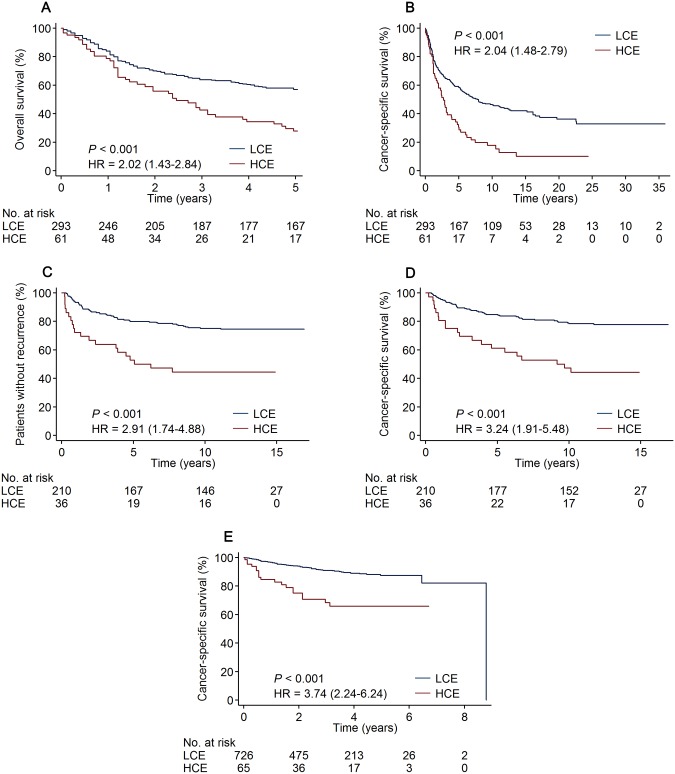
Results: An increased proportion of high-chromatin entropy nuclei was associated with poor clinical outcome. The biomarker predicted five-year overall survival for uterine sarcoma patients with a hazard ratio (HR) of 2.02 (95% confidence interval [CI] = 1.43 to 2.84), time to recurrence for ovarian cancer patients (HR = 2.91, 95% CI = 1.74 to 4.88), and cancer-specific survival for endometrial cancer patients (HR = 3.74, 95% CI = 2.24 to 6.24). Chromatin entropy was an independent prognostic marker in multivariable analyses with clinicopathological parameters (HR = 1.81, 95% CI = 1.21 to 2.70, for sarcoma; HR = 1.71, 95% CI = 1.01 to 2.90, for ovarian cancer; and HR = 2.03, 95% CI = 1.19 to 3.45, for endometrial cancer).

Conclusions: A novel method detected high-chromatin entropy nuclei, and an increased proportion of such nuclei was associated with poor prognosis. Chromatin entropy supplemented existing prognostic markers in multivariable analyses of three gynecological cancer cohorts.


Figures

Figure 1.
Figure 1.
Quantification of chromatin entropy. A) A digital image of a cell nucleus. B) A quadratic window (15 × 15 pixels) is centered on each pixel in the nucleus, and then the pixel is characterized by the gray level i (eg, i = 42) and the entropy j computed from the gray levels included in the window (eg, j = 3.1), where P(i) is the normalized frequency of gray level i within the window. C) Gray levels in a subregion of the window. D) The i and (quantified) j values are used as indices in a two-way table, named a gray level entropy matrix (GLEM), and the frequencies of different (i,j) combinations are accumulated. The final GLEM is normalized by dividing each element in the table by the total number of nuclear pixels, providing a bivariate probability mass function. E) The probability values in the GLEM were sorted in descending order and then summed (starting with the highest value) until the total sum was greater than or equal to 0.25. The concentration of the (i,j) values in the GLEM was measured as the number of matrix elements included in the summation (shown as white pixels) divided by the total number of matrix elements. A smaller number of white matrix elements corresponds to a condensed GLEM, while a larger number of white matrix elements corresponds to a more scattered GLEM. F) A three-dimensional feature plot. The coordinates of the point are the center of mass in gray levels and in entropy values computed from the GLEM in (D) and the relative matrix area from (E). G) The steps shown in (A–F) were performed for all the cell nuclei representing a given patient. H) The data points in the 3D feature space correspond to all measured nuclei from the given patient. Red points correspond to nuclei with high chromatin entropy. Based on the proportion of such nuclei (<25% vs ≥25%), patients were classified as low chromatin entropy (eg, the patient in Part 1 who had 4.0% nuclei with high chromatin entropy) or high chromatin entropy (eg, the patient in Part 2 who had a very high proportion [37.7%] of such nuclei). CME = center of the mass in gray levels; CMG = center of the mass in entropy values.
Figure 2.
Figure 2.
Kaplan-Meier survival curves according to the chromatin entropy marker. The curves are based on the complete data sets of (A and B) uterine sarcoma (354 patients), (C and D) ovarian cancer (246 patients), and (E) endometrial cancer (791 patients). The P values were calculated using the two-sided Mantel-Cox log-rank test. HCE = high chromatin entropy; HR = hazard ratio; LCE = low chromatin entropy.
Figure 3.
Figure 3.
Kaplan-Meier five-year overall survival curves among leiomyosarcoma stage I patients. The survival curves are based on (A) chromatin entropy, (B) a risk classification defined by tumor size and mitoses (12), chromatin entropy within the (C) low-risk, (D) medium-risk, and (E) high-risk groups defined by tumor size and mitoses, and (F) a novel risk classification defined by tumor size, mitoses, and chromatin entropy. Risk classification defined by tumor size and mitoses: low risk: tumor size ≤ 10 cm and MI ≤ 10 per high-power field (HPF); medium risk: tumor size ≤ 10 cm and MI > 10 per HPF or tumor size > 10 cm and MI ≤ 10 per HPF; high risk: tumor size > 10 cm and MI > 10 per HPF. Proposed risk classification defined by tumor size, mitoses, and chromatin entropy: low risk: tumor size ≤ 10 cm, MI ≤ 10 per HPF, and low chromatin entropy; medium risk: tumor size ≤ 10 cm, MI ≤ 10 per HPF, and high chromatin entropy or tumor size ≤ 10 cm and MI > 10 per HPF or tumor size > 10 cm, MI ≤ 10 per HPF, and low chromatin entropy; high risk: tumor size > 10 cm, MI ≤ 10 per HPF, and high chromatin entropy or tumor size > 10 cm and MI > 10 per HPF. The P values were calculated using the two-sided Mantel-Cox log-rank test. *HR of medium risk vs low risk in survival analysis of the three risk groups. †HR of high risk vs low risk in survival analysis of the three risk groups. HCE = high chromatin entropy; HR = hazard ratio; LCE = low chromatin entropy.
Figure 4.
Figure 4.
Kaplan-Meier recurrence-free survival curves among 246 early-stage ovarian cancer patients. Chromatin entropy is computed within the (A) combined low/medium- and (B) high-risk groups, defined by stage and grade (19,20). High-risk ovarian carcinoma was defined as either clear cell histology, poorly differentiated tumor, or the combination of moderately differentiated tumor and International Federation of Gynaecology and Obstetrics (FIGO) stage Ib or Ic; otherwise, the risk was assessed as low (well-differentiated tumor and FIGO stage Ia) or medium (well-differentiated tumor and FIGO stage Ib or Ic, or moderately differentiated tumor and FIGO stage Ia). The P values were calculated using the two-sided Mantel-Cox log-rank test. HCE = high chromatin entropy; HR = hazard ratio; LCE = low chromatin entropy.

References

    1. Hanahan D, Weinberg RA.. Hallmarks of cancer: The next generation. Cell. 2011;1445:646–674. - PubMed
    1. Jamal-Hanjani M, Wilson GA, McGranahan N, et al. Tracking the evolution of non–small-cell lung cancer. N Engl J Med. 2017;376:2109–2121. - PubMed
    1. Danielsen HE, Pradhan M, Novelli M.. Revisiting tumor aneuploidy – the place of ploidy assessment in the molecular area. Nat Rev Clin Oncol. 2016;135:291–304. - PubMed
    1. Morgan MA, Shilatifard A.. Chromatin signatures of cancer. Genes Dev. 2015;29:238–249. - PMC - PubMed
    1. Wolffe AP. Chromatin remodeling: Why it is important in cancer. Oncogene. 2001;2024:2988–2990. - PubMed

Publication types