Impact of sow energy status during farrowing on farrowing kinetics, frequency of stillborn piglets, and farrowing assistance
- PMID: 29684197
- PMCID: PMC6095272
- DOI: 10.1093/jas/sky141
Impact of sow energy status during farrowing on farrowing kinetics, frequency of stillborn piglets, and farrowing assistance
Abstract
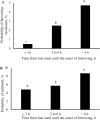
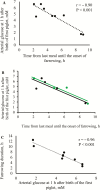
Farrowing duration is rather long in sows most likely due to selection for large litters, and we hypothesized that prolonged farrowings would compromise sow energy status during farrowing and in turn the farrowing process. Two studies were performed as follows: 1) to evaluate whether sow energy status during farrowing compromise the farrowing kinetics (FK, i.e., farrowing duration and birth intervals) and 2) to study the underlying mechanisms potentially affecting stillbirth rate and farrowing assistance. In study-1, parameters affecting FK were characterized based on data from a total of 166 farrowings from 7 feeding trials focused on sow colostrum production. The data were screened for associations with FK using the CORR procedure of SAS. Traits that were correlated with the FK at P < 0.05 were included in a multivariate regression model. Time since last meal until the onset of farrowing greatly affected the farrowing duration (r = 0.76; n = 166; P < 0.001) and a broken-line model was fitted to describe that relationship. According to the model, farrowing duration was constant (3.8 ± 1.5 h) if the farrowing started before the breakpoint (3.13 ± 0.34 h after the last meal), whereas farrowing duration increased to 9.3 h if the farrowing started 8 h after the last meal. Subsequently, sows were divided into 3 categories based on that trait (≤3, 3 to 6, and >6 h) to evaluate the impact on birth intervals, farrowing assistance, and stillbirth rate. Birth intervals (P < 0.001), odds for farrowing assistance (P < 0.001), and odds for stillbirth (P = 0.02) were low, intermediate, and high when time since last meal was ≤3, 3 to 6, and >6 h, respectively. In study-2, blood samples were collected once or twice each week in late gestation and each hour during farrowing to measure arterial concentrations and uterine extractions of plasma metabolites. Time since last meal was strongly negatively correlated with arterial glucose 1 h after the onset of farrowing (r= -0.96; n = 9; P < 0.001). Glucose appeared to be the key energy metabolite for oxidative metabolism of gravid uterus. In conclusion, the present study strongly suggests that a substantial proportion of sows suffer from low-energy status at the onset farrowing and that this negatively affects the farrowing process. Transferring this knowledge into practice, the results suggest that sows should be fed at least 3 daily meals in late gestation.
Figures


References
-
- Assali N. S., Dasgupta K., Kolin A., and Holms L.. 1958. Measurement of uterine blood flow and uterine metabolism. V. Changes during spontaneous and induced labor in unanesthetized pregnant sheep and dogs. Am. J. Physiol. 195:614–620. doi:10.1152/ajplegacy.1958.195.3.614 - PubMed
-
- Bach Knudsen K. E., Jørgensen H., and Theil P. K.. 2016. Changes in short-chain fatty acid plasma profile incurred by dietary fiber composition. J. Anim. Sci. 94:476–479. doi:10.2527/jas2015.9786
-
- Brighenti F. 1998. Summary of the conclusion of the working group on profibre interlaboratory study on determination of short chain fatty acids in blood. In: R. A. F. Gullion M. T. Amaral-Collaco H. Andersson N. G. Asp K. E. Bach Robertson I. Rowland, and J. Van Loo, editors. Functional properties of non-digestible carbohydrates. European Commission, DG XII, Science Research and Development, Brussels: p 150–153.
-
- Canario L., Roy N., Gruand J., and Bidanel J.. 2006. Genetic variation of farrowing kinetics traits and their relationships with litter size and perinatal mortality in French Large White sows. J. Anim. Sci. 84:1053–1058. doi:10.2527/2006.845153x - PubMed
-
- Dial G. D., Marsh W. E., Polson D. D., and Vaillancourt J. P.. 1992. Reproductive failure: differential diagnosis. In: A. D. Leman B. E. Straw W. L. Mengeling S. D’Allaire, and D. J. Taylor editors. Diseases of Swine No. 7th Iowa State University Press, Ames, IA, USA: p. 88–137.
MeSH terms
LinkOut - more resources
Full Text Sources
Other Literature Sources
Medical

