. 2018 Sep 15;198(6):767-776.
doi: 10.1164/rccm.201711-2174OC.

Predicting Outcomes in Idiopathic Pulmonary Fibrosis Using Automated Computed Tomographic Analysis

Affiliations

Predicting Outcomes in Idiopathic Pulmonary Fibrosis Using Automated Computed Tomographic Analysis

Joseph Jacob et al. Am J Respir Crit Care Med. .

Abstract

Rationale: Quantitative computed tomographic (CT) measures of baseline disease severity might identify patients with idiopathic pulmonary fibrosis (IPF) with an increased mortality risk. We evaluated whether quantitative CT variables could act as a cohort enrichment tool in future IPF drug trials.

Objectives: To determine whether computer-derived CT measures, specifically measures of pulmonary vessel-related structures (VRSs), can better predict functional decline and survival in IPF and reduce requisite sample sizes in drug trial populations.

Methods: Patients with IPF undergoing volumetric noncontrast CT imaging at the Royal Brompton Hospital, London, and St. Antonius Hospital, Utrecht, were examined to identify pulmonary function measures (including FVC) and visual and computer-derived (CALIPER [Computer-Aided Lung Informatics for Pathology Evaluation and Rating] software) CT features predictive of mortality and FVC decline. The discovery cohort comprised 247 consecutive patients, with validation of results conducted in a separate cohort of 284 patients, all fulfilling drug trial entry criteria.

Measurements and main results: In the discovery and validation cohorts, CALIPER-derived features, particularly VRS scores, were among the strongest predictors of survival and FVC decline. CALIPER results were accentuated in patients with less extensive disease, outperforming pulmonary function measures. When used as a cohort enrichment tool, a CALIPER VRS score greater than 4.4% of the lung was able to reduce the requisite sample size of an IPF drug trial by 26%.

Conclusions: Our study has validated a new quantitative CT measure in patients with IPF fulfilling drug trial entry criteria-the VRS score-that outperformed current gold standard measures of outcome. When used for cohort enrichment in an IPF drug trial setting, VRS threshold scores can reduce a required IPF drug trial population size by 25%, thereby limiting prohibitive trial costs. Importantly, VRS scores identify patients in whom antifibrotic medication prolongs life and reduces FVC decline.

Keywords: idiopathic pulmonary fibrosis; pulmonary vessels; quantitative computed tomographic imaging.


Figures
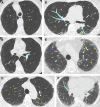
Figure 1.
Figure 1.
Color overlay computed tomographic images demonstrating CALIPER (Computer-Aided Lung Informatics for Pathology Evaluation and Rating software) vessel-related structures (CAL VRSs) of different sizes in the upper and middle lung zones in three patients with idiopathic pulmonary fibrosis with varying degrees of disease severity. (A and B) A 78-year-old male ex-smoker (DlCO, 69.7% predicted) demonstrates mild reticulation at the anterior and posterior aspects of the lungs. (C and D) A 56-year-old female ex-smoker (DlCO, 57.1% predicted) demonstrates coarse reticulation most marked in the apical segments of the lower lobes bilaterally. (E and F) A 68-year-old male ex-smoker (DlCO, 27.5% predicted) has more extensive reticulation in the lung periphery and at the lung bases. As fibrosis extent increases, so too does the CAL VRS score within the lungs. CAL VRS size key: red = <5 mm2; green = 5–10 mm2; yellow = 10–15 mm2; dark blue = 15–20 mm2; light blue = >20 mm2.
Figure 2.
Figure 2.
Scatterplots demonstrating −log10 P values for variables (various computer-derived CALIPER [Computer-Aided Lung Informatics for Pathology Evaluation and Rating software], visual computed tomography–derived, and pulmonary function indices) in the discovery cohort (x-axis) and validation cohort (y-axis). Horizontal and vertical dotted lines represent the Li and Ji corrected cutoffs for statistical significance. (AC) All subjects. (DF) Patients with DlCO greater than or equal to 30% predicted. (GI) Patients with DlCO greater than or equal to 30% predicted who were not exposed to antifibrotic medication. The first column of A, D, and G represents variables predicting FVC decline. The second column of B, E, and H represents variables predicting a 10% FVC decline or death within 12 months. The third column of C, F, and I represents variables predicting survival. In C, to allow visualization of all the points on the figure, values that were infinite (owing to a P value of 0) were set to 20. The pulmonary vessel-related structure score was subdivided according to structure cross-sectional area (<5 mm2, 5–10 mm2, 10–15 mm2, 15–20 mm2, and >20 mm2). AF = antifibrotic therapy; CAL VRS = CALIPER total vessel-related structure scores; CFibrosis = CALIPER fibrosis extent; CILD = CALIPER interstitial lung disease; CPI = composite physiologic index; GAP = gender, age, physiology; LZ = lower zone; MZ = middle zone; MZ VRS = middle zone vessel-related structure scores; PFT = pulmonary function test; TxBx = traction bronchiectasis (extent and severity); UZ = upper zone; UZ VRS = upper zone vessel-related structure scores; VFibrosis = visual fibrosis extent; VILD = visual interstitial lung disease.
Figure 3.
Figure 3.
(AC) −Log10 P values for variables (various computer-derived CALIPER [Computer-Aided Lung Informatics for Pathology Evaluation and Rating software], visual computed tomography–derived, echocardiography-derived, and pulmonary function indices) in all study patients (discovery and validation cohorts) with a DlCO greater than or equal to 30% predicted who were not exposed to antifibrotic medication. The patients were stratified with regard to disease severity on the basis of median DlCO value for the combined cohort (40.15% predicted), with results for patients below the median DlCO shown in DF and patients above the median DlCO shown in GI. A, D, and G represent variables predicting FVC decline. B, E, and H represent variables predicting a 10% FVC decline or death within 12 months. C, F, and I represent variables predicting survival. The pulmonary vessel–related structure score was subdivided according to structure cross-sectional area (<5 mm2, 5–10 mm2, 10–15 mm2, 15–20 mm2, >20 mm2). CPI = composite physiologic index; LZ = lower zone; LZ VRS = lower zone vessel-related structure scores; MZ = middle zone; MZ VRS = middle zone vessel-related structure scores; PFT = pulmonary function test; UZ = upper zone; UZ VRS = upper zone vessel-related structure scores; VFibrosis = visual fibrosis extent; VHC = visual honeycombing extent; VILD = visual interstitial lung disease.

Comment in

References

    1. Navaratnam V, Fleming KM, West J, Smith CJP, Jenkins RG, Fogarty A, et al. The rising incidence of idiopathic pulmonary fibrosis in the U.K. Thorax. 2011;66:462–467. - PubMed
    1. Raghu G, Weycker D, Edelsberg J, Bradford WZ, Oster G. Incidence and prevalence of idiopathic pulmonary fibrosis. Am J Respir Crit Care Med. 2006;174:810–816. - PubMed
    1. Fernández Pérez ER, Daniels CE, Schroeder DR, St Sauver J, Hartman TE, Bartholmai BJ, et al. Incidence, prevalence, and clinical course of idiopathic pulmonary fibrosis: a population-based study. Chest. 2010;137:129–137. - PMC - PubMed
    1. Hutchinson J, Fogarty A, Hubbard R, McKeever T. Global incidence and mortality of idiopathic pulmonary fibrosis: a systematic review. Eur Respir J. 2015;46:795–806. - PubMed
    1. Harari S, Madotto F, Caminati A, Conti S, Cesana G. Epidemiology of idiopathic pulmonary fibrosis in northern Italy. PLoS One. 2016;11:e0147072. - PMC - PubMed

Publication types