. 2018 Jun 10:279:292-305.
doi: 10.1016/j.jconrel.2018.04.026. Epub 2018 Apr 21.

Multi-modal characterization of vasculature and nanoparticle accumulation in five tumor xenograft models

Affiliations

Multi-modal characterization of vasculature and nanoparticle accumulation in five tumor xenograft models

Einar Sulheim et al. J Control Release. .

Abstract

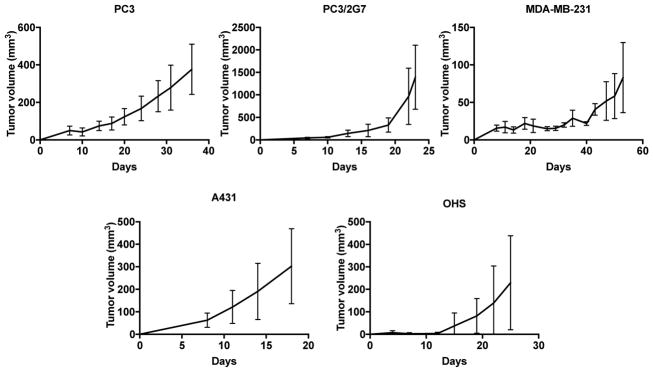
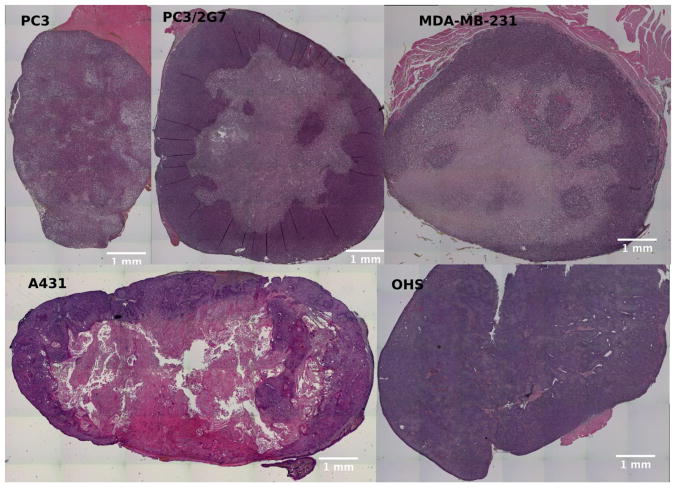
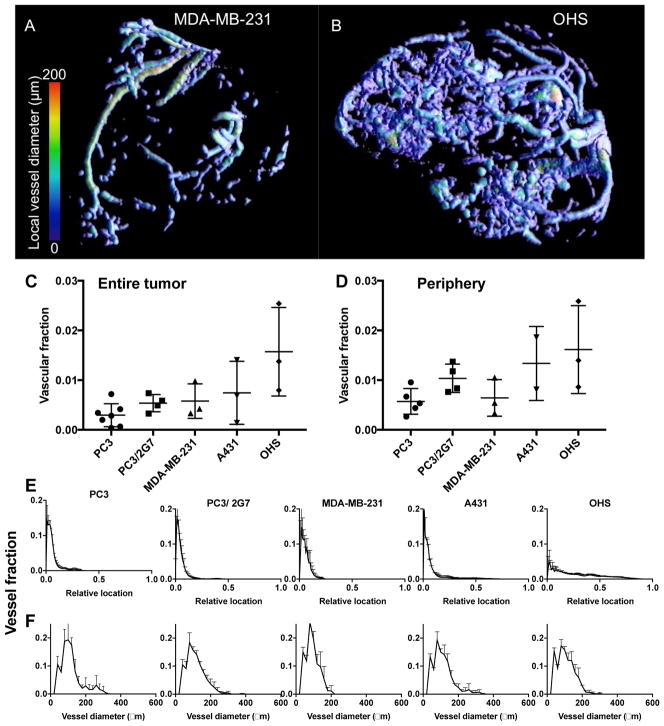
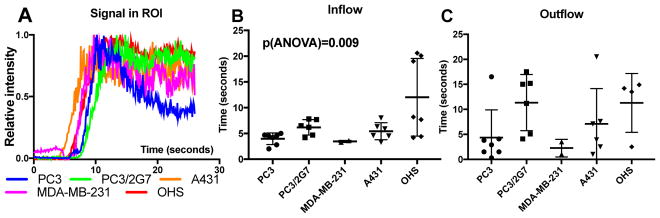
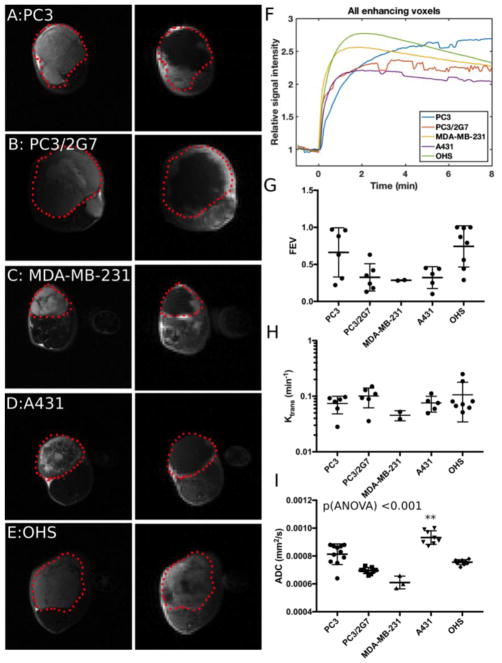
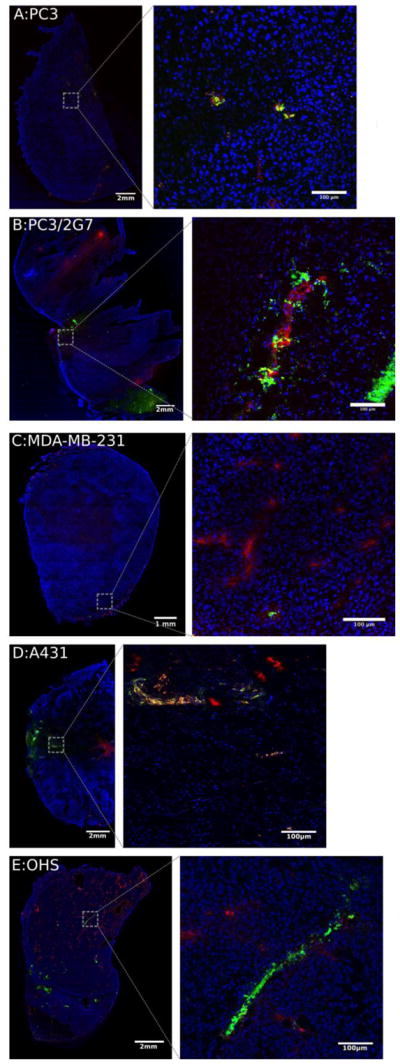
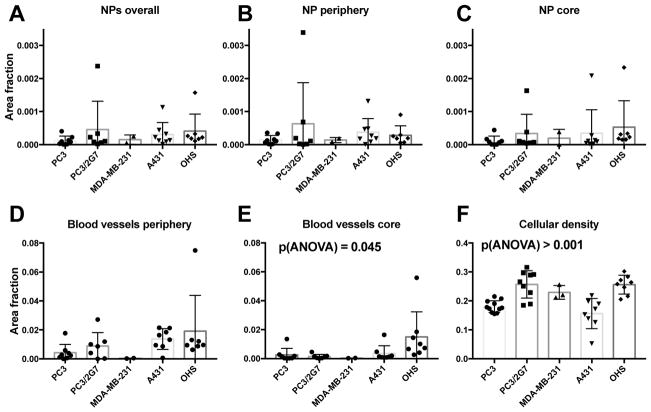
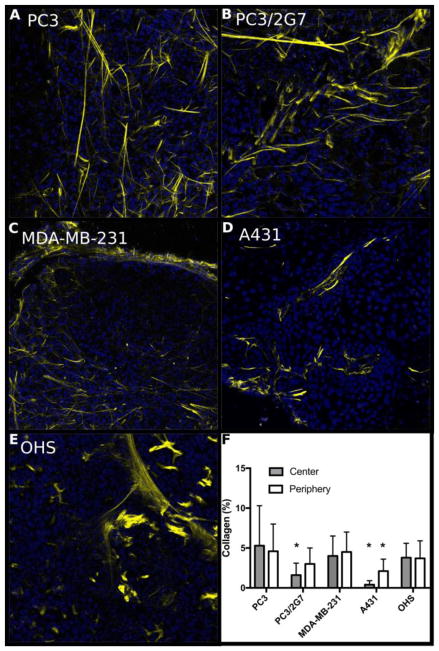
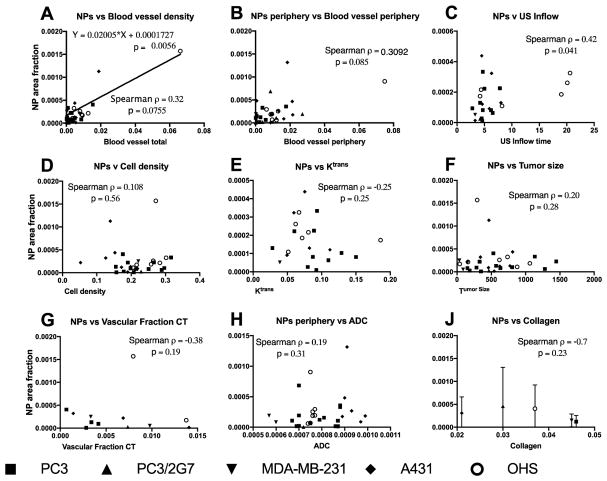
Preclinical research has demonstrated that nanoparticles and macromolecules can accumulate in solid tumors due to the enhanced permeability and retention effect. However, drug loaded nanoparticles often fail to show increased efficacy in clinical trials. A better understanding of how tumor heterogeneity affects nanoparticle accumulation could help elucidate this discrepancy and help in patient selection for nanomedicine therapy. Here we studied five human tumor models with varying morphology and evaluated the accumulation of 100 nm polystyrene nanoparticles. Each tumor model was characterized in vivo using micro-computed tomography, contrast-enhanced ultrasound and diffusion-weighted and dynamic contrast-enhanced magnetic resonance imaging. Ex vivo, the tumors were sectioned for both fluorescence microscopy and histology. Nanoparticle uptake and distribution in the tumors were generally heterogeneous. Density of functional blood vessels measured by fluorescence microscopy correlated significantly (p = 0.0056) with nanoparticle accumulation and interestingly, inflow of microbubbles measured with ultrasound also showed a moderate but significant (p = 0.041) correlation with nanoparticle accumulation indicating that both amount of vessels and vessel morphology and perfusion predict nanoparticle accumulation. This indicates that blood vessel characterization using contrast-enhanced ultrasound imaging or other methods could be valuable for patient stratification for treatment with nanomedicines.

Keywords: MRI; Microscopy; Nanoparticles; Tumor characterization; Tumor vasculature; Ultrasound; microCT.


Figures

Fig. 1
Fig. 1
Growth rate of the 5 different tumor models. Error bars show standard deviation, PC3: n=7, PC3/2G7: n=7, MDA-MB-231: n=3, A431: n=6 and OHS: n=5.
Fig. 2
Fig. 2
HES stained sections of the different tumor models. Necrotic regions are seen either as pale areas or as white regions where dead cells are washed away during preparation.
Fig. 3
Fig. 3
In vivo μCT angiography of the tumor models. A and B show 3D renderings of the segmented tumor vasculature from representative MDA-MB-231 and OHS tumors, respectively. C: Vascular fraction of the entire tumor and D: vascular fraction in the rim (outer 1 mm) of the tumors. Each symbol represents one tumor, and the mean and SD are given for each tumor model. E: Distribution of blood vessels from the tumor surface and towards the core. For all tumors except OHS the majority of blood vessels was found in the periphery. F: Distribution of blood vessel diameters.
Fig. 4
Fig. 4
CEUS imaging of the 5 different tumor models. A: Representative time-intensity curves for whole tumor ROIs. B: Mean inflow times and C: mean outflow times for the microbubbles. Each symbol represents one tumor, and the mean and SD are given for each tumor model.
Fig. 5
Fig. 5
MRI data from the 5 tumor models. A–E: T2 weighted images (left) of the tumor outlined in red and T1-weighted image (right) 1 minute after injection of gadolinium contrast agent. Signal enhancement due to presence of the contrast agent can be seen mainly in the periphery of the carcinomas (A–D) and in most of the OHS sarcoma model (E). F: Mean signal enhancement curves for one tumor from each model. G: Fraction of voxels in the tumor that show more than 1.5 RSI after 1 minute. H: Median Ktrans of the enhancing tumor voxels. I: Median ADC values calculated from diffusion weighted MRI for 1mm thick tumor rim ROI. ** Indicates tumor groups significantly different from the others.
Fig. 6
Fig. 6
Fluorescence imaging of the 5 tumor models. Nuclei are stained blue (DAPI), blood vessels red (Texas red) and NPs green (yellow-green fluospheres). Left images show the entire tumor sections, right images are confocal images of selected areas.
Fig. 7
Fig. 7
Fluorescence image analysis of the 5 tumor models determining: A–C: amount of nanoparticle in the whole tumor, tumor periphery (outer 1mm) and tumor core. D: Area fraction of nuclei, E and F; blood vessel area fraction in the tumor periphery and core. Each datapoint represent one tumor and mean and standard deviation is shown.
Fig. 8
Fig. 8
Collagen content in the 5 tumor models imaged with SHG. A–E; representative images from the periphery of the tumors. F; area fraction (%) of collagen in the center and periphery of the various tumors. Error bars show standard deviation from 36 images/tumor type (periphery) and 12 images per tumor type (central part), * indicates values significantly different (p<0.05, one-way ANOVA) from the other models.
Fig. 9
Fig. 9
Plots of NP accumulation vs different parameters. Each datapoint represent one tumor except for J which shows mean and standard deviation from 6 sections in 2 tumors from each type. Spearman rank correlations are shown and was significant for NP vs Inflow time. A linear relation was found between NPs and blood vessel density.
Fig. 10
Fig. 10
Plots of A; Cell density vs ADC, B; FEV from DCE-MRI vs Tumor size, C; Extravascular and extracellular compartment from DCE-MRI vs ADC, D; Perfusion fraction from DCE-MRI vs FBV from μCT.

References

    1. Matsumura Y, Maeda H. A New Concept for Macromolecular Therapeutics in Cancer-Chemotherapy - Mechanism of Tumoritropic Accumulation of Proteins and the Antitumor Agent Smancs. Cancer Res. 1986;46:6387–6392. - PubMed
    1. Wicki A, Witzigmann D, Balasubramanian V, Huwyler J. Nanomedicine in cancer therapy: Challenges, opportunities, and clinical applications. J Controlled Release. 2015;200:138–157. - PubMed
    1. Wilhelm S, Tavares AJ, Dai Q, Ohta S, Audet J, Dvorak HF, Chan WCW. Analysis of nanoparticle delivery to tumours. Nat Rev Mater. 2016;1
    1. Torosean S, Flynn B, Axelsson J, Gunn J, Samkoe KS, Hasan T, Doyley MM, Pogue BW. Nanoparticle uptake in tumors is mediated by the interplay of vascular and collagen density with interstitial pressure. Nanomed-Nanotechnol. 2013;9:151–158. - PMC - PubMed
    1. Ekdawi SN, Jaffray DA, Allen C. Nanomedicine and tumor heterogeneity: Concept and complex reality. Nano Today. 2016;11:402–414.

Publication types

MeSH terms