Review
. 2018 May 7;150(5):653-669.
doi: 10.1085/jgp.201711978. Epub 2018 Apr 23.

Cryo-electron microscopy structures and progress toward a dynamic understanding of KATP channels

Affiliations
Review

Cryo-electron microscopy structures and progress toward a dynamic understanding of KATP channels

Michael C Puljung. J Gen Physiol. .

Abstract

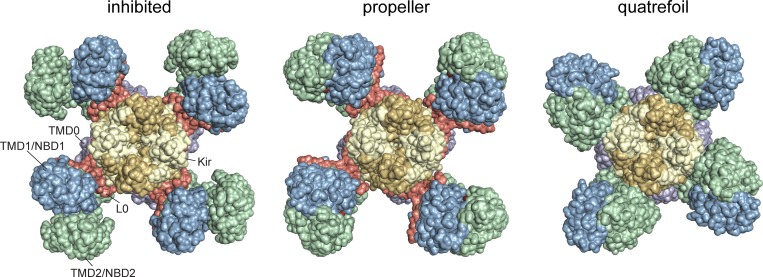
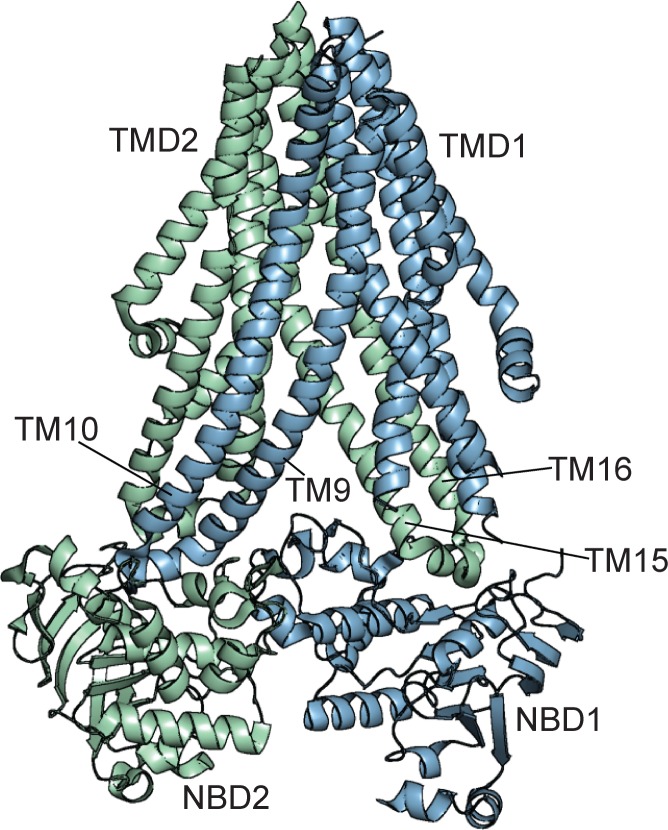
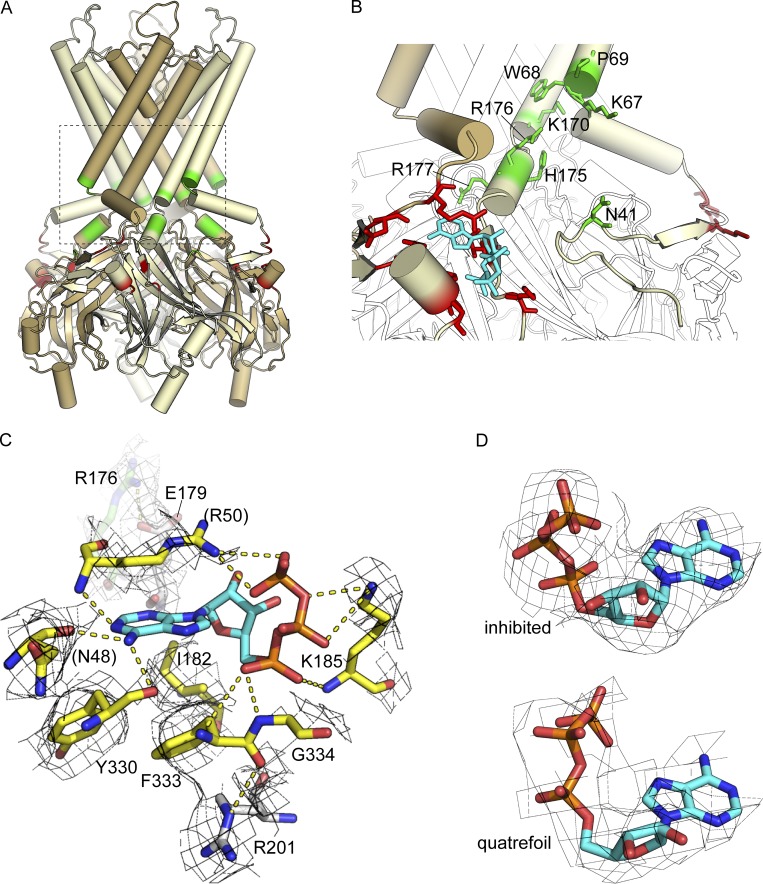
Adenosine triphosphate (ATP)-sensitive K+ (KATP) channels are molecular sensors of cell metabolism. These hetero-octameric channels, comprising four inward rectifier K+ channel subunits (Kir6.1 or Kir6.2) and four sulfonylurea receptor (SUR1 or SUR2A/B) subunits, detect metabolic changes via three classes of intracellular adenine nucleotide (ATP/ADP) binding site. One site, located on the Kir subunit, causes inhibition of the channel when ATP or ADP is bound. The other two sites, located on the SUR subunit, excite the channel when bound to Mg nucleotides. In pancreatic β cells, an increase in extracellular glucose causes a change in oxidative metabolism and thus turnover of adenine nucleotides in the cytoplasm. This leads to the closure of KATP channels, which depolarizes the plasma membrane and permits Ca2+ influx and insulin secretion. Many of the molecular details regarding the assembly of the KATP complex, and how changes in nucleotide concentrations affect gating, have recently been uncovered by several single-particle cryo-electron microscopy structures of the pancreatic KATP channel (Kir6.2/SUR1) at near-atomic resolution. Here, the author discusses the detailed picture of excitatory and inhibitory ligand binding to KATP that these structures present and suggests a possible mechanism by which channel activation may proceed from the ligand-binding domains of SUR to the channel pore.


Figures

Figure 1.
Figure 1.
Structure of KATP in the presence of ATP and glibenclamide. (A) Transmembrane topology of the pancreatic β cell KATP complex. For clarity, only two (of four) Kir6.2 subunits and one (of four) SUR1 subunits are shown. (B) Side view of the 3.63-Å structure of KATP (PDB accession no. 6BAA) in the presence of ATP and glibenclamide. For clarity, the pore domains of two of the Kir6.2 subunits have been removed, and only one SUR1 subunit is shown. Kir6.2 subunits are shown in yellow and brown. SUR1 is color-coded as follows: lavender, TMD0; orange, L0; blue, TMD1-NBD1; and green, TMD2-NBD2. The ochre blocks represent the approximate location of the lipid bilayer.
Figure 2.
Figure 2.
Modular gating scheme for KATP. The open–closed transition of the pore domain of KATP (symbolized by the equilibrium constant L) is energetically coupled to three classes of ligand-binding site: four inhibitory nucleotide (either ADP or ATP, symbolized as ANP) binding sites on Kir6.2 (equilibrium association constant KIB); four stimulatory PIP2 binding sites on Kir6.2 (equilibrium association constant KPIP); and four stimulatory MgANP sites formed by the dimerization of the NBDs of SUR1 (equilibrium association constant KNBD). C, D, and E are coupling factors describing the interaction between the PIP2 site, the inhibitory ANP site, and the NBDs with the channel pore, respectively.
Figure 3.
Figure 3.
Three structures of KATP. Surface representations of the entire KATP complex viewed from the cytoplasmic side (color-coded as in Fig. 1) in the SU-inhibited conformation (PDB accession no. 6BAA) and two structures with nucleotides bound to both the inhibitory Kir6.2 site and to the NBDs of SUR1: the propeller form (PDB accession no. 6C3P) and the quatrefoil form (PDB accession no. 6C3O).
Figure 4.
Figure 4.
The ABC core structure of SUR1. Structure of TMD1-NBD1–TMD2-NBD2 of SUR1 in the inhibited state (PDB accession no. 6BAA). TMD1-NBD1 is colored blue. TMD2-NBD2 is colored green. The domain-swapped helices (TM9–10 and TM15–16) are labeled.
Figure 5.
Figure 5.
The PIP2- and ATP-binding sites of Kir6.2. (A) Tetrameric structure of Kir6.2 (PDB accession no. 6BAA). Alternate subunits are colored yellow and brown. The inhibitory nucleotide binding site is colored red. Putative PIP2-binding residues are colored green. (B) Close-up view of the boxed region from A with putative PIP2-binding residues (green sticks) labeled. ATP is shown in cyan. ATP-binding residues are shown as red sticks. (C) Close-up view of the ATP-binding site. Residues that contact ATP directly are shown as yellow sticks. Amino acids in white are those previously identified as affecting the apparent affinity for ATP but that do not contribute directly to ATP binding in the structure. R176 from the putative PIP2 site is colored green. Residues in parentheses are contributed by the adjacent subunit (brown in B). The EM density shown for these residues was contoured at 1.5 σ. (D) EM density (contoured at 3 σ) for ATP bound to Kir6.2 in the inhibited structure (PDB accession no. 6BAA, top) and quatrefoil structure (PDB accession no. 6C3O, bottom).
Figure 6.
Figure 6.
Interactions between TMD0-L0 and the cytoplasmic domains of Kir6.2. Interface between the ATP-binding site on Kir6.2 and TMD0/L0 of SUR1. Kir6.2-Q52 and SUR1-E203 are shown as sticks and are separated by <5 Å.
Figure 7.
Figure 7.
MgATP and MgADP bound at the interface of NBD1 and NBD2 of SUR1. NBD dimer from the quatrefoil structure in Lee et al. (2017) (PDB accession no. 6C3O). The two NBSs (NBS1 and NBS2) are formed at the interface of the NBDs. MgATP is bound to NBS1, and MgADP is bound to NBS2. Important nucleotide-binding motifs are highlighted. A loops (orange) interact with the purine ring of ATP/ADP via π-stacking interactions (W688 in NBS1 and Y1353 in NBS2). WalkerA and WalkerB motifs are shown in red. WalkerA lysines (K719 and K1384) and acidic residues from the WalkerB motifs (D853, D854, D1505, and E1506) are shown as sticks. The ABC signature sequences are shown in magenta.
Figure 8.
Figure 8.
The glibenclamide binding site. (A) SU-inhibited SUR1 structure (PDB accession no. 6BAA) showing only TMD1-NBD1 and TMD2-NBD2. Glibenclamide is depicted as magenta spheres. (B) Surface representation of the glibenclamide binding pocket in the SU-inhibited structure (PDB accession no. 6BAA) and the same region from the partially activated propeller structure (PDB accession no. 6C3P). The structure of glibenclamide from PDB accession no. 6BAA is shown in both. The two structures were aligned at TMD1. (C) Glibenclamide-interacting residues. The panel on the left shows only the portion of the glibenclamide site contributed by TMD1, and the panel on the right (rotated 180°) shows only the interactions between TMD2 and glibenclamide.
Figure 9.
Figure 9.
SUR1 is not a transporter. Top: Structure of the ABC transporter Sav1866 bound to ADP (PDB accession no. 2HYD) adopting an outward-facing conformation. Bottom: Structure of the ABC core of SUR1 bound to MgATP and MgADP (quatrefoil form, PDB accession no. 6C3O).
Figure 10.
Figure 10.
Conformational differences in Kir6.2 between inhibited and partially activated states. (A) Two (of four) pore domains and slide helices of Kir6.2 (residues 51–179) from the SU-inhibited structure (yellow, PDB accession no. 6BAA), the propeller form (light cyan, PDB accession no. 6C3P), and the quatrefoil form (magenta, PDB accession no. 6C3O) of KATP. F168 is shown as spheres to mark the bundle-crossing gate. (B) Rotation of the cytoplasmic domain of Kir6.2 between the SU-inhibited structure (yellow) and the quatrefoil form (magenta). Spheres mark the location of the α-carbons of residues D323 (outer ring) and D350 (inner ring). (C) Selectivity filter structures (only showing two diagonally opposed subunits) of the inhibited state (PDB accession no. 6BAA), the propeller form (PDB accession no. 6C3P), and the quatrefoil form (PDB accession no. 6C3O). The density within the pore of each has been contoured at 5 σ and shows the potential location of K+ ions.
Figure 11.
Figure 11.
Nucleotide-dependent conformational change in SUR1. Top, from left: Structure of SUR1 (residues 195–1,581, L0-TMD1-NBD1-TMD2-NBD2) in the SU-inhibited form (PDB accession no. 6BAA), putative apo state of SUR1 based on the structure of TM287/288 (PDB accession no. 4Q4H), activated state of SUR1 in the propeller form (PDB accession no. 6C3P), and activated state of SUR1 in the quatrefoil form (PDB accession no. 6C3O). Bottom: Conformational differences in the NBDs of the above structures. MgATP/ADP are shown as spheres.
Figure 12.
Figure 12.
Putative conformational changes in the KATP complex upon SUR1 activation. Cartoon representation showing the transition from the inhibited state of KATP through the propeller form to the quatrefoil form. In the inhibited form, the NBDs are out of alignment and spaced far apart. In the presence of Mg2+ and nucleotides, the NBDs first dimerize (propeller form), but the overall conformation of the complex remains unaffected. In the quatrefoil form, the dimerized NBDs rotate (along with TMD1 and TMD2) such that a new interface is formed between NBD2 and the cytoplasmic domain of Kir6.2. The interface between TMD0 and Kir6.2 remains largely unaffected.
Figure 13.
Figure 13.
New interfaces formed in the quatrefoil structure (PDB accession no. 6C3O). (A) Potential polar contacts between NBD2 (green) and Kir6.2 (yellow) shown as sticks. MgADP is shown as cyan spheres. The EM density for the residues at the interface has been contoured at 3 σ. (B) Putative interface formed between TMD0 and TMD2 in the quatrefoil structure. On the left, helices TMD3 and TM15 are in the foreground. The image on the right is rotated 160° to show interactions between TM16 and TM2.

References

    1. Aguilar-Bryan L., Nichols C.G., Wechsler S.W., Clement J.P. IV, Boyd A.E. III, González G., Herrera-Sosa H., Nguy K., Bryan J., and Nelson D.A.. 1995. Cloning of the beta cell high-affinity sulfonylurea receptor: a regulator of insulin secretion. Science. 268:423–426. 10.1126/science.7716547 - DOI - PubMed
    1. Ämmälä C., Bokvist K., Galt S., and Rorsman P.. 1991. Inhibition of ATP-regulated K(+)-channels by a photoactivatable ATP-analogue in mouse pancreatic beta-cells. Biochim. Biophys. Acta. 1092:347–349. 10.1016/S0167-4889(97)90011-2 - DOI - PubMed
    1. Antcliff J.F., Haider S., Proks P., Sansom M.S., and Ashcroft F.M.. 2005. Functional analysis of a structural model of the ATP-binding site of the KATP channel Kir6.2 subunit. EMBO J. 24:229–239. 10.1038/sj.emboj.7600487 - DOI - PMC - PubMed
    1. Arkhammar P., Nilsson T., Rorsman P., and Berggren P.O.. 1987. Inhibition of ATP-regulated K+ channels precedes depolarization-induced increase in cytoplasmic free Ca2+ concentration in pancreatic beta-cells. J. Biol. Chem. 262:5448–5454. - PubMed
    1. Ashcroft F.M., Harrison D.E., and Ashcroft S.J.. 1984. Glucose induces closure of single potassium channels in isolated rat pancreatic beta-cells. Nature. 312:446–448. 10.1038/312446a0 - DOI - PubMed

Publication types

MeSH terms