. 2018 Jun 21;86(7):e00060-18.
doi: 10.1128/IAI.00060-18. Print 2018 Jul.

Gut Microbiome Analysis Identifies Potential Etiological Factors in Acute Gastroenteritis

Affiliations

Gut Microbiome Analysis Identifies Potential Etiological Factors in Acute Gastroenteritis

Natalia Castaño-Rodríguez et al. Infect Immun. .

Abstract

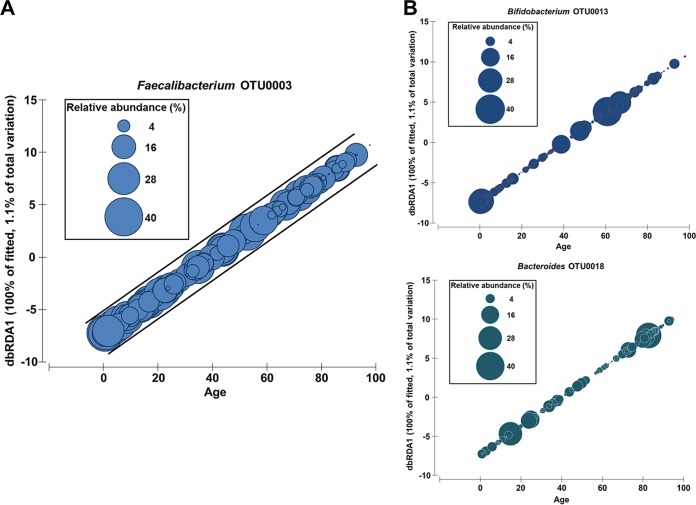
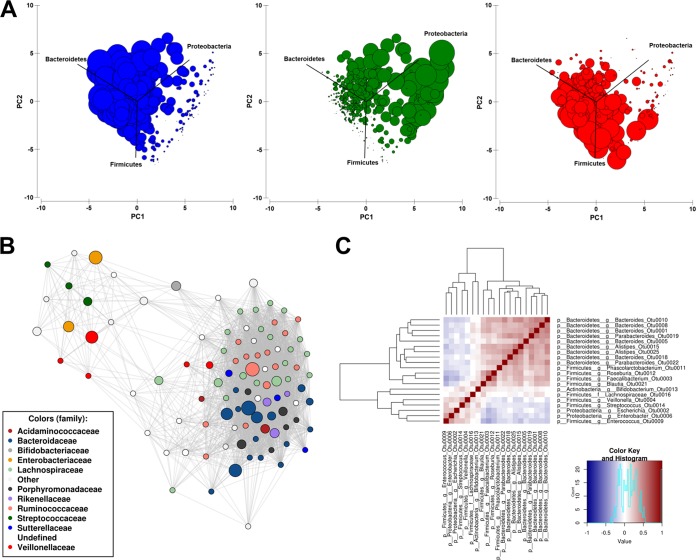
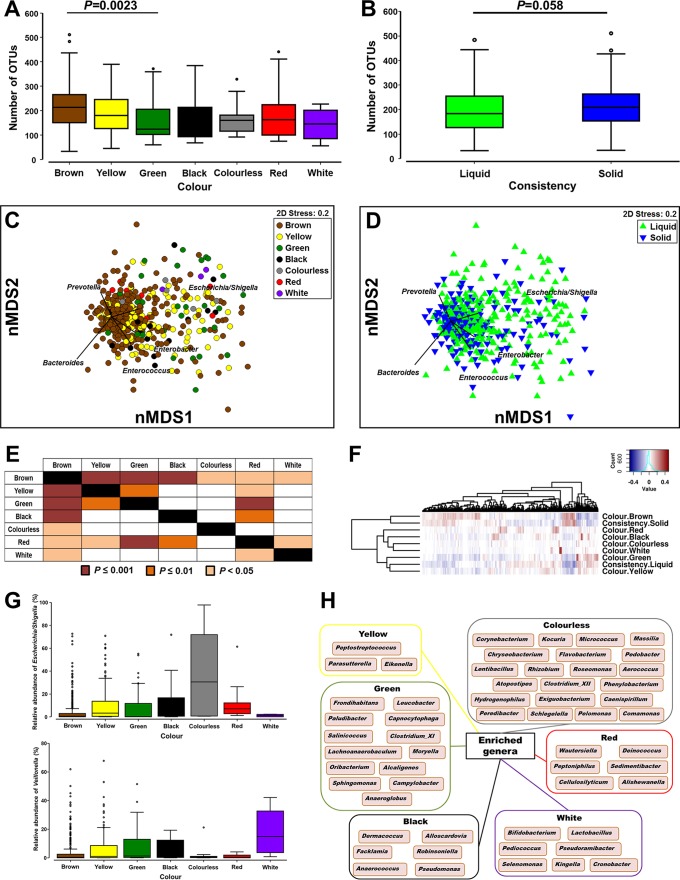
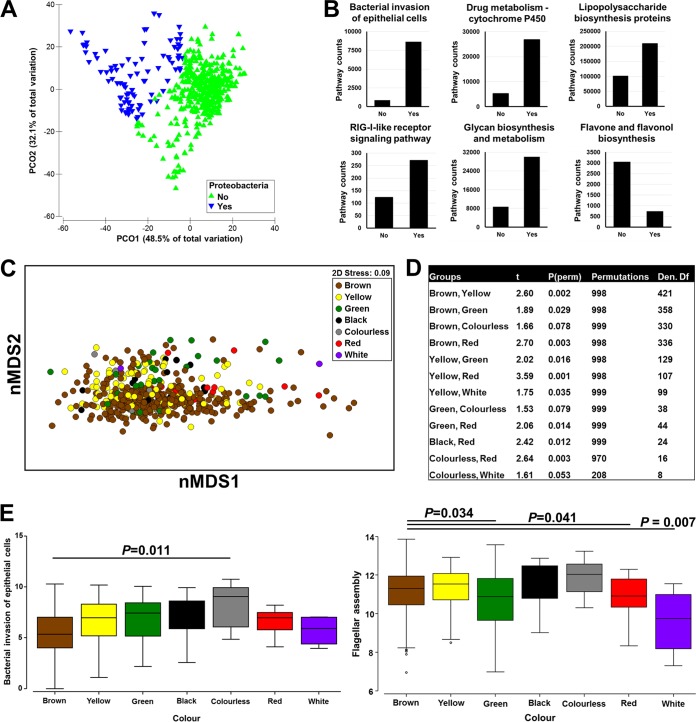
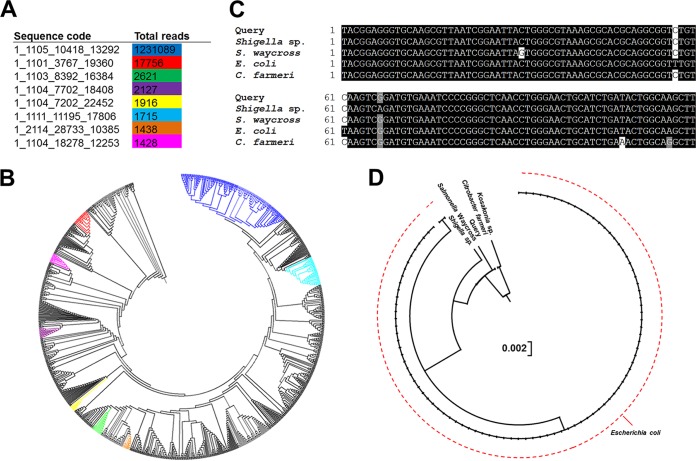
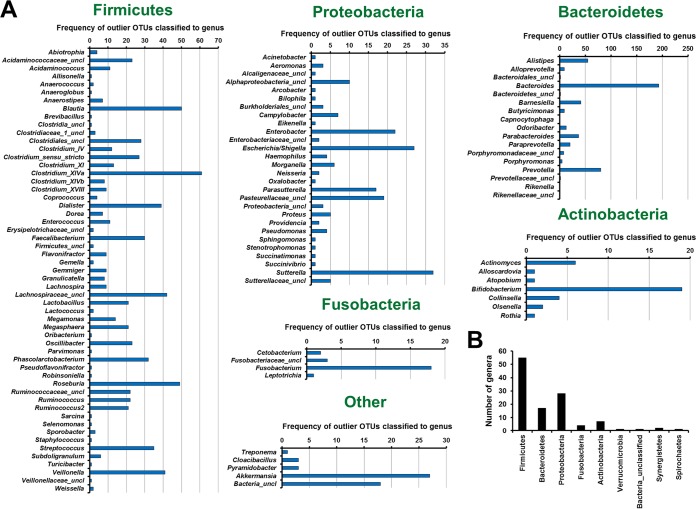
The morbidity and mortality resulting from acute gastroenteritis and associated chronic sequelae represent a substantial burden on health care systems worldwide. Few studies have investigated changes in the gut microbiome following an episode of acute gastroenteritis. By using nondirected 16S rRNA gene amplicon sequencing, the fecal microbiota of 475 patients with acute gastroenteritis was examined. Patient age was correlated with the overall microbial composition, with a decrease in the abundance of Faecalibacterium being observed in older patients. We observed the emergence of a potential Escherichia-Shigella-dominated enterotype in a subset of patients, and this enterotype was predicted to be more proinflammatory than the other common enterotypes, with the latter being dominated by Bacteroides or Faecalibacterium The increased abundance of Escherichia-Shigella did not appear to be associated with infection with an agent of a similar sequence similarity. Stool color and consistency were associated with the diversity and composition of the microbiome, with deviations from the norm (not brown and solid) showing increases in the abundances of bacteria such as Escherichia-Shigella and Veillonella Analysis of enriched outliers within the data identified a range of genera previously associated with gastrointestinal diseases, including Treponema, Proteus, Capnocytophaga, Arcobacter, Campylobacter, Haemophilus, Aeromonas, and Pseudomonas Our data represent the first in-depth analysis of gut microbiota in acute gastroenteritis. Phenotypic changes in stool color and consistency were associated with specific changes in the microbiota. Enriched bacterial taxa were detected in cases where no causative agent was identified by using routine diagnostic tests, suggesting that in the future, microbiome analyses may be utilized to improve diagnostics.

Keywords: Escherichia coli; acute gastroenteritis; enterotype; gut; microbiota; pathogenesis.


Figures

FIG 1
FIG 1
Relationship between the gut microbiota and patient age. (A) Faecalibacterium OTU0003 was significantly correlated with age, showing a decrease in the relative abundance with increasing age. Graphs are distance-based redundancy analysis (dbRDA) plots of coordinate scores against age. The sizes of the circles represent the relative abundances (4 to 40%) of the OTUs of interest within each patient. DistLM analysis between the Euclidean distance matrix of patient ages and relative abundances of microbial taxa was performed. (B) Bifidobacterium OTU0013 and Bacteroides OTU0018 were also found to be significantly correlated with age. The sizes of the circles represent the relative abundances (percent) of the OTUs of interest within each patient.
FIG 2
FIG 2
Composition of the gut microbiota in cases of acute gastroenteritis. (A) Principal-component analysis of square-root-transformed relative abundances showing samples clustering into three possible enterotypes, dominated by Bacteroidetes (Bacteroides OTU0001) (blue), Proteobacteria (Escherichia-Shigella OTU0002) (green), or Firmicutes (Faecalibacterium OTU0003) (red). The sizes of the circles represent the relative abundances (percent) of OTUs within each patient. (B) Network analysis (ensemble between Spearman and Pearson correlations) showing Bacteroidaceae, Rikenellaceae, Lachnospiraceae, and Ruminococcaceae forming a distinct cluster that can be differentiated from a cluster of Enterobacteriaceae, Veillonellaceae, and Streptococcaceae. (C) Heat map of correlations across the top 20 OTUs confirms the relationships observed in the network analysis.
FIG 3
FIG 3
Microbial diversity across colors and consistencies of fecal samples. (A and B) Changes in species richness (number of OTUs) across stool color (A) and consistency (B). (C and D) Nonmetric multidimensional scaling plots on Bray-Curtis resemblances of square-root-transformed relative abundances across stool color (C) and consistency (D). (E) Results of PERMANOVA following Bray-Curtis resemblance analysis of square-root-transformed relative abundances across colors of fecal samples. (F) Analysis of hierarchal clustering across different variables within sample colors and consistencies. (G) Box plot of relative abundances (percent) of Escherichia-Shigella and Veillonella across colors of samples. (H) Microbial genera found to be enriched by LEfSe analysis and unique for stool of a specific color following comparison with brown fecal samples.
FIG 4
FIG 4
Predicted bacterial metabolic contributions. (A) Principal-coordinate analysis of the Bray-Curtis resemblance matrix of square-root-transformed relative abundances. Samples were separated into two groups according to their levels of Proteobacteria, with a relative abundance of 25% being used as a cutoff. (B) KEGG pathways (level 3) significantly different between the two groups (Yes, high abundance of Proteobacteria; No, low abundance of Proteobacteria). Only pathways that had relatively high counts and a high fold change were plotted. (C) nMDS plot of log-transformed pathway (KEGG level 3) counts across colors of fecal samples. (D) PERMANOVA following Bray-Curtis resemblance of log-transformed pathway (KEGG level 3) counts. Only comparisons that were significant or close to significant are shown. (E) Box plot of PICRUSt counts across colors of samples. The two pathways “bacterial invasion of epithelial cells” and “flagellar assembly” are shown. P values were generated by analysis of variance with Tukey's multiple-comparison test.
FIG 5
FIG 5
Analysis of sequences belonging to Escherichia-Shigella. (A) Total numbers of reads of the top eight most abundant unique sequences classified as Escherichia-Shigella following classification at 100% similarity and not 97% similarity. Only sequences with >1,000 reads are included. Sequence codes correspond to the sequence names in the raw data, given that these are unique sequences. (B) Phylogenetic analysis (Clear-cut) of all unique sequences classified as Escherichia-Shigella and branch locations of the top eight sequences within the tree. The color coding in the tree corresponds to the colors in the table in panel A. (C) Sequence alignment of the second most abundant Escherichia-Shigella sequence (1_1101_3767_19360) (red) with the sequences of other microbial taxa within the Gammaproteobacteria. (D) Phylogenetic analysis of the second most abundant Escherichia-Shigella sequence (1_1101_3767_19360) relative to other microbial taxa within the Gammaproteobacteria. Salmonella Waycross, Salmonella enterica serovar Waycross.
FIG 6
FIG 6
Analysis to identify outlier bacterial taxa within individual patients. Abundances of OTUs within individual samples were analyzed, and those that satisfied three criteria, (i) a relative abundance of >3%, (ii) a relative abundance higher than two standard deviations above the mean for all samples, and (iii) a relative abundance higher than the upper fence of a box plot, were considered outliers. Only the first 900 OTUs were included in this analysis. (A) Frequency of OTUs identified as outliers according to classification at the genus level. uncl, unclassified. (B) Total number of genera that contain outlier OTUs per phylum.

References

    1. World Health Organization. 2017. Diarrhoeal disease. World Health Organization, Geneva, Switzerland: http://www.who.int/mediacentre/factsheets/fs330/en/ Accessed 28 October 2017.
    1. Kaakoush NO, Castaño-Rodríguez N, Mitchell HM, Man SM. 2015. Global epidemiology of Campylobacter infection. Clin Microbiol Rev 28:687–720. doi: 10.1128/CMR.00006-15. - DOI - PMC - PubMed
    1. Lupp C, Robertson ML, Wickham ME, Sekirov I, Champion OL, Gaynor EC, Finlay BB. 2007. Host-mediated inflammation disrupts the intestinal microbiota and promotes the overgrowth of Enterobacteriaceae. Cell Host Microbe 2:204. doi: 10.1016/j.chom.2007.08.002. - DOI - PubMed
    1. Kamdar K, Khakpour S, Chen J, Leone V, Brulc J, Mangatu T, Antonopoulos DA, Chang EB, Kahn SA, Kirschner BS, Young G, DePaolo RW. 2016. Genetic and metabolic signals during acute enteric bacterial infection alter the microbiota and drive progression to chronic inflammatory disease. Cell Host Microbe 19:21–31. doi: 10.1016/j.chom.2015.12.006. - DOI - PMC - PubMed
    1. Arumugam M, Raes J, Pelletier E, Le Paslier D, Yamada T, Mende DR, Fernandes GR, Tap J, Bruls T, Batto JM, Bertalan M, Borruel N, Casellas F, Fernandez L, Gautier L, Hansen T, Hattori M, Hayashi T, Kleerebezem M, Kurokawa K, Leclerc M, Levenez F, Manichanh C, Nielsen HB, Nielsen T, Pons N, Poulain J, Qin J, Sicheritz-Ponten T, Tims S, Torrents D, Ugarte E, Zoetendal EG, Wang J, Guarner F, Pedersen O, de Vos WM, Brunak S, Doré J, MetaHIT Consortium, Antolín M, Artiguenave F, Blottiere HM, Almeida M, Brechot C, Cara C, Chervaux C, Cultrone A, Delorme C, Denariaz G, et al. 2011. Enterotypes of the human gut microbiome. Nature 473:174–180. doi: 10.1038/nature09944. - DOI - PMC - PubMed

Publication types

LinkOut - more resources