. 2018 Jun;177(2):565-593.
doi: 10.1104/pp.17.01711. Epub 2018 Apr 23.

RAPTOR Controls Developmental Growth Transitions by Altering the Hormonal and Metabolic Balance

Affiliations

RAPTOR Controls Developmental Growth Transitions by Altering the Hormonal and Metabolic Balance

Mohamed A Salem et al. Plant Physiol. 2018 Jun.

Abstract

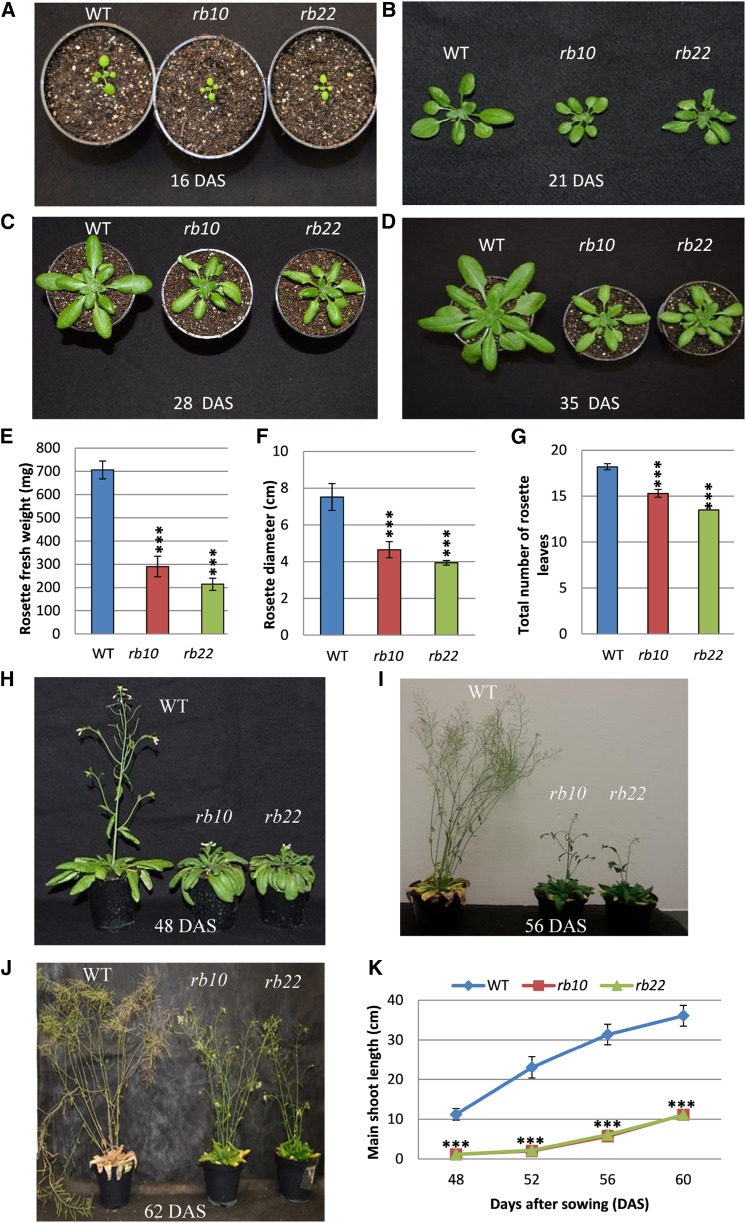
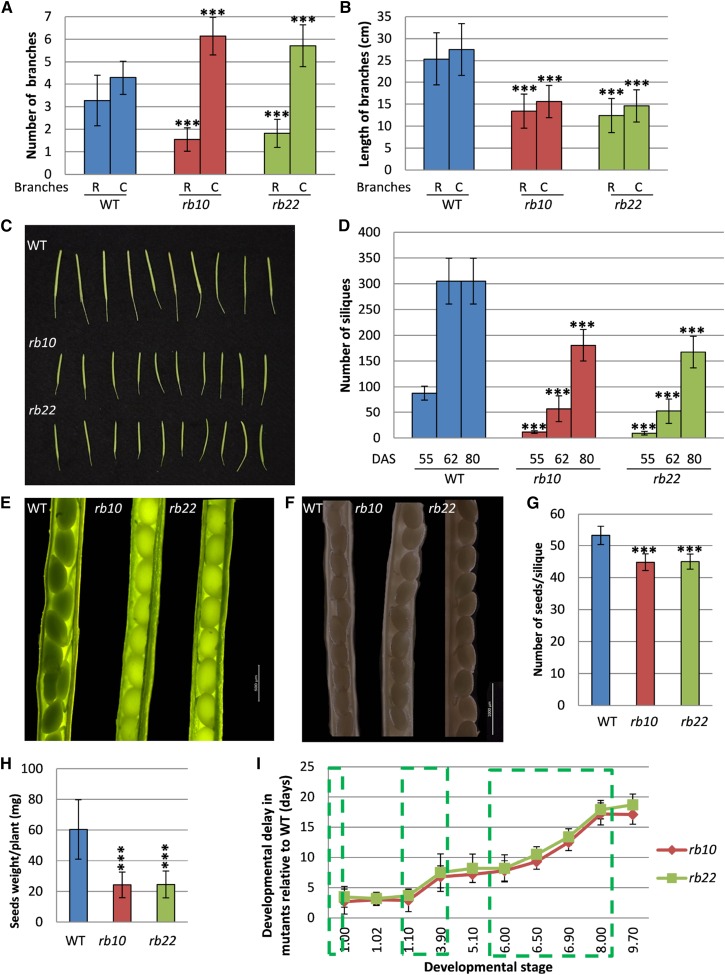
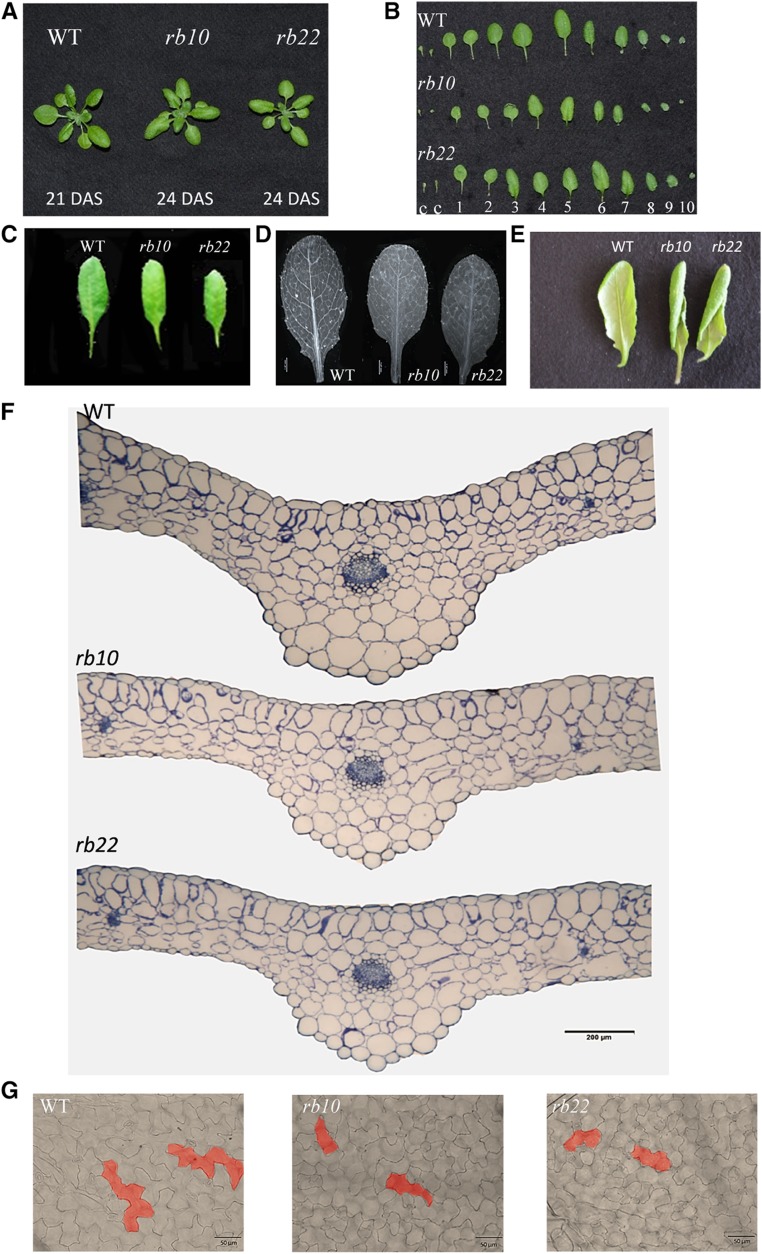
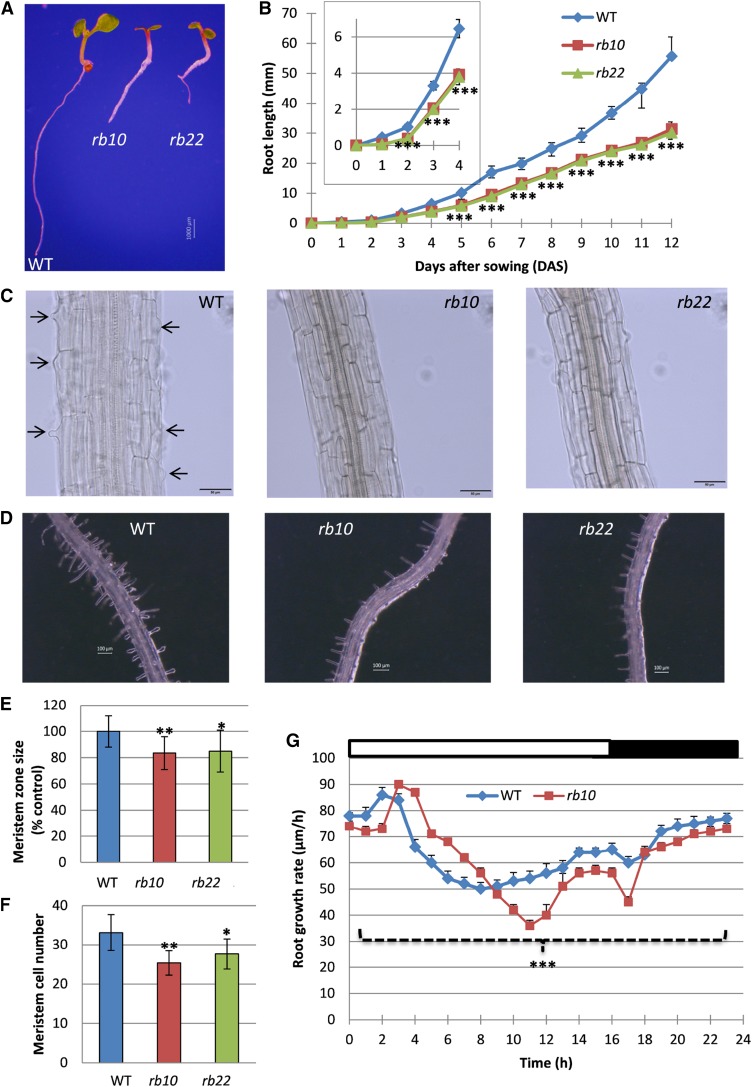
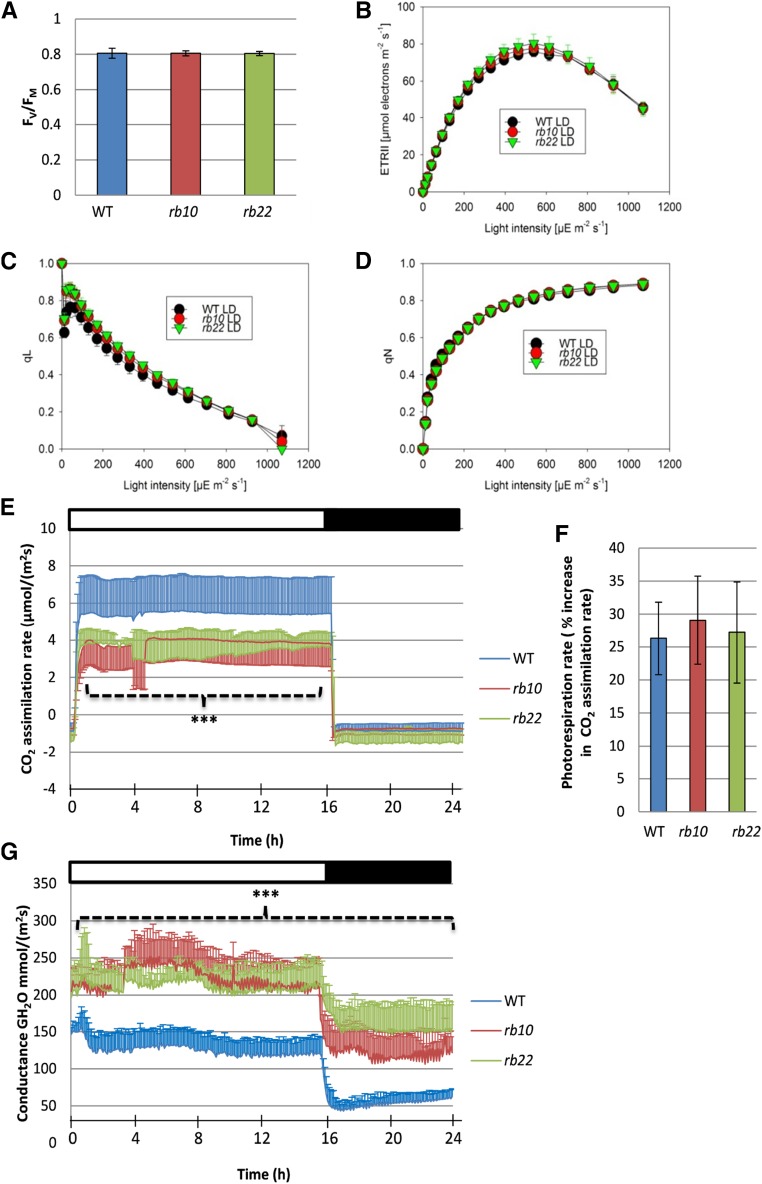
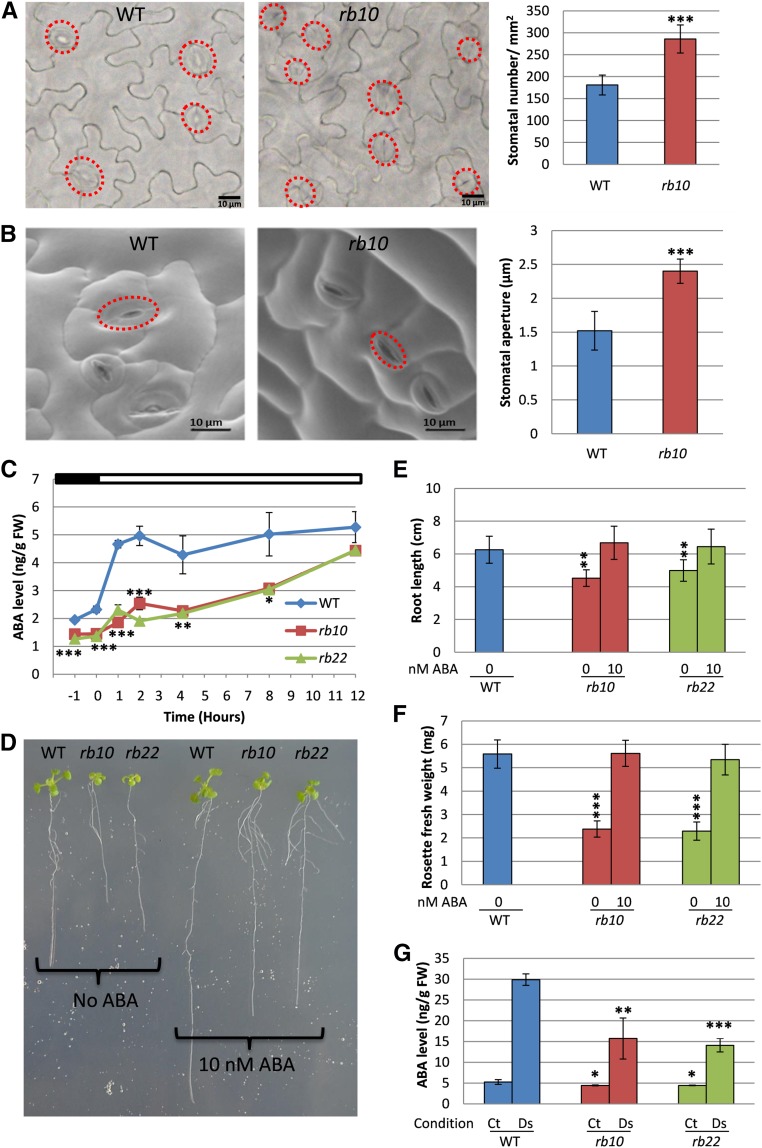
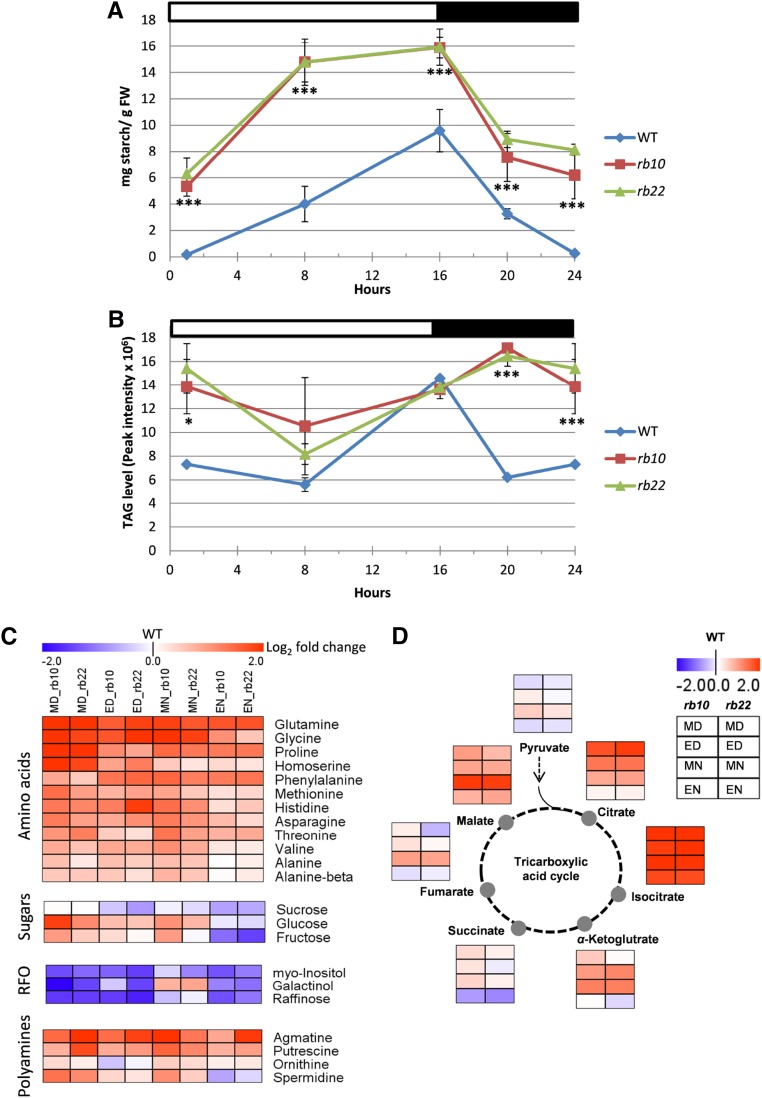
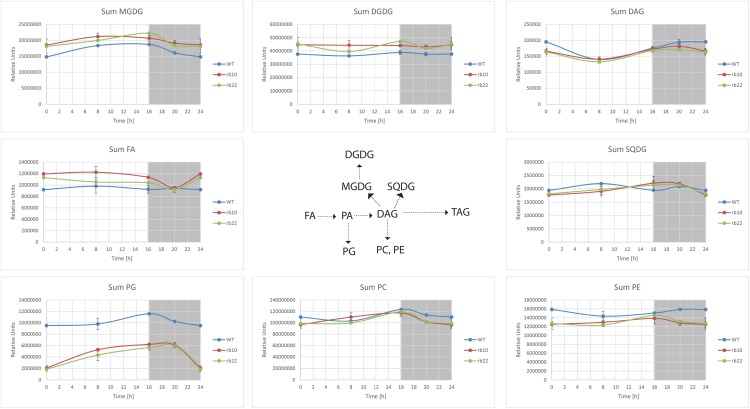
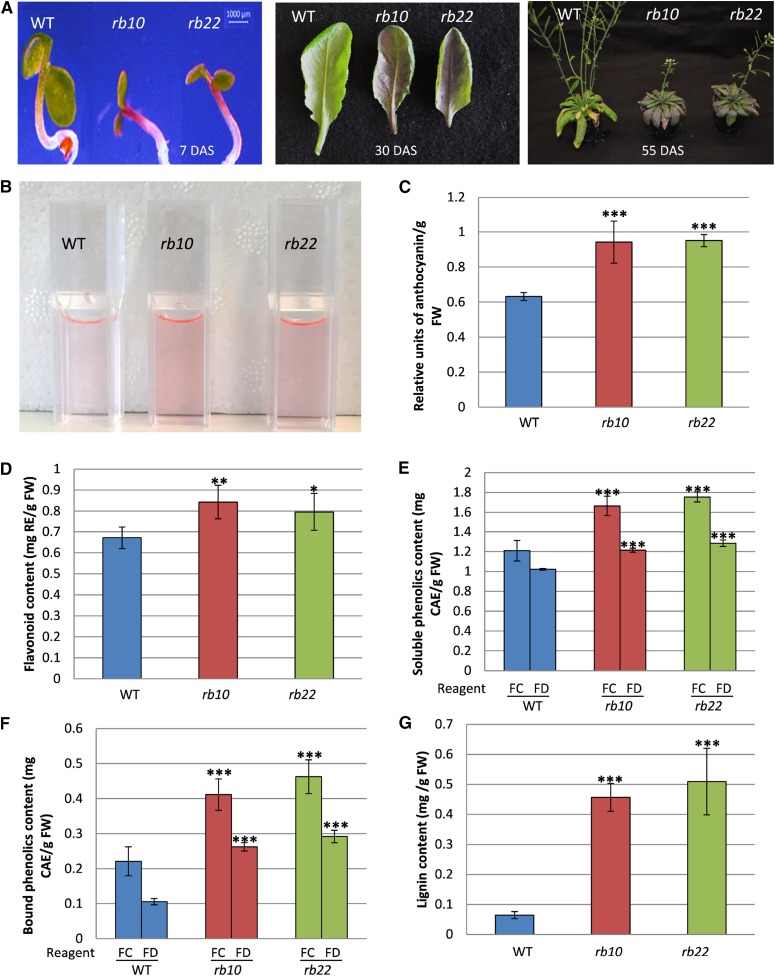
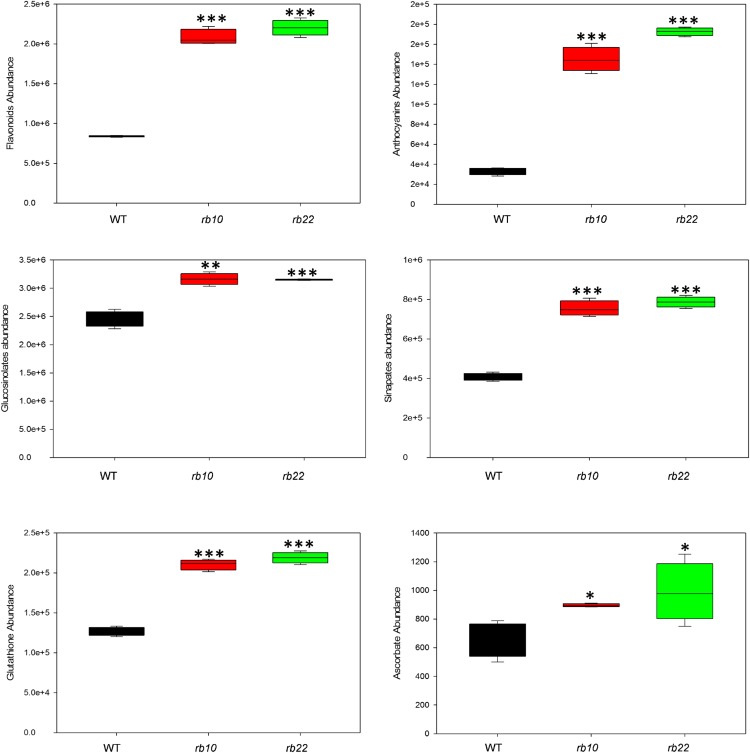
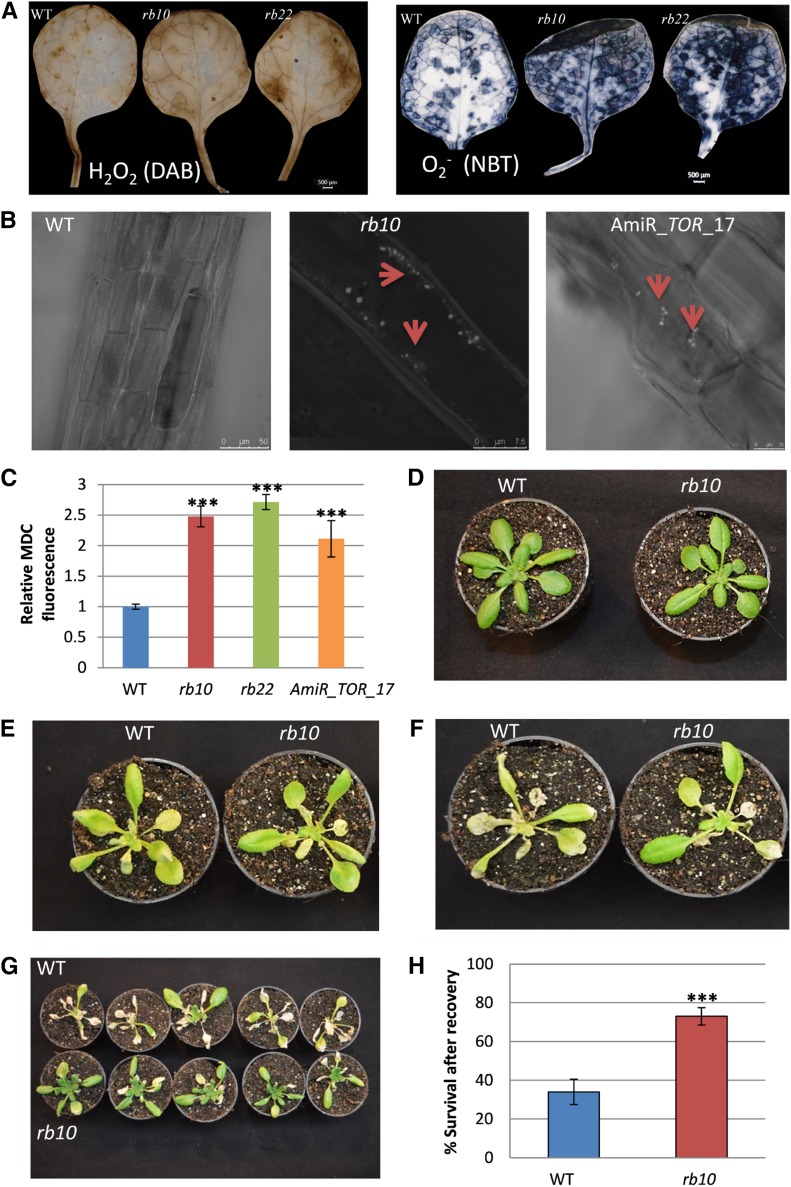
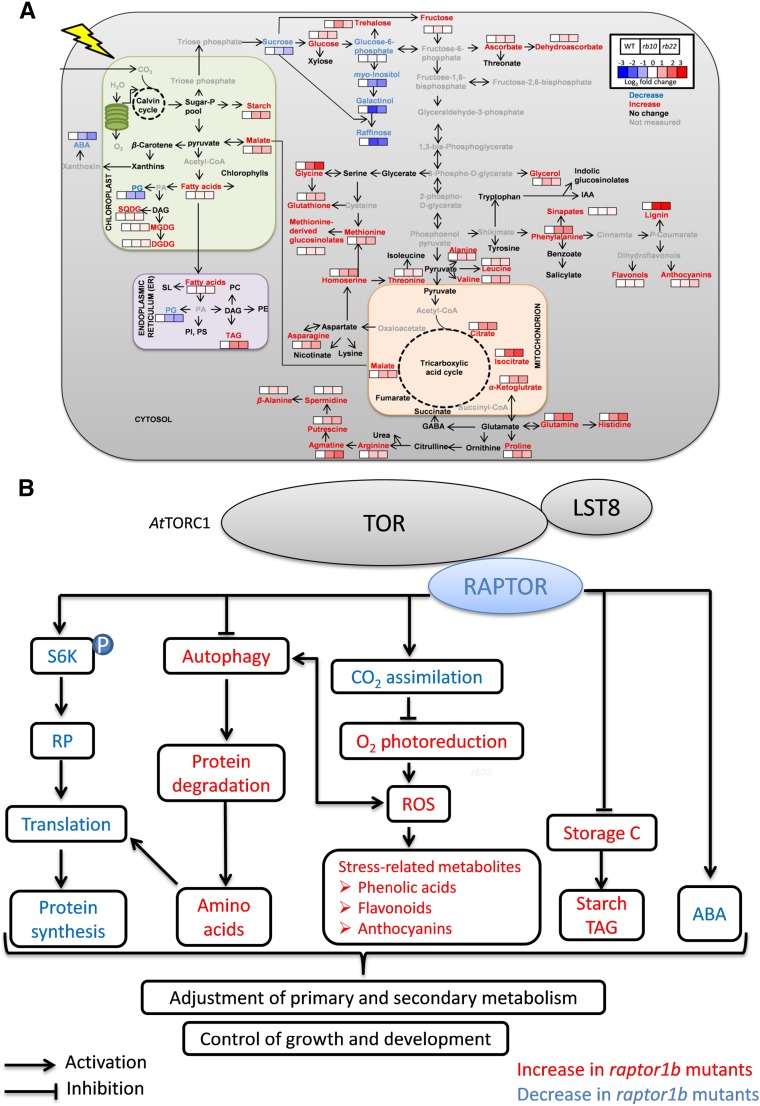
Vegetative growth requires the systemic coordination of numerous cellular processes, which are controlled by regulatory proteins that monitor extracellular and intracellular cues and translate them into growth decisions. In eukaryotes, one of the central factors regulating growth is the serine/threonine protein kinase Target of Rapamycin (TOR), which forms complexes with regulatory proteins. To understand the function of one such regulatory protein, Regulatory-Associated Protein of TOR 1B (RAPTOR1B), in plants, we analyzed the effect of raptor1b mutations on growth and physiology in Arabidopsis (Arabidopsis thaliana) by detailed phenotyping, metabolomic, lipidomic, and proteomic analyses. Mutation of RAPTOR1B resulted in a strong reduction of TOR kinase activity, leading to massive changes in central carbon and nitrogen metabolism, accumulation of excess starch, and induction of autophagy. These shifts led to a significant reduction of plant growth that occurred nonlinearly during developmental stage transitions. This phenotype was accompanied by changes in cell morphology and tissue anatomy. In contrast to previous studies in rice (Oryza sativa), we found that the Arabidopsis raptor1b mutation did not affect chloroplast development or photosynthetic electron transport efficiency; however, it resulted in decreased CO2 assimilation rate and increased stomatal conductance. The raptor1b mutants also had reduced abscisic acid levels. Surprisingly, abscisic acid feeding experiments resulted in partial complementation of the growth phenotypes, indicating the tight interaction between TOR function and hormone synthesis and signaling in plants.


Figures

Figure 1.
Figure 1.
Vegetative and reproductive growth phenotypes of Col-0 and two independent raptor1b mutants. A to D, Delayed and reduced vegetative growth phenotypes of raptor1b (rb10 and rb22) for seeds grown on soil at 16 d after sowing (DAS; A), 21 DAS (B), 28 DAS (C), and 35 DAS (D). Col-0 was used as the wild type (WT). E to G, Rosette biomass (E), rosette diameter (F), and number of rosette leaves (G) of raptor1b compared with wild-type plants grown under LD conditions at 28 DAS. H to J, Reproductive growth phenotypes for wild-type and raptor1b plants grown on soil at 48 DAS (H), 56 DAS (I), and 62 DAS (J). K, Main shoot length of raptor1b compared with the wild type at different time points after sowing. Data represent means ± sd for 20 biological replicates from at least two independent experiments. Asterisks indicate significant differences from the wild type under the same condition (***, P < 0.001, Student’s t test).
Figure 2.
Figure 2.
Defective reproductive growth of raptor1b. A, Shoot branching of raptor1b mutants compared with wild-type (WT) plants at 80 DAS. B, Shoot length of raptor1b compared with wild-type plants at 80 DAS. C, Cauline branches; R, rosette branches. C, Siliques of raptor1b compared with the wild type. D, Number of siliques of raptor1b at 55 to 80 DAS. E and F, Seeds of raptor1b from young (E) and mature (F) siliques. Bars = 500 and 1,000 µm for green and mature siliques, respectively. G, Number of seeds per silique in raptor1b. H, Seed yield in raptor1b. I, Delayed growth of raptor1b. A stepwise delay is seen in different growth stages of raptor1b relative to the wild type. Green boxes mark delay increases during different stages of growth, as defined in Supplemental Figure S1D. Data represent means ± sd for 20 biological replicates from at least two independent experiments. Asterisks indicate significant differences from the wild type under the same condition (***, P < 0.001, Student’s t test).
Figure 3.
Figure 3.
Analysis of the reduced leaf growth phenotype in raptor1b. A, Developmental stage- and size-matched rosettes of the wild type (WT) and raptor1b at the 10-rosette-leaves stage. B, Individual leaves of raptor1b compared with the wild type from developmentally matched rosettes (10 rosette leaves). Two cotyledons (c) and true leaves are numbered in order of their emergence. C, Comparison of the same leaf (leaf 5) of raptor1b and the wild type at the same developmental stage (10 rosette leaves). D, Reduced vein-density phenotype in raptor1b compared with the wild type. Bar = 1.47 mm. E, Leaf-curling phenotype in raptor1b. The abaxial side of leaves shows the start of curling. F, Cross sections of leaves of the wild type and raptor1b stained with Toluidine Blue. Bar = 200 µm. G, More-and-smaller-cells phenotype in adaxial epidermal cells of raptor1b. Bars = 50 µm. Leaf sections and cell size analyses were done on rosette leaf 5 at the same developmental stage of producing 10 rosette leaves.
Figure 4.
Figure 4.
Root phenotypes of raptor1b. A, Seedlings of raptor1b and the wild type (WT) grown on 0.5× Murashige and Skoog (0.5× MS) agar plates at 7 DAS. Bar = 1,000 µm. B, Primary root length of raptor1b. Root length was monitored from seedlings grown on 0.5× MS agar plates for 12 DAS. The inset shows root length for 0 to 4 DAS. C, Delayed initiation of root hairs of raptor1b at 7 DAS. Black arrows indicate the initiation of root hairs in the wild type. Bars = 50 µm. D, Root hair growth of raptor1b compared with the wild type at 12 DAS. Bars = 100 µm. E and F, Meristem zone size (E) and meristem cell number (F) of raptor1b at 12 DAS. G, Root growth rate of the wild type and raptor1b. Root elongation was measured continuously over a period of 10 d for seedlings grown on 0.5× MS agar plates. White and black bars on the top indicate light and dark periods, respectively. Data represent means ± sd for 20 biological replicates for B, E, and F and for six biological replicates for G. Asterisks indicate significant differences between the wild type and raptor1b under the same condition (*, P < 0.05; **, P < 0.01; and ***, P < 0.001, Student’s t test). The 0-d time point in B refers to seeds that were imbibed for 3 d at 4°C.
Figure 5.
Figure 5.
Photosynthetic efficiency and gas-exchange measurements of the wild type (WT) and raptor1b. A, Fv/Fm of wild-type and raptor1b leaves. B to D, Light-response curves of linear ETR (B), qL (C), and qN (D) of the wild type and raptor1b. E, Net CO2 assimilation rate of raptor1b compared with the wild type. F, Assimilation rate under nonphotorespiratory conditions of the wild type and raptor1b. G, Stomatal conductance of raptor1b compared with the wild type. Measurements were performed on rosette leaves from soil-grown plants at the same developmental stage under LD conditions. Plants were dark adapted for 30 min before the commencement of chlorophyll fluorescence imaging at the beginning of the day, 1 h after illumination. Data represent means ± sd for five biological replicates. Asterisks indicate significant differences from the wild type under the same condition (***, P < 0.001, Student’s t test). White and black bars on the top of the graphs in E and G indicate light and dark periods, respectively.
Figure 6.
Figure 6.
raptor1b shows phenotypes of abscisic acid (ABA) deficiency. A and B, Stomatal number (A) and stomatal aperture size (B) in raptor1b. C, Changes in ABA level in raptor1b compared with the wild type (WT) before and after illumination. D to F, Exogenous application of ABA on raptor1b. D, Seedlings of raptor1b treated with ABA and grown for the same time as wild-type seedlings without ABA. E and F, Effects of ABA treatment on raptor1b root growth defect (E) and rosette biomass (F). G, Effects of drought stress on ABA in raptor1b. Samples were harvested 12 h after illumination from nontreated plants (control [Ct]) and after induction of drought stress (Ds) for 6 d. Microscopic analysis was performed on rosette leaf 5 from the wild type and raptor1b at the same developmental stage (10 rosette leaves) from plants that were grown on soil under LD growth conditions. At least 200 and 50 stomata were analyzed for stomatal number and stomatal aperture size, respectively. Red circles in A and B indicate positions of stomata. For ABA extraction, the rosettes of raptor1b and the wild type were harvested at the same developmental stage (10 rosette leaves) from plants cultivated on soil under normal-light LD growth conditions. The first time point (‒1) represents samples that were harvested 1 h before illumination, while 0 h represents samples harvested just before illumination. The time points 1, 2, 4, 8, and 12 h represent samples that were harvested in the light period at 1, 2, 4, 8, and 12 h after the onset of illumination, respectively. Data represent means ± sd for five biological replicates. Asterisks indicate significant differences between the wild type and raptor1b under the same condition (*, P < 0.05; **, P < 0.01; and ***, P < 0.001, Student’s t test). White and black bars on the top of the graph in C indicate light and dark periods, respectively. FW, Fresh weight.
Figure 7.
Figure 7.
Influence of raptor1b mutation on carbon storage and primary metabolites. A, and B, Diurnal changes in starch and TAG in raptor1b relative to the wild type (WT). FW, Fresh weight. C, Heat map representing the changes of amino acids, sugars, raffinose family of oligosaccharides (RFOs), and polyamines in raptor1b compared with the wild type. D, Changes in tricarboxylic acid cycle intermediates upon raptor1b mutation. For extraction, rosettes of raptor1b and the wild type were harvested at different time points from plants at the same developmental stage (10 rosette leaves). Plants were cultivated on soil under normal-light LD growth conditions. For heat maps, fold changes were calculated for each compound by dividing the average level of each independent raptor1b line by the average level of the wild type at the same time point. The log2 fold change in metabolite abundance was used to generate heap maps. This allowed more precise comparison by having one value for the wild type (0). The log2 fold changes provide the intensity of the color, according to the scale in the legend. Metabolite levels at each time point are presented in a color scale (blue = decrease, red = increase, white = zero, the wild-type value). Data represent means ± sd for five biological replicates. Asterisks indicate significant differences between the wild type and raptor1b under the same condition (***, P < 0.001, Student’s t test). White and black bars on the top of the graphs in A and B indicate light and dark periods, respectively. ED, End of the day; EN, end of the night; MD, middle of the day; MN, middle of the night.
Figure 8.
Figure 8.
Influence of raptor1b mutation on lipid metabolism. For lipid extraction, the rosettes of raptor1b and the wild type (WT) were harvested from plants at the same developmental stage (10 rosette leaves). Plants were cultivated on soil under normal-light LD growth conditions. DAG, Diacylglyceride; DGDG, digalactosyldiacylglycerol; FA, fatty acid; MGDG, monogalactosyldiacylglycerol; PA, phosphatidic acid; PC, phosphatidylcholine; PE, phosphatidylethanolamine; PG, phosphatidylglycerol; SQDG, sulfoquinovosyldiacylglycerol.
Figure 9.
Figure 9.
Influence of raptor1b mutation on phenolics accumulation. A, Visible accumulation of anthocyanin in young raptor1b seedlings (7 DAS), rosette leaves (30 DAS), and mature plants (55 DAS). B, Anthocyanins extracted from raptor1b compared with the wild type (WT). C to G, Total anthocyanin (C), flavonoids (D), soluble phenolics (E), cell wall-bound phenolics (F), and total lignin (G) in raptor1b compared with the wild type. For extraction, the rosettes of raptor1b and the wild type were harvested from plants at the same developmental stage (10 rosette leaves). Plants were cultivated on soil under normal-light LD growth conditions. Data represent means ± sd for five biological replicates. Asterisks indicate significant differences between the wild type and raptor1b under the same condition (***, P < 0.001, Student’s t test). CAE, Chlorogenic acid equivalent; FC, Folin-Ciocalteu reagent; FD, Folin-Denis reagent; FW, fresh weight; RE, rutin equivalent.
Figure 10.
Figure 10.
Influence of raptor1b mutation on secondary metabolism. The sum of the peak intensities of detected flavonoids, anthocyanins, glucosinolates, and sinapates, as well as the intensities of glutathione and ascorbate, are shown. For extraction, the rosettes of raptor1b and the wild type (WT) were harvested from plants at the same developmental stage (10 rosette leaves). Plants were cultivated on soil under normal-light LD growth conditions. Data represent means ± sd for five biological replicates. Asterisks indicate significant differences between the wild type and raptor1b under the same condition (*, P < 0.05; **, P < 0.01; and ***, P < 0.001, Student’s t test).
Figure 11.
Figure 11.
Influence of raptor1b mutation on ROS, autophagy, and tolerance to carbon starvation. A, Histochemical staining of ROS in rosette leaves. The levels of H2O2 and O2•− were assessed by 3,3′-diaminobenzidine (DAB) and nitroblue tetrazolium (NBT) staining, respectively. Bars = 500 µm. B, MDC-labeled autophagosomes observed by fluorescence microscopy in roots of 10-d-old seedlings of the wild type (WT), raptor1b, and the TOR-repressed line amiR-TOR-17. Red arrowheads indicate the positions of autophagosomes. C, MDC-derived fluorescence of roots was quantified by confocal microscopy following raptor1b mutation or TOR repression relative to the wild type. D to H, Effects of raptor1b on the survival of fixed-carbon starvation. The wild type and raptor1b at the same developmental stage (D) were exposed to 12 d of dark treatment (E), then allowed to recover for 4 d (F) and 7 d (G) after dark treatment. Survival rate (H) was scored after 7 d of recovery from fixed-carbon starvation. Data represent means ± sd for five biological replicates for C and 20 biological replicates for H from at least two independent experiments. Asterisks indicate significant differences between the wild type and raptor1b under the same condition (***, P < 0.001, Student’s t test).
Figure 12.
Figure 12.
Mutation of RAPTOR1B leads to changes of growth and metabolism in Arabidopsis. A, raptor1b shows significantly changed compounds, including lipids, metabolites, and hormones. The log2 fold changes of metabolite abundance in raptor1b relative to the wild type at the end of the day are shown by color scale, blue and red for significant decrease and increase (P < 0.05, Student’s t test), respectively. Metabolites with blue, red, and black characters represent significant decrease, increase, and no change, respectively. Metabolites with gray characters were not measured. For simplicity, only some of the main pathways are shown. Solid arrows represent single or multiple reactions. GABA, γ-Aminobutyric acid; IAA, indole-3-acetic acid; PI, phosphatidylinositol; PS, phosphatidylserine; SL, sphingolipids. B, Model for the influence of TOR/RAPTOR inhibition on signaling networks, growth, and metabolism in Arabidopsis. TOR as a central regulator controls plant growth and metabolism through the phosphorylation of regulatory targets. Arrows indicate activation, and bar-headed lines indicate inhibition.

Similar articles

Cited by

References

    1. Ache P, Bauer H, Kollist H, Al-Rasheid KA, Lautner S, Hartung W, Hedrich R (2010) Stomatal action directly feeds back on leaf turgor: new insights into the regulation of the plant water status from non-invasive pressure probe measurements. Plant J 62: 1072–1082 - PubMed
    1. Ahn CS, Han JA, Lee HS, Lee S, Pai HS (2011) The PP2A regulatory subunit Tap46, a component of the TOR signaling pathway, modulates growth and metabolism in plants. Plant Cell 23: 185–209 - PMC - PubMed
    1. Ainsworth EA, Gillespie KM (2007) Estimation of total phenolic content and other oxidation substrates in plant tissues using Folin-Ciocalteu reagent. Nat Protoc 2: 875–877 - PubMed
    1. Albus CA, Salinas A, Czarnecki O, Kahlau S, Rothbart M, Thiele W, Lein W, Bock R, Grimm B, Schöttler MA (2012) LCAA, a novel factor required for magnesium protoporphyrin monomethylester cyclase accumulation and feedback control of aminolevulinic acid biosynthesis in tobacco. Plant Physiol 160: 1923–1939 - PMC - PubMed
    1. Anderson GH, Veit B, Hanson MR (2005) The Arabidopsis AtRaptor genes are essential for post-embryonic plant growth. BMC Biol 3: 12. - PMC - PubMed

Publication types

MeSH terms

LinkOut - more resources