. 2018 May 15;115(20):5064-5071.
doi: 10.1073/pnas.1801598115. Epub 2018 Apr 23.

Neuronal activity regulates neurotransmitter switching in the adult brain following light-induced stress

Affiliations

Neuronal activity regulates neurotransmitter switching in the adult brain following light-induced stress

Da Meng et al. Proc Natl Acad Sci U S A. .

Abstract

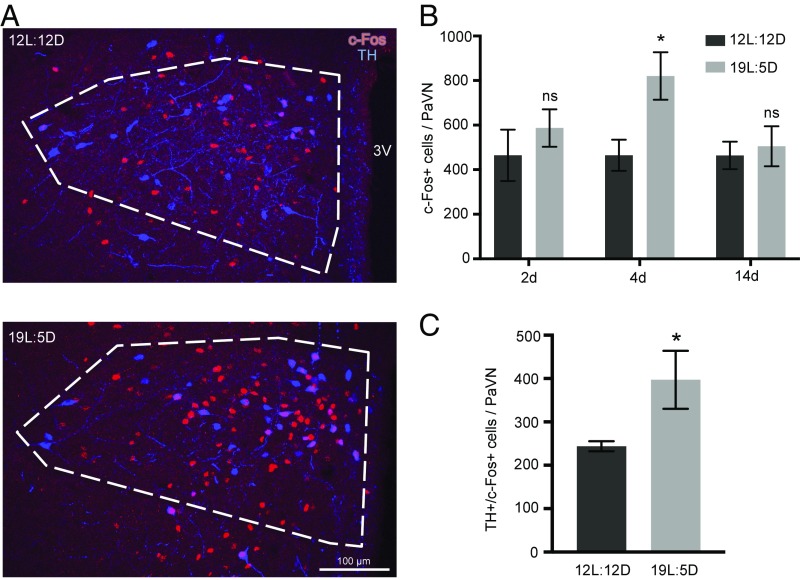
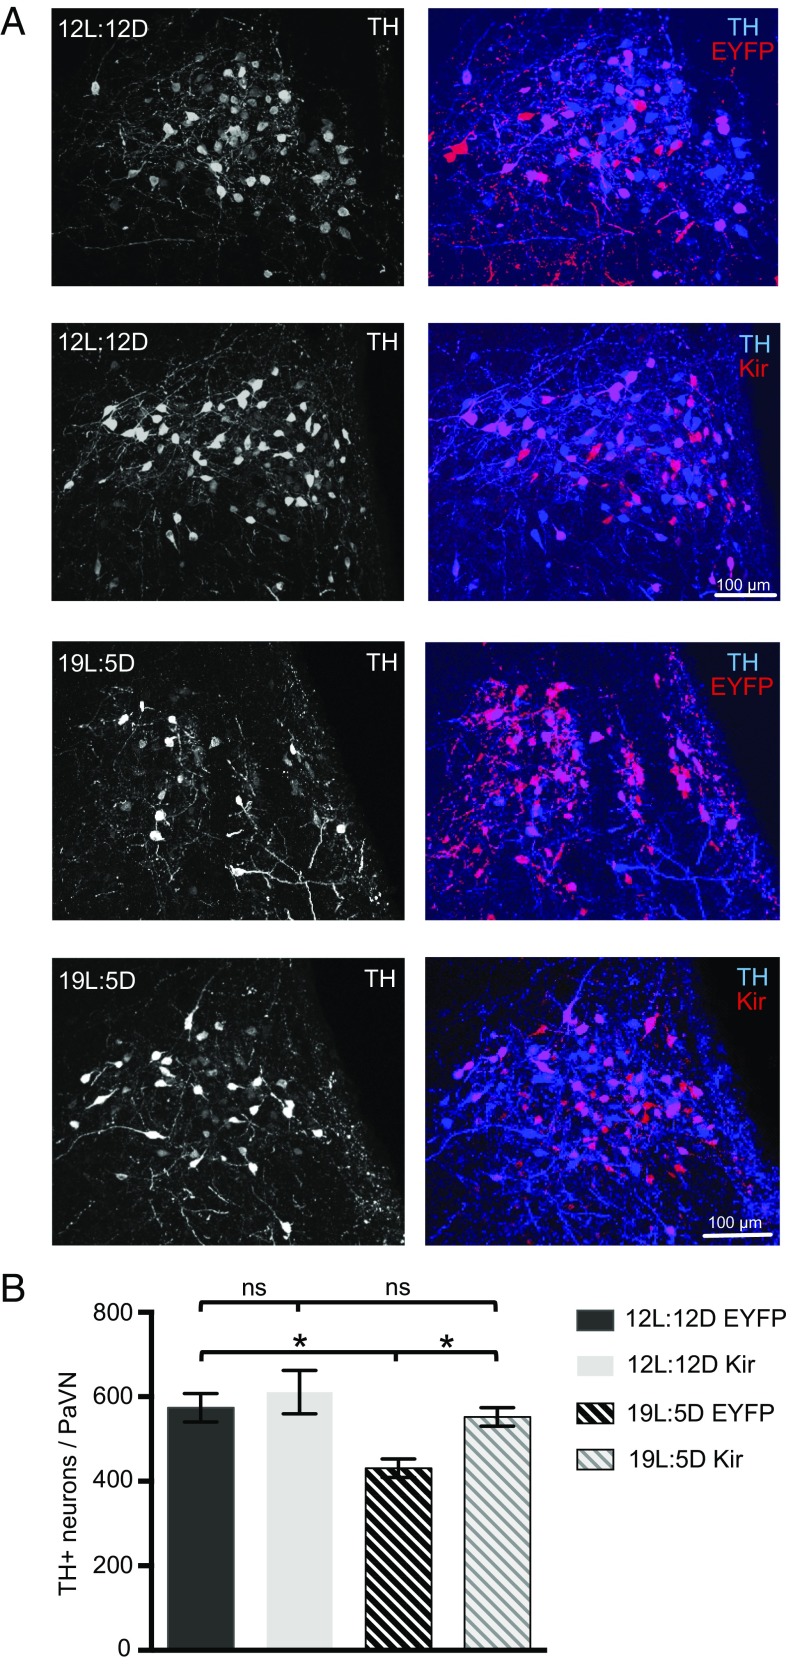
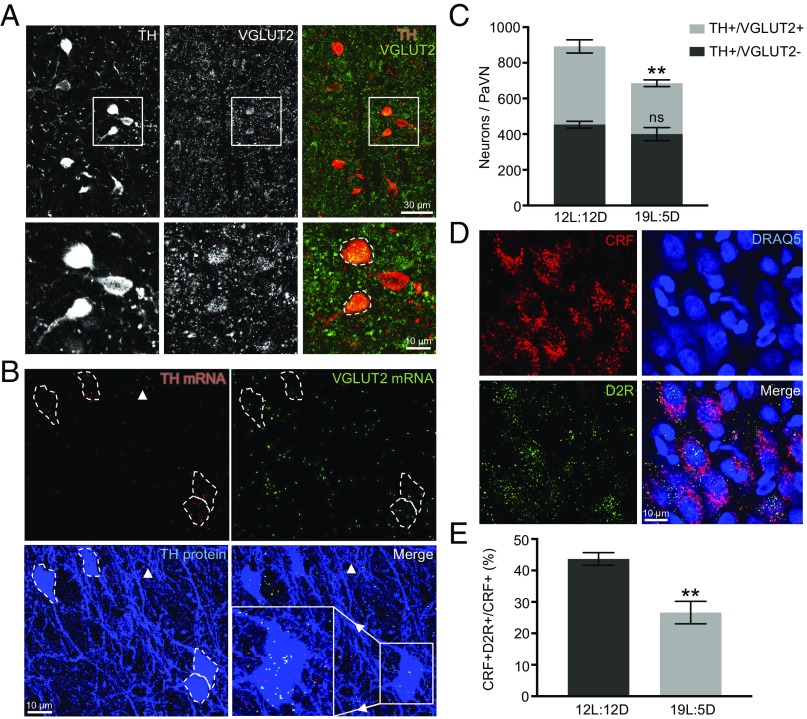
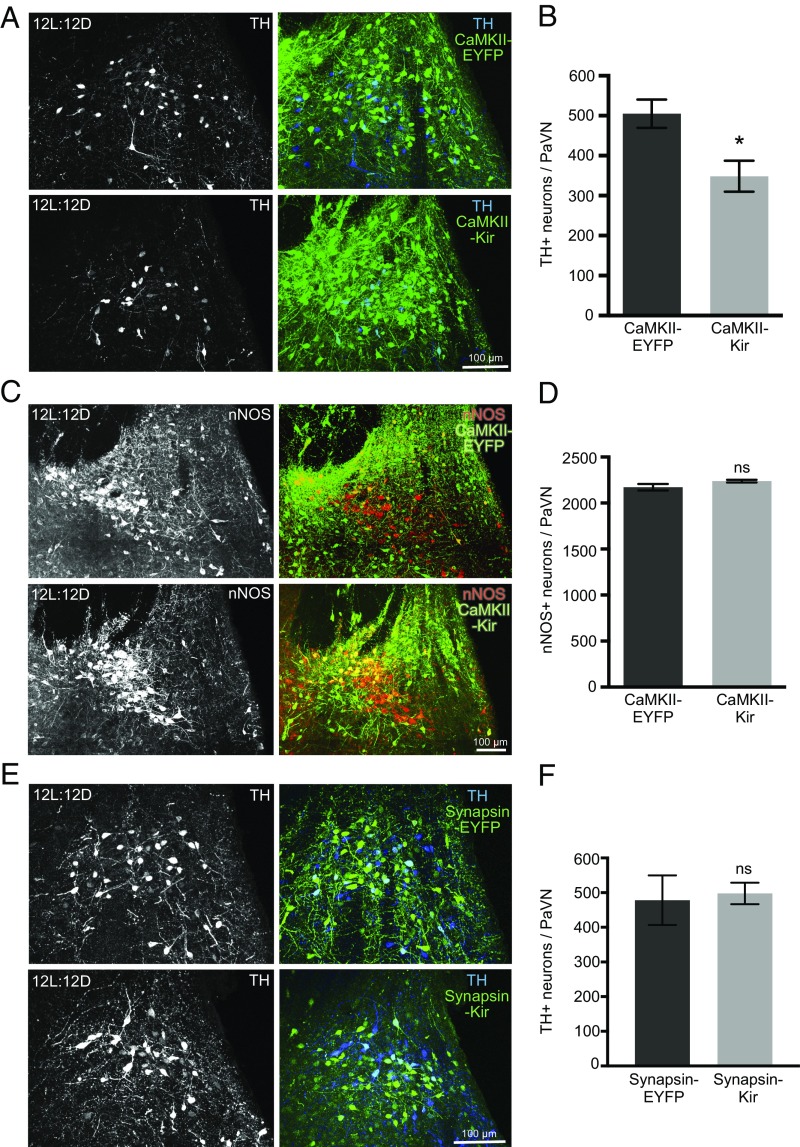
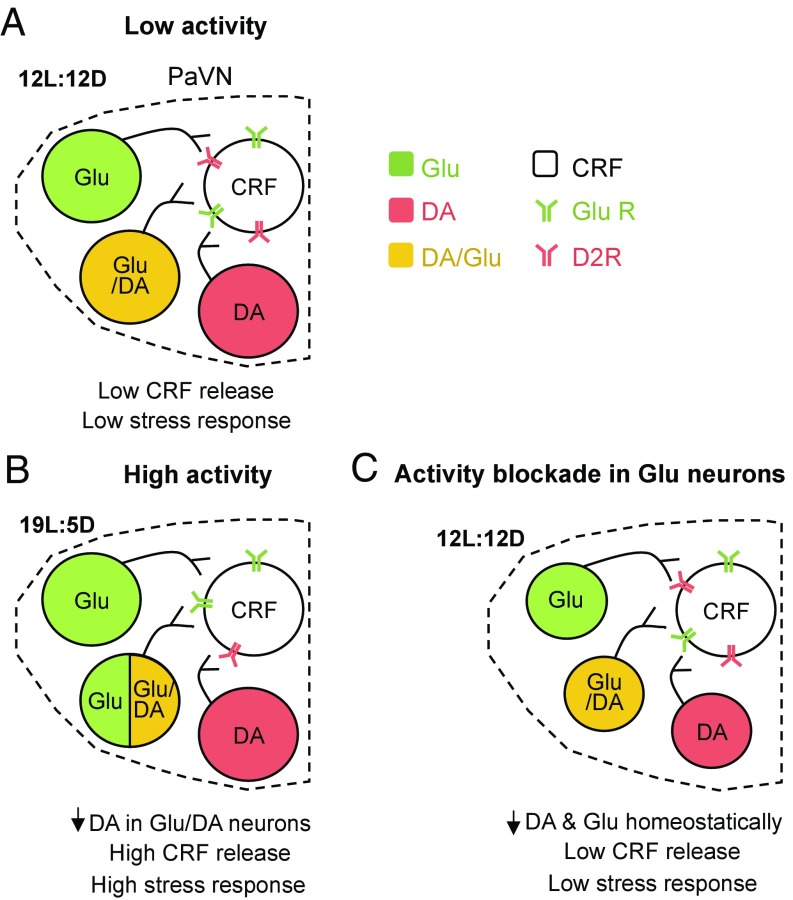
Neurotransmitter switching in the adult mammalian brain occurs following photoperiod-induced stress, but the mechanism of regulation is unknown. Here, we demonstrate that elevated activity of dopaminergic neurons in the paraventricular nucleus of the hypothalamus (PaVN) in the adult rat is required for the loss of dopamine expression after long-day photoperiod exposure. The transmitter switch occurs exclusively in PaVN dopaminergic neurons that coexpress vesicular glutamate transporter 2 (VGLUT2), is accompanied by a loss of dopamine type 2 receptors (D2Rs) on corticotrophin-releasing factor (CRF) neurons, and can lead to increased release of CRF. Suppressing activity of all PaVN glutamatergic neurons decreases the number of inhibitory PaVN dopaminergic neurons, indicating homeostatic regulation of transmitter expression in the PaVN.

Keywords: dopaminergic neurons; paraventricular nucleus of the hypothalamus; stress response; transmitter coexpression; transmitter switching.


Conflict of interest statement

The authors declare no conflict of interest.

Figures

Fig. 1.
Fig. 1.
Activity of PaVN neurons is elevated after long-day photoperiod exposure. WT rats were exposed to either a long-day photoperiod (19L:5D) or balanced-day photoperiod (12L:12D) for 2, 4, or 14 d. Immunofluorescent staining of TH and c-Fos was performed with fixed brain sections. (A) Confocal images of the PaVN after 4 d of exposure; white dashed lines indicate the PaVN boundary. 3V, third ventricle. (B) Quantification of the number of c-Fos+ cells in the PaVN per animal after different durations of exposure: 12L:12D for 2 d, n = 4 animals; 19L:5D for 2 d, n = 4 animals; 12L:12D for 4 d, n = 6 animals; 19L:5D for 4 d, n = 6 animals; 12L:12D for 14 d, n = 4 animals; and 19L:5D, n = 5 animals. Welch’s t test (2 d, P = 0.4267; 4 d, P = 0.0216; 14 d, P = 0.7209). Data are mean ± SEM. *P < 0.05. ns, not significant. (C) Quantification of the number of TH+/c-Fos+ cells in the PaVN per animal after 4 d of exposure to 12L:12D or 19L:5D (n = 6 animals per condition). Welch’s t test (P = 0.0478). Data are mean ± SEM. *P < 0.05.
Fig. 2.
Fig. 2.
Suppressing elevated activity of PaVN dopaminergic neurons blocks transmitter switching after long-day photoperiod exposure. TH-Cre rats were injected with AAV-DIO-hKir2.1 or AAV-DIO-EYFP (control) virus in the PaVN, exposed to either 12L:12D or 19L:5D, and immunostained for c-Fos and TH. (A) Confocal images showing PaVN TH expression (Left) and the coexpression of TH and viruses (Right) after the 2-wk photoperiod exposure. (B) Quantification of the number of PaVN TH+ neurons per animal after the 2-wk photoperiod exposure: 12L:12D EYFP, n = 9 animals; 12L:12D Kir, n = 7 animals; 19L:5D EYFP, n = 7 animals; and 19L:5D Kir, n = 8 animals. Kruskal–Wallis test followed by Dunn’s post hoc analysis corrected for multiple comparisons (12L:12D EYFP vs. 19L:5D EYFP, P = 0.0141; 19L:5D EYFP vs. 19L:5D Kir, P = 0.0460; 12L:12D EYFP vs. 12L:12D Kir, P > 0.9999; 12L:12D Kir vs. 19L:5D Kir, P > 0.9999). Data are mean ± SEM. *P < 0.05. ns, not significant.
Fig. 3.
Fig. 3.
Switchable PaVN dopaminergic neurons coexpress VGLUT2, a marker for glutamatergic neurons. (A, Top) Immunofluorescent costaining of TH and VGLUT2 in the PaVN of WT rats maintained on 12L:12D. TH (Left), VGLUT2 (Center), and a merged view (Right). (A, Bottom) Boxed areas are enlarged. White dashed lines indicate cell bodies with colocalized TH and VGLUT2. (B) RNAscope fluorescent in situ hybridization of TH and VGLUT2 combined with immunofluorescent staining of TH in the PaVN with WT rats maintained on 12L:12D. TH mRNA puncta (red; Top Left), VGLUT2 mRNA puncta (green; Top Right), TH protein staining (blue; Bottom Left), and a merged view (Bottom Right). White dashed lines indicate cell bodies of TH protein+ neurons. (Bottom Right) Area in the box is enlarged to highlight several TH and VGLUT2 mRNA puncta within the boundary of each TH protein+ cell body. White arrowheads indicate a TH mRNA+ but TH protein cell body. (C) Quantification of the number of immunostained PaVN TH+/VGLUT2+ neurons and TH+/VGLUT2 neurons per animal after 2 wk of 12L:12D or 19L:5D exposure: 12L:12D, n = 4 animals; 19L:5D, n = 5 animals. Welch’s t test (TH+/VGLUT2+, P = 0.0055; TH+/VGLUT2, P = 0.2788). Data are mean ± SEM. **P < 0.01. ns, not significant. (D) Immunofluorescent costaining of CRF and D2R in the PaVN of WT rats maintained on 12L:12D exposure. DRAQ5 was used as the nuclear marker. CRF (Top Left), DRAQ5 (Top Right), D2R (Bottom Left), and a merged view (Bottom Right) are shown. Images are maximum intensity projections of confocal z-stacks. (E) Quantification of the percentage of PaVN CRF neurons that express D2R per animal after 2 wk of 12L:12D or 19L:5D exposure: 12L:12D, n = 4 animals; 19L:5D, n = 5 animals. A total of 152–284 neurons were analyzed per animal. Welch’s t test (P = 0.0057). Data are mean ± SEM. **P < 0.01.
Fig. 4.
Fig. 4.
Suppressing activity of PaVN excitatory neurons decreases the number of PaVN dopaminergic neurons after balanced-day photoperiod exposure. (AD) WT rats were injected with AAV-CaMKII-Cre together with AAV-DIO-hKir2.1 (CaMKII-Kir) in the PaVN to suppress the activity of glutamatergic neurons. AAV-DIO-hKir2.1 was replaced with AAV-DIO-EYFP (CaMKII-EYFP) in the control group. Animals were maintained on 12L:12D after injection. (A) Coexpression of TH and viruses in the PaVN by immunofluorescence. TH (Left), a merged view of TH and virus (Right), CaMKII-EYFP (Top), and CaMKII-Kir (Bottom). (B) Quantification of the number of PaVN TH+ neurons per animal in the CaMKII-EYFP group versus the CaMKII-Kir group: n = 6 animals per condition. Welch’s t test (P = 0.0141). Data are mean ± SEM. *P < 0.05. (C) Coexpression of nNOS and viruses in the PaVN by immunofluorescence. nNOS (Left), a merged view of nNOS and virus (Right), CaMKII-EYFP (Top), and CaMKII-Kir (Bottom). (D) Quantification of the number of PaVN nNOS+ neurons per animal in the CaMKII-EYFP group versus the CaMKII-Kir group: CaMKII-EYFP, n = 5 animals; CaMKII-Kir, n = 4 animals. Welch’s t test (P = 0.1420). Data are mean ± SEM. ns, not significant. (E and F) WT rats were injected with AAV-Synapsin-Cre together with AAV-DIO-hKir2.1 (Synapsin-Kir) in the PaVN to suppress the activity of all neurons. AAV-DIO-hKir2.1 was replaced with AAV-DIO-EYFP (Synapsin-EYFP) in the control group. Animals were maintained on 12L:12D after injection. (E) Coexpression of TH and viruses in the PaVN by immunofluorescence. TH (Left), a merged view of TH and virus (Right), Synapsin-EYFP (Top), and Synapsin-Kir (Bottom). (F) Quantification of the number of PaVN TH+ neurons per animal in the Synapsin-EYFP group versus the Synapsin-Kir group: Synapsin-EYFP, n = 5 animals; Synapsin-Kir, n = 10 animals. Welch’s t test (P = 0.8110). Data are mean ± SEM.
Fig. 5.
Fig. 5.
Model of activity-dependent control of transmitter switching in the adult rat PaVN producing light-induced stress. (A) During the balanced-day photoperiod, the low activity of PaVN glutamatergic (Glu) neurons and inhibitory dopaminergic (DA) neurons leads to low activation of PaVN CRF neurons and a low stress response. (B) The shift to long-day photoperiod increases activation of PaVN Glu and DA neurons. Some Glu/DA neurons lose DA expression, while the level of Glu expression is maintained. Combined with the decreased CRF D2R level, CRF neurons are strongly activated and a high stress response is induced. (C) When the activity of PaVN Glu neurons is artificially suppressed, PaVN DA neurons down-regulate DA expression homeostatically. Whether both switching and nonswitching neurons target the same CRF cells remains to be determined.

Similar articles

Cited by

References

    1. Christoffel DJ, Golden SA, Russo SJ. Structural and synaptic plasticity in stress-related disorders. Rev Neurosci. 2011;22:535–549. - PMC - PubMed
    1. Bains JS, Wamsteeker Cusulin JI, Inoue W. Stress-related synaptic plasticity in the hypothalamus. Nat Rev Neurosci. 2015;16:377–388. - PubMed
    1. Dulcis D, Jamshidi P, Leutgeb S, Spitzer NC. Neurotransmitter switching in the adult brain regulates behavior. Science. 2013;340:449–453. - PubMed
    1. Gu X, Spitzer NC. Distinct aspects of neuronal differentiation encoded by frequency of spontaneous Ca2+ transients. Nature. 1995;375:784–787. - PubMed
    1. Guemez-Gamboa A, Xu L, Meng D, Spitzer NC. Non-cell-autonomous mechanism of activity-dependent neurotransmitter switching. Neuron. 2014;82:1004–1016. - PMC - PubMed

Publication types

MeSH terms