. 2018 May 8;115(19):E4473-E4482.
doi: 10.1073/pnas.1802354115. Epub 2018 Apr 23.

Systemic surfaceome profiling identifies target antigens for immune-based therapy in subtypes of advanced prostate cancer

Affiliations

Systemic surfaceome profiling identifies target antigens for immune-based therapy in subtypes of advanced prostate cancer

John K Lee et al. Proc Natl Acad Sci U S A. .

Abstract

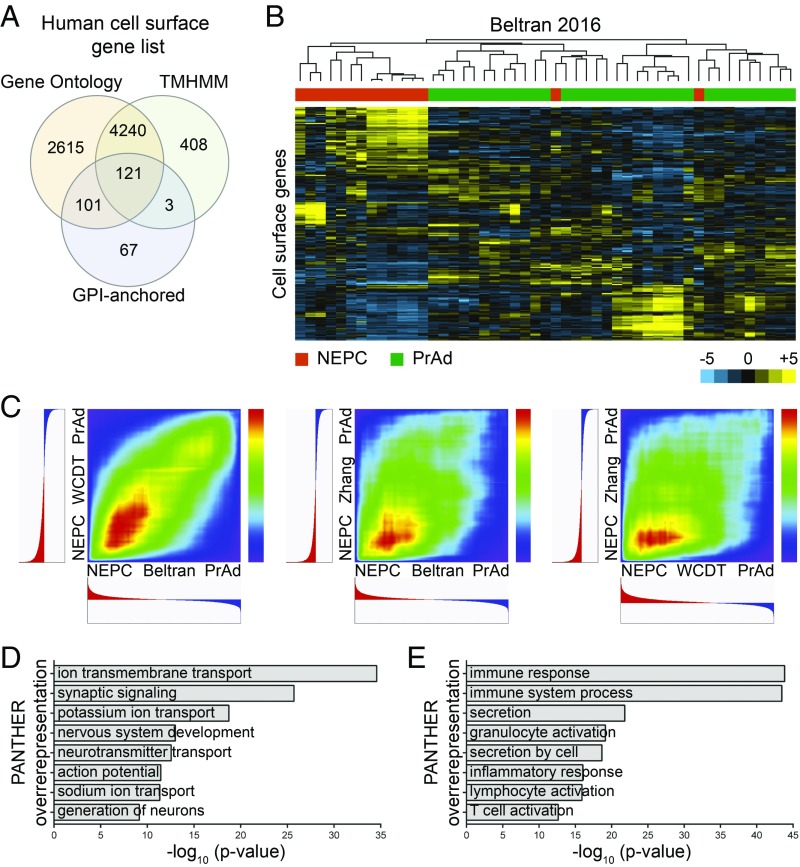
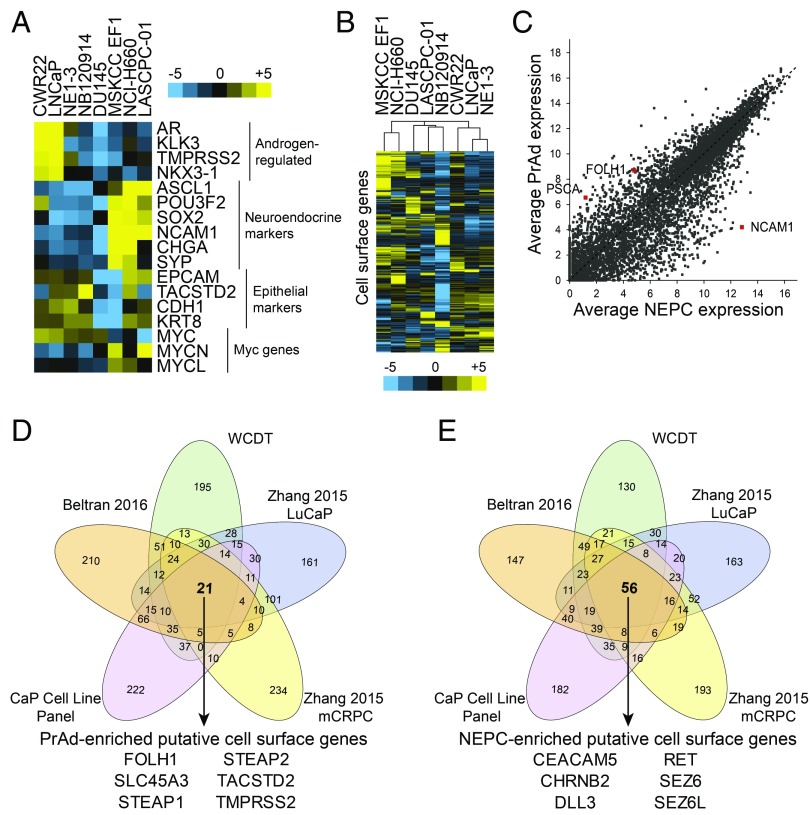
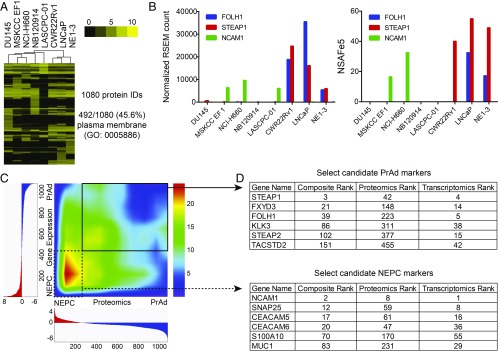
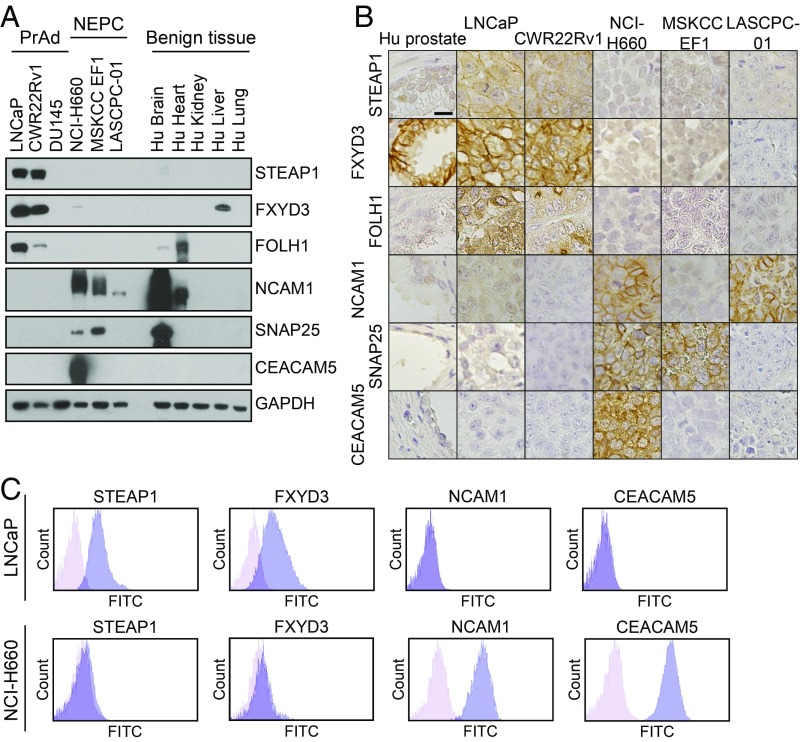
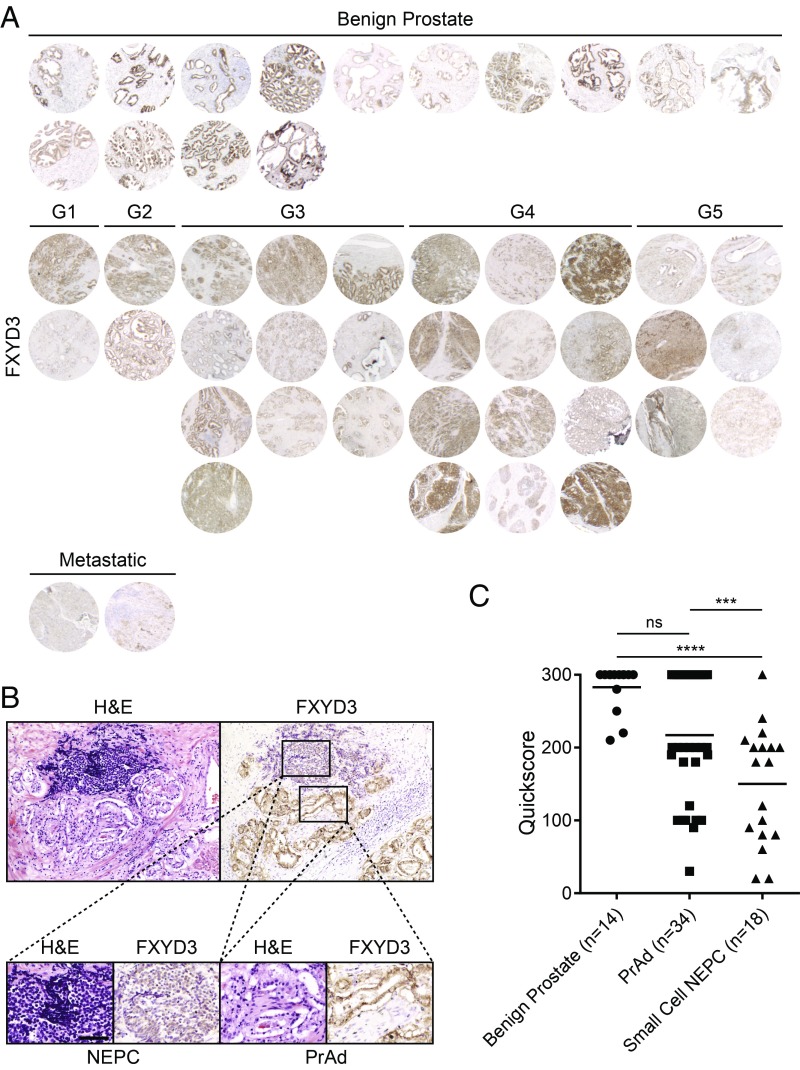
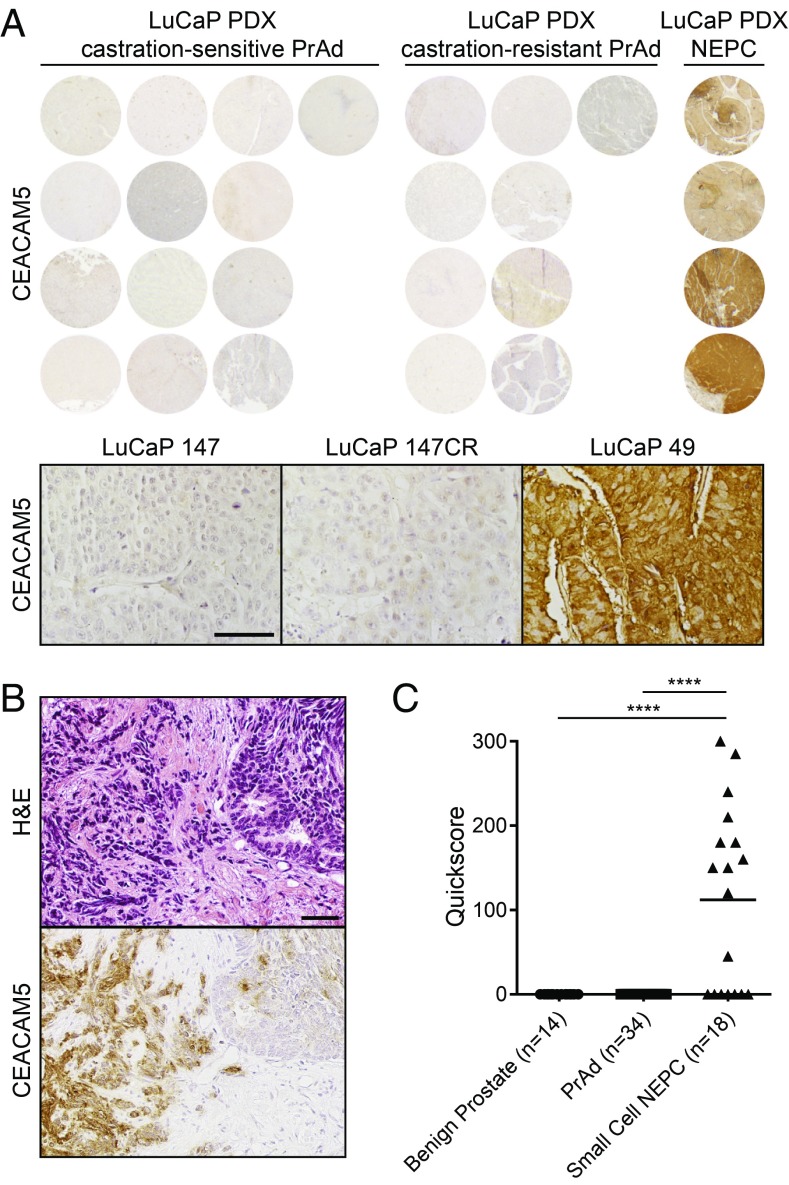
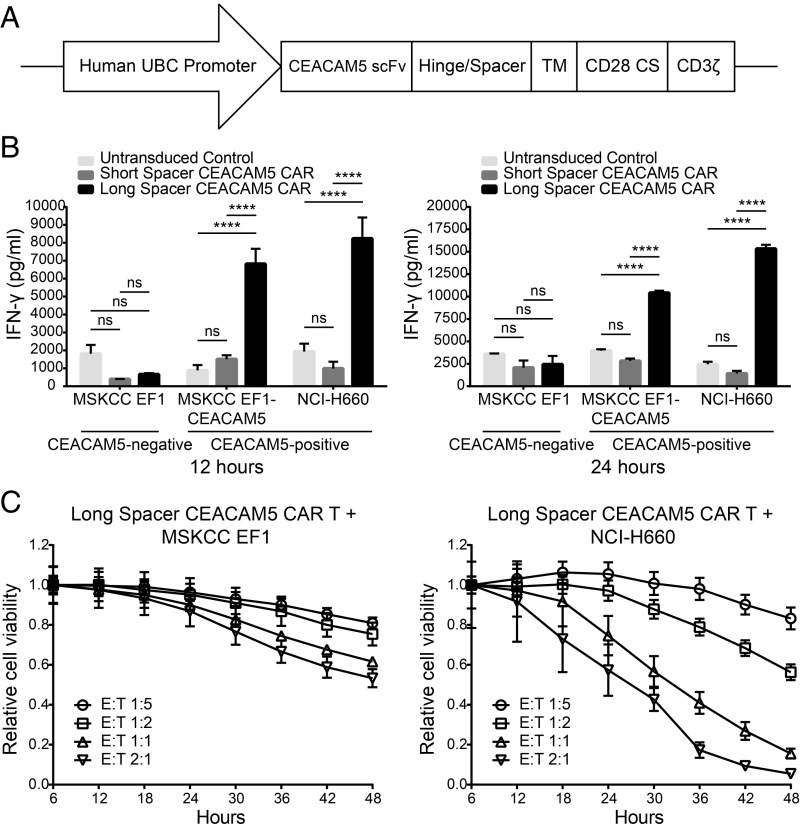
Prostate cancer is a heterogeneous disease composed of divergent molecular and histologic subtypes, including prostate adenocarcinoma (PrAd) and neuroendocrine prostate cancer (NEPC). While PrAd is the major histology in prostate cancer, NEPC can evolve from PrAd as a mechanism of treatment resistance that involves a transition from an epithelial to a neurosecretory cancer phenotype. Cell surface markers are often associated with specific cell lineages and differentiation states in normal development and cancer. Here, we show that PrAd and NEPC can be broadly discriminated by cell-surface profiles based on the analysis of prostate cancer gene expression datasets. To overcome a dependence on predictions of human cell-surface genes and an assumed correlation between mRNA levels and protein expression, we integrated transcriptomic and cell-surface proteomic data generated from a panel of prostate cancer cell lines to nominate cell-surface markers associated with these cancer subtypes. FXYD3 and CEACAM5 were validated as cell-surface antigens enriched in PrAd and NEPC, respectively. Given the lack of effective treatments for NEPC, CEACAM5 appeared to be a promising target for cell-based immunotherapy. As a proof of concept, engineered chimeric antigen receptor T cells targeting CEACAM5 induced antigen-specific cytotoxicity in NEPC cell lines. Our findings demonstrate that the surfaceomes of PrAd and NEPC reflect unique cancer differentiation states and broadly represent vulnerabilities amenable to therapeutic targeting.

Keywords: cell surface antigens; immunotherapy; prostate cancer.


Conflict of interest statement

The authors declare no conflict of interest.

Figures

Fig. 1.
Fig. 1.
Expression of genes encoding human cell-surface proteins distinguishes prostate cancer subtypes. (A) Venn diagram of a putative human cell-surface gene set bioinformatically constructed from the analysis of Gene Ontology, TMHMM, and GPI-anchored protein databases. (B) Heatmap demonstrating unsupervised hierarchical clustering of CRPC samples from the Beltran 2016 RNA-seq dataset based on the expression of cell-surface genes. Color bar represents a log2 scale. NEPC samples are labeled in orange and PrAd samples in green. (C) RRHO heatmaps showing rank overlap of differentially expressed cell-surface genes across NEPC and PrAd samples in pairwise comparisons of the Beltran 2016, SU2C/AACR/PCF West Coast Dream Team (WCDT), and Zhang 2015 gene expression datasets. (D and E) Gene enrichment analysis from PANTHER overrepresentation testing of cell-surface genes differentially expressed more than fourfold in NEPC relative to PrAd (D) and PrAd relative to NEPC (E) in the Beltran 2016 dataset.
Fig. 2.
Fig. 2.
Transcriptomic analysis identifies candidate PrAd- and NEPC-specific cell surface markers. (A) Heatmap of the gene expression of select androgen-regulated, neuroendocrine, and epithelial markers and Myc genes based on RNA-seq of a diverse panel of human prostate cancer cell lines. Color bar represents a log2 scale. (B) Heatmap showing unsupervised hierarchical clustering of human prostate cancer cell lines based on the expression of cell-surface genes. (C) Plot of average expression of genes in NEPC vs. PrAd prostate cancer cell lines with select markers (NCAM1, FOLH1, and PSCA) highlighted. Gene expression is shown in log2 scale. (D and E) Venn diagrams showing rank overlap of the top 500 differentially expressed cell-surface genes in PrAd relative to NEPC (D) and NEPC relative to PrAd (E) in each of five gene-expression datasets [prostate cancer (CaP) cell line panel, Beltran 2016, WCDT, Zhang 2015 LuCaP xenografts, and Zhang 2015 metastatic CRPC (mCRPC) samples]. Listed are the genes identified from rank overlap analysis that are enriched in all of the datasets evaluated.
Fig. 3.
Fig. 3.
Integration of cell-surface proteomics with transcriptomics nominates high-confidence PrAd and NEPC cell surface proteins. (A) Heatmap displaying unsupervised hierarchical clustering of prostate cancer cell lines based on the expression of cell-surface proteins identified from cell-surface proteomics. Depicted are normalized protein abundance values (NSAFe5). Color bar represents a log2 scale. GO, Gene Ontology. (B) Comparison of the normalized RSEM gene expression counts and NSAFe5 values for the cell-surface markers FOLH1, STEAP1, and NCAM1 in each of the prostate cancer cell lines. (C) Rank–rank hypergeometric heatmap showing rank overlap of differentially expressed cell-surface proteins vs. cell-surface genes identified from cell-surface proteomics and RNA-seq gene-expression analysis of the prostate cancer cell line panel. (D) Select markers demonstrating concordantly enriched protein and gene expression in the PrAd or NEPC cell lines are shown with their associated composite, proteomics, and transcriptomics ranks.
Fig. 4.
Fig. 4.
Validation of candidate prostate cancer subtype-specific cell-surface antigens. (A) Immunoblot analysis of select PrAd (LNCaP, CWR22Rv1, and DU145) and NEPC (NCI-H660, MSKCC EF1, and LASCPC-01) cell lines as well as benign human tissues (brain, heart, kidney, liver, and lung) with antibodies against STEAP1, FXYD3, FOLH1, NCAM1, SNAP25, CEACAM5, and GAPDH as a loading control. (B) Human prostate tissue (Hu prostate) or prostate cancer cell line (LNCaP, CWR22Rv1, NCI-H660, MSKCC EF1, and LASCPC-01) xenograft sections after immunohistochemical staining with antibodies for the candidate antigens from A. (Scale bar, 25 µm.) (C) Flow cytometry histogram plots of the PrAd cell line LNCaP and the NEPC cell line NCI-H660 stained with antibodies against STEAP1, FXYD3, NCAM1, and CEACAM5.
Fig. 5.
Fig. 5.
FXYD3 is a cell-surface antigen whose expression is enriched in benign prostate epithelial cells and PrAd. (A) FXYD3 immunohistochemical stains of benign prostate tissues (n = 14), primary Gleason grade 1–5 PrAd tissues (n = 32), and metastatic PrAd samples (n = 2). (B) H&E and FXYD3 immunohistochemical stains of a section of mixed PrAd and NEPC. (Scale bar, 200 µm.) (C) Quantitation of FXYD3 IHC in benign prostate tissues (n = 14), PrAd (n = 34), and small-cell NEPC samples (n = 18) by Quickscore (intensity × percentage of positive cells; maximum score is 300). ns, nonsignificance. **P < 0.01; ****P < 0.0001 (by one-way ANOVA statistical analysis).
Fig. 6.
Fig. 6.
CEACAM5 is a prostate cancer cell-surface antigen specific to the NEPC subtype. (A) CEACAM5 IHC of a LuCaP PDX tissue microarray with androgen-sensitive PrAd samples (n = 13), castration-resistant PrAd samples (n = 9), and NEPC samples (n = 4). CEACAM5 immunohistochemical stains of representative androgen-sensitive PrAd (LuCaP 147), castration-resistant PrAd (LuCaP 147CR), and NEPC (LuCaP 49) sections. (Scale bar, 100 µm.) (B) H&E and CEACAM5 immunohistochemical stains of a small cell NEPC sample archived at UCLA demonstrating adjoining regions of small-cell NEPC (left) and PrAd (right). (Scale bar, 100 µm.) (C) Quantitation of CEACAM5 IHC in benign prostate tissues (n = 14), PrAd (n = 34), and small-cell NEPC samples (n = 18) by Quickscore (intensity × percentage of positive cells; maximum score is 300). ****P < 0.0001 (by one-way ANOVA statistical analysis).
Fig. 7.
Fig. 7.
Targeting CEACAM5 in NEPC with CAR T cell immunotherapy. (A) Schematic of the CAR construct targeting CEACAM5. CS, costimulatory domain; TM, CD28 transmembrane domain. (B) IFN-γ quantitation in the medium at 12 and 24 h after coculture of short spacer CEACAM5 CAR-transduced, long spacer CEACAM5 CAR-transduced, or untransduced T cells with CEACAM5-negative or -positive target cell lines as shown. SE measurements for four replicate wells are displayed. Data are representative of three independent experiments with similar results. ns represents nonsignificance. ****P < 0.0001 (by two-way ANOVA statistical analysis). (C) Relative viability over time of CEACAM5-negative MSKCC EF1 target cells or CEACAM5-positive NCI-H660 target cells cocultured with long spacer CEACAM5 CAR-transduced T cells. Effector-to-target ratios varying from 1:5 to 2:1 are shown. SE measurements for three replicate wells at each timepoint are displayed. Data are representative of two independent experiments with similar results.

Comment in

References

    1. Siegel RL, Miller KD, Jemal A. Cancer statistics, 2016. CA Cancer J Clin. 2016;66:7–30. - PubMed
    1. Bluemn EG, et al. Androgen receptor pathway-independent prostate cancer is sustained through FGF signaling. Cancer Cell. 2017;32:474–489.e6. - PMC - PubMed
    1. Epstein JI, et al. Proposed morphologic classification of prostate cancer with neuroendocrine differentiation. Am J Surg Pathol. 2014;38:756–767. - PMC - PubMed
    1. Clermont PL, et al. Identification of the epigenetic reader CBX2 as a potential drug target in advanced prostate cancer. Clin Epigenetics. 2016;8:16. - PMC - PubMed
    1. Kleb B, et al. Differentially methylated genes and androgen receptor re-expression in small cell prostate carcinomas. Epigenetics. 2016;11:184–193. - PMC - PubMed

Publication types

MeSH terms