. 2018 Apr 23;9(1):1599.
doi: 10.1038/s41467-018-04059-1.

Evolution of high-level resistance during low-level antibiotic exposure

Affiliations

Evolution of high-level resistance during low-level antibiotic exposure

Erik Wistrand-Yuen et al. Nat Commun. .

Abstract

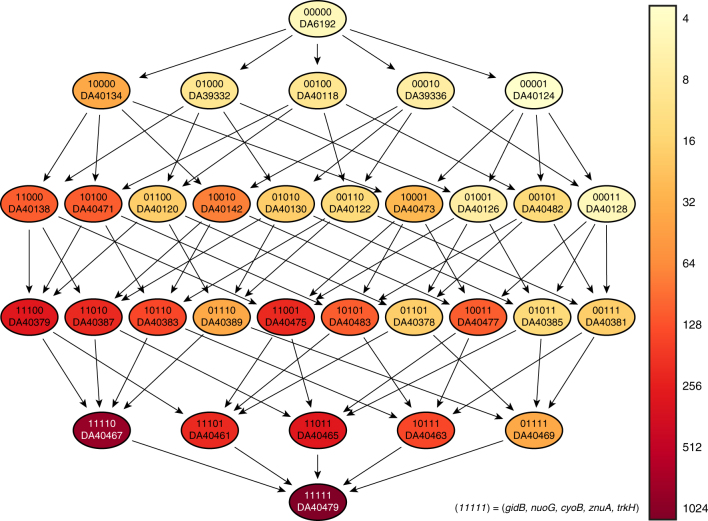
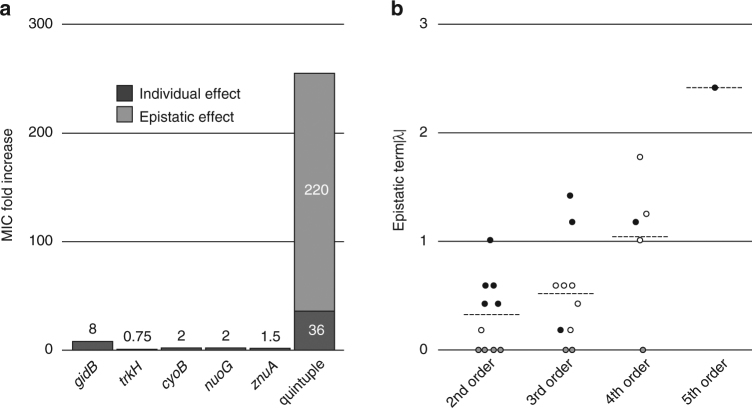
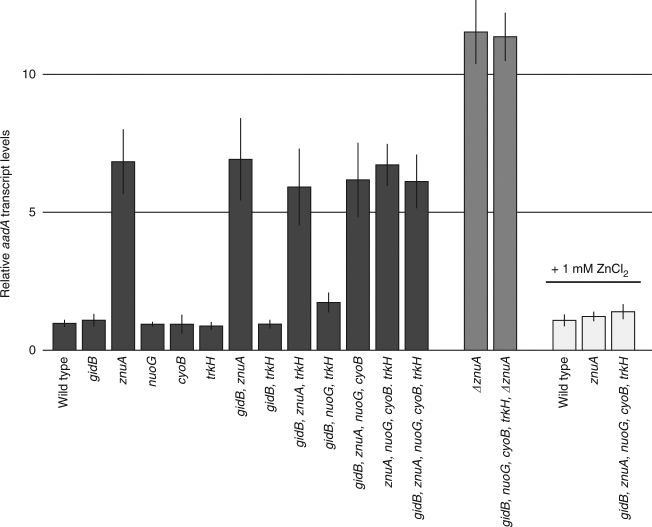
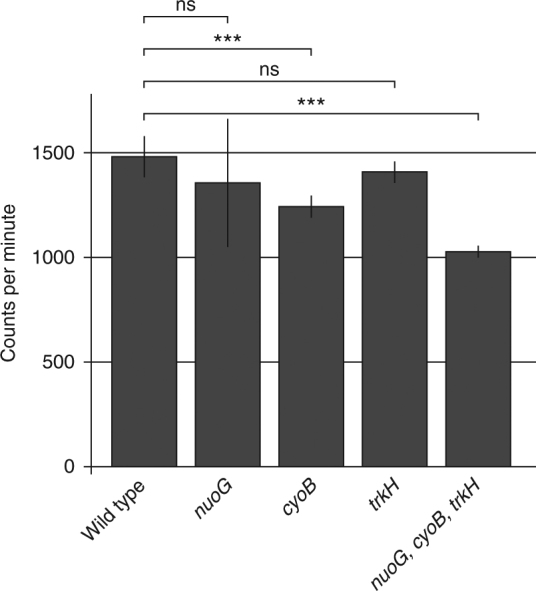
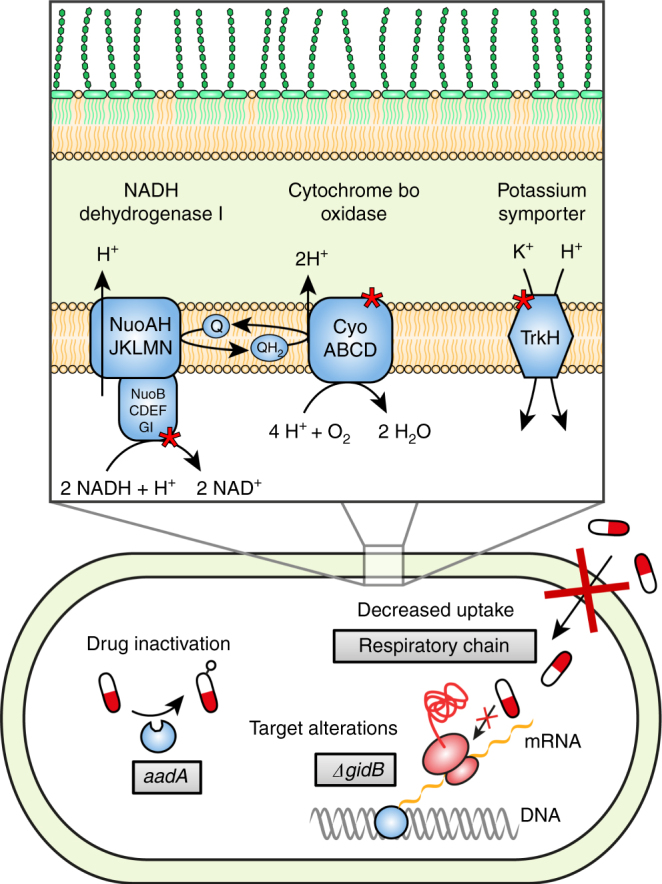
It has become increasingly clear that low levels of antibiotics present in many environments can select for resistant bacteria, yet the evolutionary pathways for resistance development during exposure to low amounts of antibiotics remain poorly defined. Here we show that Salmonella enterica exposed to sub-MIC levels of streptomycin evolved high-level resistance via novel mechanisms that are different from those observed during lethal selections. During lethal selection only rpsL mutations are found, whereas at sub-MIC selection resistance is generated by several small-effect resistance mutations that combined confer high-level resistance via three different mechanisms: (i) alteration of the ribosomal RNA target (gidB mutations), (ii) reduction in aminoglycoside uptake (cyoB, nuoG, and trkH mutations), and (iii) induction of the aminoglycoside-modifying enzyme AadA (znuA mutations). These results demonstrate how the strength of the selective pressure influences evolutionary trajectories and that even weak selective pressures can cause evolution of high-level resistance.


Conflict of interest statement

The authors declare no competing interests.

Figures

Fig. 1
Fig. 1
The fitness landscape of streptomycin resistance. The color scale indicates the MIC of streptomycin in mg L−1 for each reconstructed mutant. The genotype of each strain is written as a five-bit binary code, where 0 and 1 represent the wild-type and mutant sequences, respectively. See Table 2 for complete strain genotypes
Fig. 2
Fig. 2
Epistatic interactions. a Five mutations generate higher resistance than expected from their individual effects. The MIC increase based on individual additive effects is indicated in dark gray, while fold increase based on epistatic interactions is indicated in light gray. b The epistatic interactions increase with higher orders. Positive epistasis (filled circles) predominates at the 2nd and 5th order, while negative epistasis (empty circles) predominates at 3rd and 4th order. The strongest epistasis is observed in the quintuple mutant. Gray circles represent no epistatic interactions. The full dataset of epistatic interactions can be found in Supplementary Table 2
Fig. 3
Fig. 3
Relative aadA transcript levels. Transcript levels of the aadA gene were determined in reconstructed mutants (dark gray), znuA deletion mutants (gray), and reconstructed mutants grown in the presence of 1 mM ZnCl2 (white). Transcript levels were normalized to the housekeeping genes cysG and hcaT and all values are relative to transcript levels in the wild type. The error bars represent the standard deviation of two biological and three technical replicates each
Fig. 4
Fig. 4
Intracellular uptake of H3-dihydrostreptomycin. Cells from late exponential phase were incubated 30 min in presence of 50 nCi ml−1 tritiated dihydrostreptomycin and washed to remove extracellular H3-dihydrostreptomycin. Counts per minute were determined for two biological and two technical replicates each. The error bars represent standard deviation. t-tests were performed to calculate the significance of the differences between mutants and wild type, where ns (not significant) indicates a p-value over 0.05 and three asterisks indicate high significance with p-values < 0.01
Fig. 5
Fig. 5
Population dynamics of different mutant types. Time development of the population fractions for u = 2 × 10−6 and v/u = 200. The fractions of the different variants over time in generations are shown on the y-axis, where Fon and Fmn are the fractions of cells with n selected mutations for non-mutators and mutators, respectively. Non-mutators (a) contribute almost exclusively to n = 0 (red curve) and n = 1 (blue curve), while mutators (b) dominate totally in the fractions that carry three or more mutations; in the group with n = 2 (green curve), there is some mixing between mutators and non-mutators
Fig. 6
Fig. 6
Three different resistance mechanisms that act in synergy. Increased expression of the aminoglycoside adenyl transferase gene aadA via inactivation of the gene znuA lowers the concentration of active drug through chemical modification, mutations in gidB indirectly modifies the drug target to decrease binding, and mutations in the respiratory chain lowers the membrane potential, causing a decrease in uptake of the drug
Fig. 7
Fig. 7
Penetration of mutants with five selected mutations. Penetration after 900 generations as a function of mutator mutation rate v for values of u between 5 × 10−7 (black curve on the right) and 4 × 10−6 (red curve on the left)

References

    1. Andersson DI, Hughes D. Microbiological effects of sublethal levels of antibiotics. Nat. Rev. Microbiol. 2014;12:465–478. doi: 10.1038/nrmicro3270. - DOI - PubMed
    1. Thiele-Bruhn S. Pharmaceutical antibiotic compounds in soils—a review. J. Plant Nutr. Soil Sci. 2003;166:145–167. doi: 10.1002/jpln.200390023. - DOI
    1. Chander Y, Kumar K, Goyal SM, Gupta SC. Antibacterial activity of soil-bound antibiotics. J. Environ. Qual. 2005;34:1952–1957. doi: 10.2134/jeq2005.0017. - DOI - PubMed
    1. Martínez JL. Antibiotics and antibiotic resistance genes in natural environments. Science. 2008;321:365–367. doi: 10.1126/science.1159483. - DOI - PubMed
    1. Kümmerer K. Antibiotics in the aquatic environment—a review. Chemosphere. 2009;75:417–434. doi: 10.1016/j.chemosphere.2008.11.086. - DOI - PubMed

Publication types

MeSH terms