. 2018 Apr 23;9(1):1591.
doi: 10.1038/s41467-018-03900-x.

Multi-faceted immunomodulatory and tissue-tropic clinical bacterial isolate potentiates prostate cancer immunotherapy

Affiliations

Multi-faceted immunomodulatory and tissue-tropic clinical bacterial isolate potentiates prostate cancer immunotherapy

Jonathan F Anker et al. Nat Commun. .

Abstract

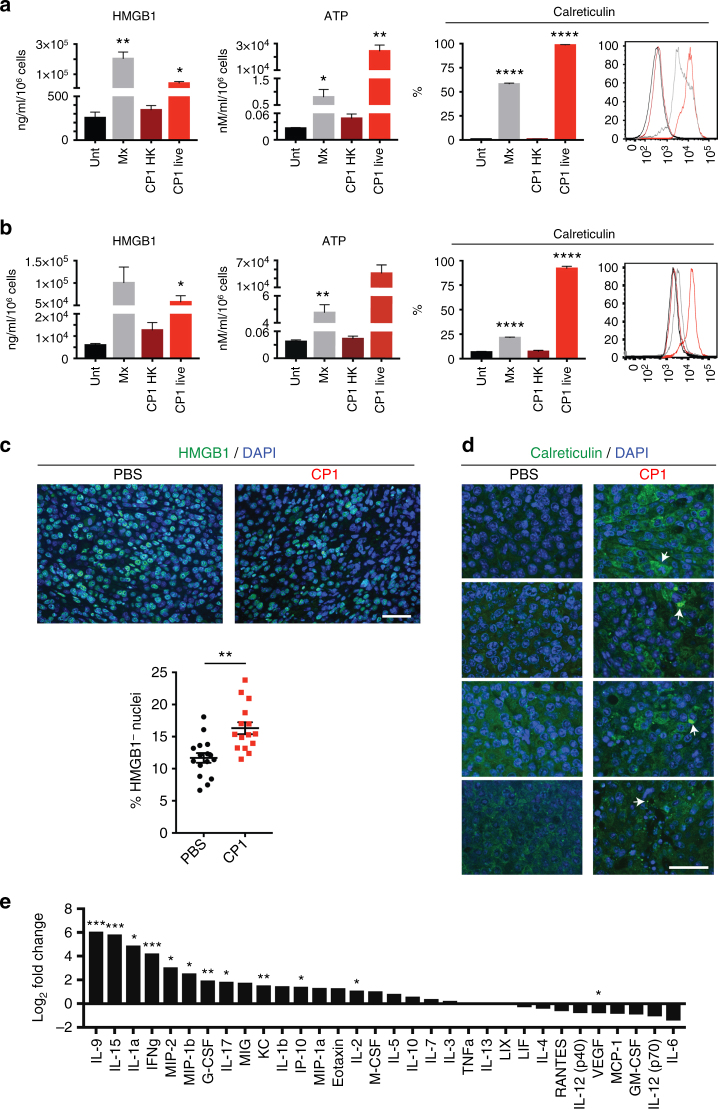
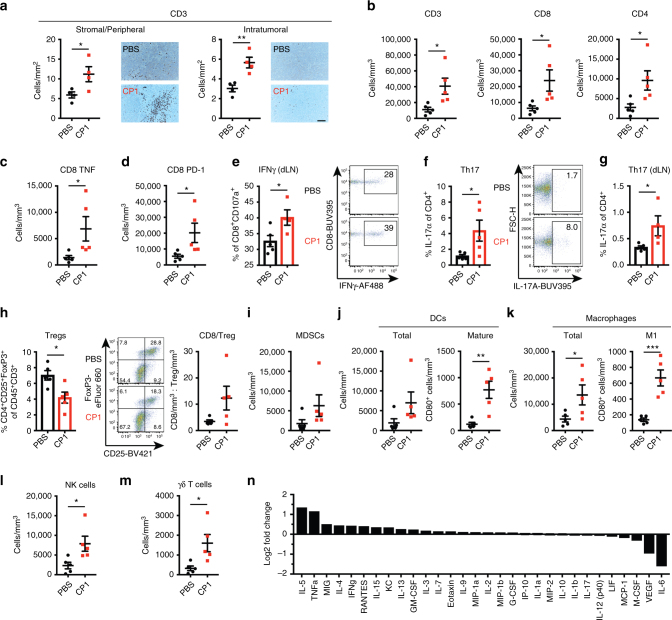
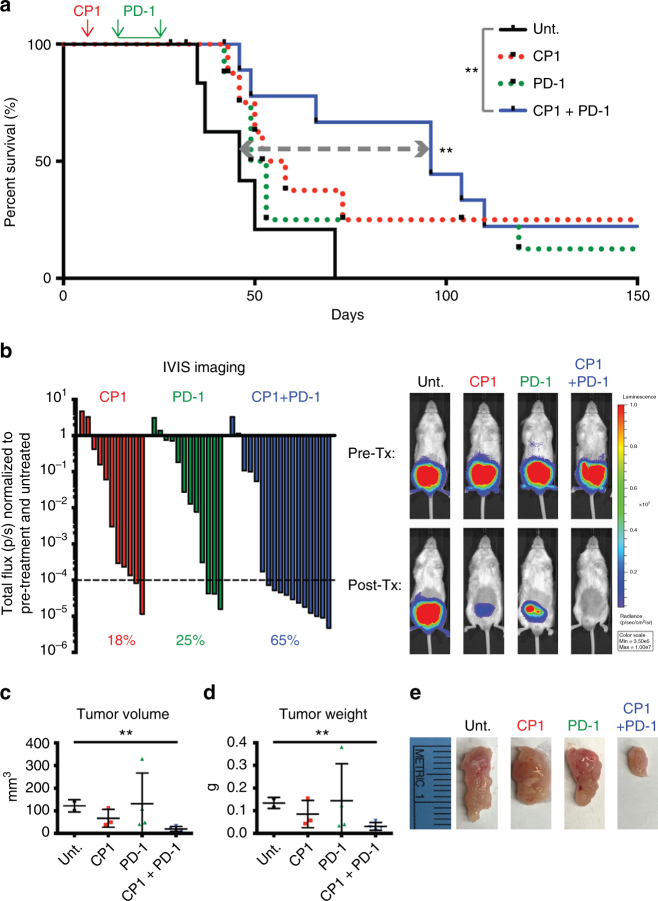
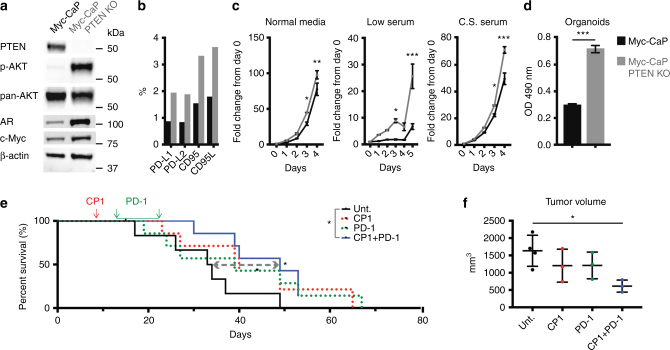
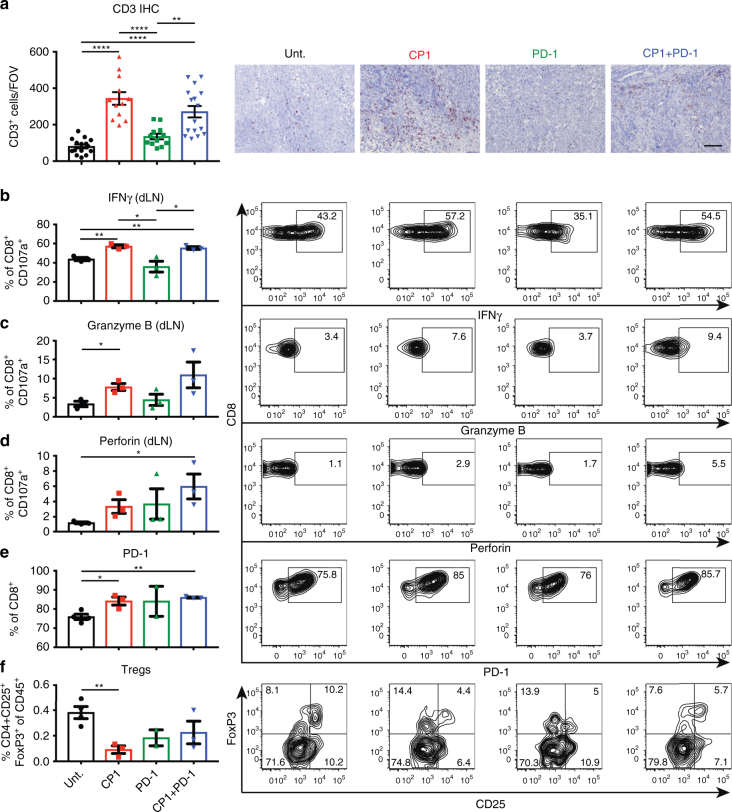
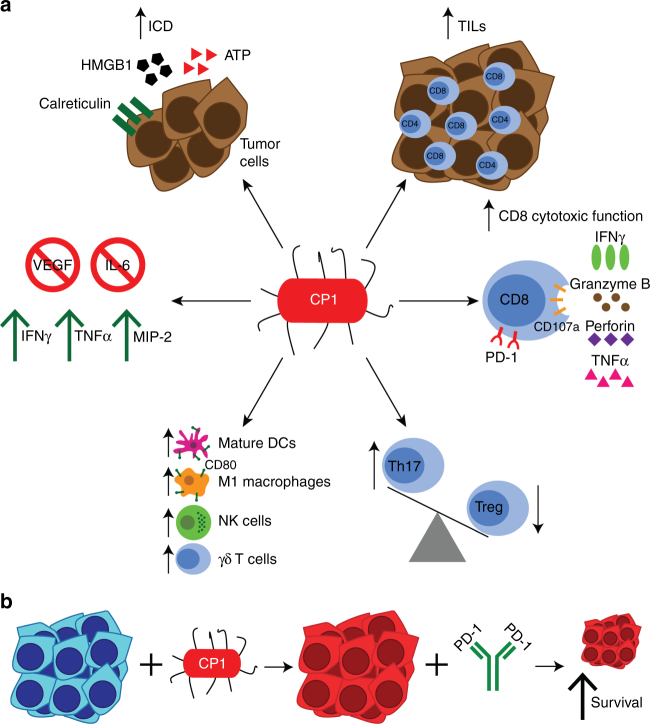
Immune checkpoint inhibitors have not been effective for immunologically "cold" tumors, such as prostate cancer, which contain scarce tumor infiltrating lymphocytes. We hypothesized that select tissue-specific and immunostimulatory bacteria can potentiate these immunotherapies. Here we show that a patient-derived prostate-specific microbe, CP1, in combination with anti-PD-1 immunotherapy, increases survival and decreases tumor burden in orthotopic MYC- and PTEN-mutant prostate cancer models. CP1 administered intra-urethrally specifically homes to and colonizes tumors without causing any systemic toxicities. CP1 increases immunogenic cell death of cancer cells, T cell cytotoxicity, and tumor infiltration by activated CD8 T cells, Th17 T cells, mature dendritic cells, M1 macrophages, and NK cells. CP1 also decreases intra-tumoral regulatory T cells and VEGF. Mechanistically, blocking CP1-recruited T cells from infiltrating the tumor inhibits its therapeutic efficacy. CP1 is an immunotherapeutic tool demonstrating how a tissue-specific microbe can increase tumor immunogenicity and sensitize an otherwise resistant cancer type to immunotherapy.


Conflict of interest statement

J.F.A., P.T., S.A.A., and A.J.S. are co-inventors on a provisional patent on CP1 use through Northwestern University on “Immunostimulatory bacteria for the treatment of cancer” under filing with the US Patent office (Application number 62539843). The remaining authors declare no competing interests.

Figures

Fig. 1
Fig. 1
CP1 specifically homes to and colonizes prostate tumor tissue. Orthotopic prostate tumor-bearing mice were analyzed 9 days after intra-urethral CP1 administration. a Bacterial colonization in the bladder, prostate tumor (also represented as b CFU/g and c percentage of the initial 2 × 108 CP1 intra-urethral inoculum), ipsilateral and contralateral kidneys, liver, and spleen, performed in biological triplicates, plated in serial dilutions. d 16S qRT-PCR of tumor RNA, normalized to RPLP0, performed in biological quadruplicates, technical duplicates. e E. coli IF of tumor tissue (yellow/red = extracellular, indicated with white arrows; green = intracellular, indicated with brown arrows) (scale bar, 20 μm; magnified scale bar, 4 μm). Mice n= 4–5/group, performed in two independent experiments, E. coli IF quantified with quadruplicate FOVs/tumor. Data represented as mean ± S.E.M. Statistical significance was determined by two-tailed Student’s t-test. *P < 0.05
Fig. 2
Fig. 2
CP1 induces immunogenic cell death while increasing pro-inflammatory cytokines and chemokines and decreasing VEGF. ICD was assessed in vitro from co-culture of a Myc-CaP or b LNCaP cells with untreated (Unt.), mitoxantrone (Mx), heat killed (HK) CP1, or live CP1 via HMGB1 (ELISA), ATP (luminescence assay), and calreticulin (flow cytometry, with representative histogram (Unt = black, Mx = gray, CP1 HK = dark red, CP1 live = red)), performed in biological triplicates, technical duplicates, statistics compared to Unt. ICD was assessed in vivo by c HMGB1 or d calreticulin IF of prostate tumor tissue 9 days after intra-urethral CP1 administration, with representative images (each calreticulin image representative of a different tumor with white arrows indicating foci of cell surface staining, green = HMGB1 or calreticulin, scale bar, 50 μm). Mice n= 4/group, HMGB1 quantified with quadruplicate FOVs/tumor. e Multiplex cytokine and chemokine array from Myc-CaP supernatant, performed in biological triplicates, technical duplicates. Data represented as mean ± S.E.M. or log2 fold change with and without CP1 exposure. Statistical significance was determined by two-tailed Student’s t-test (a, b, each group compared to Unt.). *P < 0.05, **P < 0.01, ***P < 0.001, ****P < 0.0001
Fig. 3
Fig. 3
CP1 increases TILs and tumor immune infiltration while decreasing Tregs. a Blinded IHC with representative images (scale bar, 100 μm) and bm flow cytometry analysis of Myc-CaP tumors or dLNs, as indicated, displayed as cell counts normalized to tumor volume (scatter plots) or percentages of parent gate (scatter boxed plots), with representative flow cytometry plots. MDSCs were defined as CD11b+Gr-1+. n Multiplex cytokine and chemokine array from Myc-CaP tumors. Mice n= 4–5/group, performed in two independent experiments. Data represented as mean ± S.E.M. or log2 fold change with and without CP1 administration. Statistical significance was determined by two-tailed Student’s t-test. *P < 0.05, **P < 0.01, ***P < 0.001
Fig. 4
Fig. 4
Combination CP1 and anti-PD-1 immunotherapy is efficacious in treating orthotopic prostate tumors. a Kaplan–Meier survival curve of Unt., CP1, anti-PD-1 antibody, or combination CP1 and anti-PD-1 antibody treated mice, mice n= 6–12/group, performed in three independent experiments. b Waterfall plot of IVIS imaging quantification, with each bar representing the post-treatment (Tx) total flux of a single tumor normalized to both its own pre-tx total flux and Unt. normalized total flux, with representative images. Percentages indicate the fraction of tumors with values <0.0001; n= 11–17 mice/experimental group, performed in four independent experiments. Post-tx tumor c volumes, d weights, and e gross images, mice n= 3–4/group. Data represented as mean ± S.E.M. Statistical significance was determined by a Log-rank test, c, d two-tailed Student’s t-test. **P < 0.01
Fig. 5
Fig. 5
Combination CP1 and anti-PD-1 immunotherapy is efficacious in treating a novel orthotopic advanced prostate cancer model. In vitro comparison of Myc-CaP and Myc-CaP PTEN KO cell lines by a western blot (p-AKT = phosphorylated AKT, AR = androgen receptor), b flow cytometry, c growth rate by MTS assays in normal media (10%), low serum (1%), and charcoal stripped (C.S.) FBS, performed in triplicates, and as d 3-dimensional organoids, performed in sextuplicates. Myc-CaP PTEN KO e Kaplan–Meier survival curve, n= 7 mice/experimental group, performed in two independent experiments, and f tumor volumes, n= 3–6 mice/experimental group. Data represented as mean ± S.E.M. Statistical significance was determined by c two-way ANOVA, d two-tailed Student’s t-test, e Log-rank test, f one-way ANOVA. *P < 0.05, **P < 0.01, ***P < 0.001
Fig. 6
Fig. 6
CP1 increases TILs and T cell cytotoxicity while decreasing Tregs in Myc-CaP PTEN KO tumors. a IHC with representative images, quadruplicate FOVs scored per sample (scale bar, 100 μm). bf Flow cytometry analyses of tumors or dLNs with representative flow cytometry plots; n= 3–4 mice/experimental group. Data represented as mean ± S.E.M. Statistical significance was determined by a one-way ANOVA, bf two-tailed Student’s t-test. *P < 0.05, **P < 0.01, ****P < 0.0001
Fig. 7
Fig. 7
CP1 therapeutic efficacy is dependent on its recruitment of TILs. Myc-CaP PTEN KO tumor bearing mice untreated or treated with FTY720, CP1 and anti-PD-1 antibody, or CP1 and anti-PD-1 antibody and FTY720. a IHC with representative images, quadruplicate FOVs scored per sample (scale bar, 100 μm). bd Flow cytometry analyses of tumors. Post-tx tumor e volumes and f gross images; n = 4–6 mice/experimental group. Data represented as mean ± S.E.M. Statistical significance was determined by ad one-way ANOVA, e two-tailed Student’s t-test. *P < 0.05, **P < 0.01, ****P < 0.0001
Fig. 8
Fig. 8
CP1 is a tissue-specific and multi-faceted immunotherapeutic tool. a Intra-urethrally administered CP1 colonized tumor tissue and increases CD8 and CD4 TILs, T cell cytotoxic function via IFNγ, granzyme B, perforin, and TNFα expression, skews the Th17/Treg axis to increase Th17 cells and decrease Treg TILs, increases tumor infiltration of mature DCs, M1 macrophages, NK cells, and γδ T cells, decreases intra-tumoral VEGF and IL-6 and increases IFNγ, TNFα, and MIP-2, and directly kills cancer cells with induction of immunogenic cell death (ICD). b CP1 reprograms non-immunogenic “cold” prostate tumor microenvironment and sensitizes tumors to anti-PD-1 blockade, resulting in decreased tumor burden and increased survival

References

    1. Tumeh PC, et al. PD-1 blockade induces responses by inhibiting adaptive immune resistance. Nature. 2014;515:568–571. doi: 10.1038/nature13954. - DOI - PMC - PubMed
    1. Champiat S, Ferte C, Lebel-Binay S, Eggermont A, Soria JC. Exomics and immunogenics: bridging mutational load and immune checkpoints efficacy. Oncoimmunology. 2014;3:e27817. doi: 10.4161/onci.27817. - DOI - PMC - PubMed
    1. Lawrence MS, et al. Mutational heterogeneity in cancer and the search for new cancer-associated genes. Nature. 2013;499:214–218. doi: 10.1038/nature12213. - DOI - PMC - PubMed
    1. Siegel RL, Miller KD, Jemal A. Cancer statistics, 2016. CA Cancer J. Clin. 2016;66:7–30. doi: 10.3322/caac.21332. - DOI - PubMed
    1. Kwon ED, et al. Ipilimumab versus placebo after radiotherapy in patients with metastatic castration-resistant prostate cancer that had progressed after docetaxel chemotherapy (CA184-043): a multicentre, randomised, double-blind, phase 3 trial. Lancet Oncol. 2014;15:700–712. doi: 10.1016/S1470-2045(14)70189-5. - DOI - PMC - PubMed

Publication types

MeSH terms

LinkOut - more resources