. 2018 Apr 23;8(1):6412.
doi: 10.1038/s41598-018-24501-0.

Structural and kinetic basis for the selectivity of aducanumab for aggregated forms of amyloid-β

Affiliations

Structural and kinetic basis for the selectivity of aducanumab for aggregated forms of amyloid-β

Joseph W Arndt et al. Sci Rep. .

Abstract

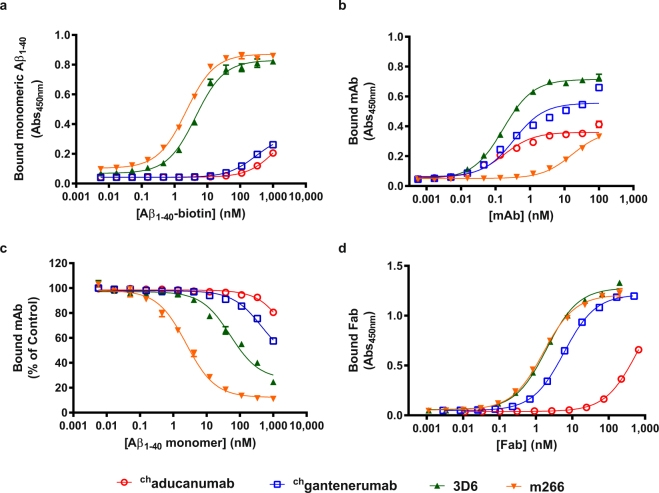
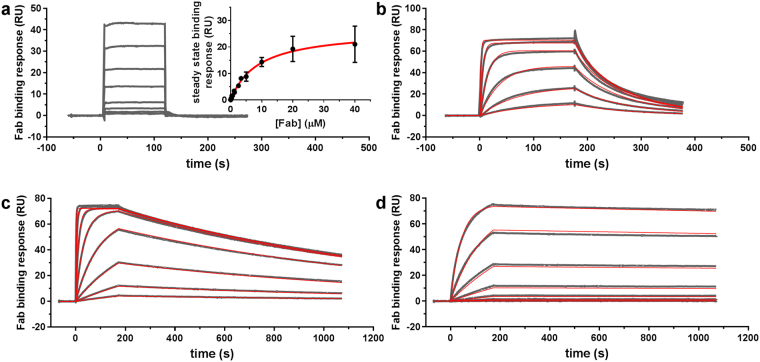
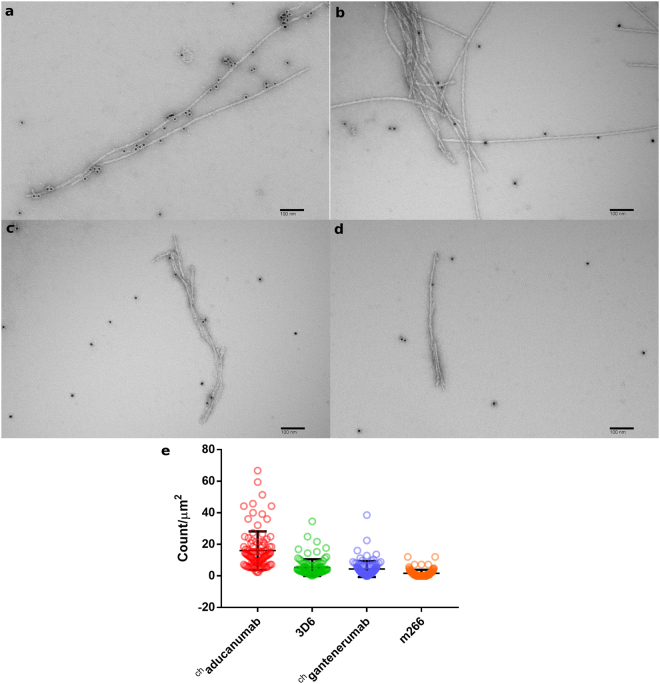
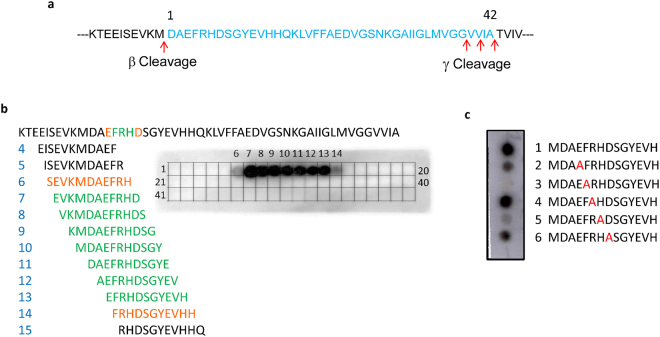
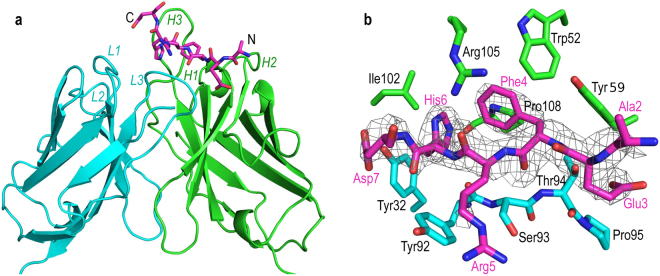
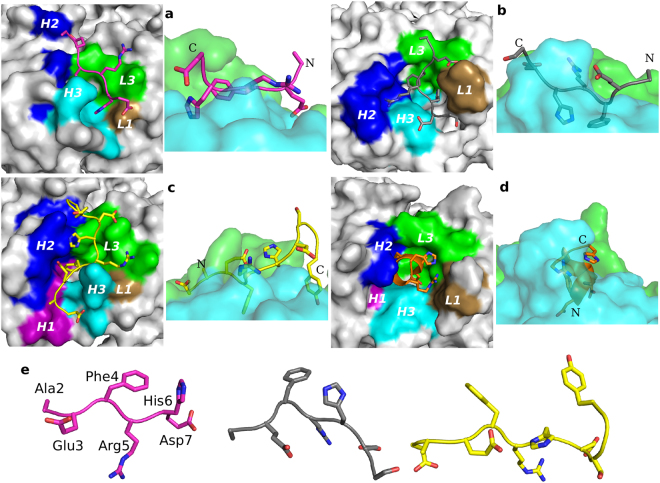
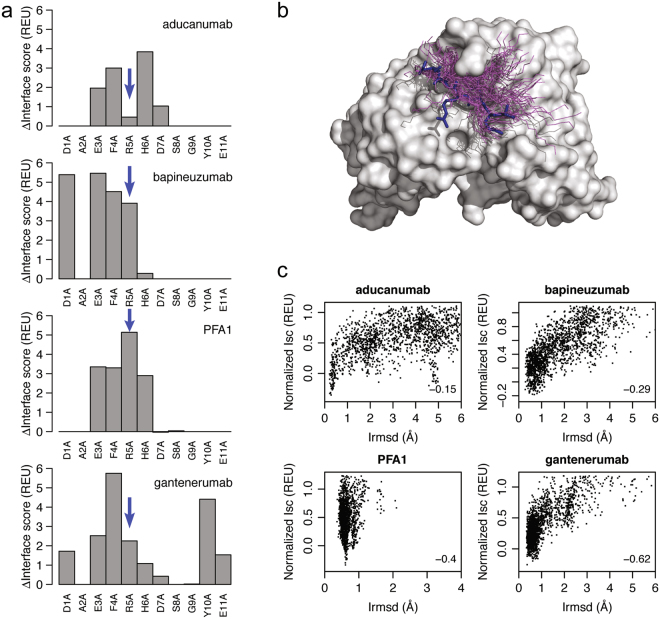
Aducanumab, a human-derived antibody targeting amyloid-β (Aβ), is in Phase 3 clinical trials for the treatment of Alzheimer's disease. Biochemical and structural analyses show that aducanumab binds a linear epitope formed by amino acids 3-7 of the Aβ peptide. Aducanumab discriminates between monomers and oligomeric or fibrillar aggregates based on weak monovalent affinity, fast binding kinetics and strong avidity for epitope-rich aggregates. Direct comparative studies with analogs of gantenerumab, bapineuzumab and solanezumab demonstrate clear differentiation in the binding properties of these antibodies. The crystal structure of the Fab fragment of aducanumab bound to its epitope peptide reveals that aducanumab binds to the N terminus of Aβ in an extended conformation, distinct from those seen in structures with other antibodies that target this immunodominant epitope. Aducanumab recognizes a compact epitope that sits in a shallow pocket on the antibody surface. In silico analyses suggest that aducanumab interacts weakly with the Aβ monomer and may accommodate a variety of peptide conformations, further supporting its selectivity for Aβ aggregates. Our studies provide a structural rationale for the low affinity of aducanumab for non-pathogenic monomers and its greater selectivity for aggregated forms than is seen for other Aβ-targeting antibodies.


Conflict of interest statement

Biogen funded these studies. J.W.A., C.Q., F.Q., P.H.W., K.P.K., T.W., B.A.S., R.B.P., T.O.C., S.H. and T.B. are employees and, except T.W., shareholders of Biogen.

Figures

Figure 1
Figure 1
Binding of anti-Aβ antibodies to Aβ polymorphic variants. The binding specificity of aducanumab (red open circle), gantenerumab (blue open square), 3D6 (green triangle) and m266 (inverted orange triangle) for soluble and aggregated forms of Aβ were assessed by ELISA using antibody constructs engineered with chimeric mIgG2 constant regions for all antibodies and with parental murine variable regions for bapineuzumab and solanezumab and with purified Fab fragments enzymatically generated from the mAbs with papain. ELISA results assessing binding of soluble biotinylated Aβ1-40 to immobilized antibodies (a), antibodies to immobilized Aβ1-42 fibrils (b), solution competition of antibodies to immobilized Aβ1-42 oligomers by soluble monomeric Aβ1-40 (c), and Fabs to biotinylated soluble Aβ1-40, using streptavidin-coated plates (d). Each point is the average of two measurements ± standard deviation (SD). Data were fit to a sigmoidal curve. EC50 values were calculated from the binding curves (Table 2).
Figure 2
Figure 2
Surface plasmon resonance analysis of the binding of anti-Aβ antibody Fab fragments to Aβ1-40-biotin immobilized on a biotin-capture sensor chip surface. Sensorgrams for (a) chaducanumab Fab (0.31, 0.62, 1.25, 2.5, 5, 10, 20 and 40 μM), (b) chgantenerumab Fab (5, 14, 41, 120, 370 and 1,100 nM), (c) 3D6 Fab (0.5, 1.5, 5, 14, 41, 120, 370 and 1,100 nM), and (d) m266 Fab (0.5, 1.5, 5, 14, 41, 120, 370 and 1,100 nM) are shown (grey curves) with corresponding fits to a 1:1 binding model (red curves). Fabs were injected over an Aβ1-40-biotin coated sensor chip for 2 min in (a) and 3 min in (bd), where the rising response describes the approach to steady state binding and beyond which the response drops due to dissociation of the Fabs. In (a), the binding and dissociation kinetics could not be determined, but the equilibrium dissociation constant was evaluated from fitting the steady state binding response (inset). Calculated kinetics and affinity constants are listed in Table 2.
Figure 3
Figure 3
Negative-stain electron microscopy of Aβ1-40 fibrils incubated with gold-conjugated anti-Aβ antibodies. Aβ1-40 fibrils were incubated with gold-conjugated chaducanumab (a), 3D6 (b), chgantenerumab (c) and m266 (d). 100 images were collected for each sample. A representative image for each data set is shown. Scale bars are 100 nm. (e) Labeling densities were calculated as the number of fibril-associated gold particles (distance of ≤10 nm to fibril) per 1 μm2 for each image, with mean ± SD for each group. The differences in the gold-labeled antibodies binding to Aβ fibrils were tested with a one-way ANOVA. P values of <0.0001 indicate significant differences between chaducanumab vs. 3D6, chgantenerumab and m266.
Figure 4
Figure 4
Identification of the binding site for aducanumab in Aβ using synthetic peptides. (a) The Aβ1-42 sequence (blue) shown in the context of flanking APP sequences with positions of the β- and γ-secretase cleavage sites indicated. (b and c) Binding of aducanumab to peptides immobilized on cellulose membranes. (b) Peptide array of overlapping 11-residue peptides spanning the entire 52 amino acid APP fragment. The sequences are numbered per their positions on the blot. Shown are the subset of peptide sequences that span the binding site and are colored based on their aducanumab binding signal. Black – no binding; orange – partial binding; green – full binding. (c) Alanine substitution analysis of Aβ1-13-containing synthetic peptides using immunoblotting. Sequences of wild-type and alanine-substituted peptides are numbered.
Figure 5
Figure 5
Structure of AduFab with bound Aβ1-11 peptide. (a) Cartoon representation of AduFab showing heavy chain in green, light chain in cyan, and Aβ1-11 peptide in magenta, with nitrogen and oxygen atoms displayed in blue and red, respectively. L1 to L3 and H1 to H3 indicate the CDRs in the light and heavy chain, respectively. (b) Detailed view of the binding interface between AduFab and the Aβ1-11 peptide, with key interface residues of AduFab within 4 Å of the Aβ peptide shown and labeled. An omit electron density map contoured at 3.0 σ is shown as mesh and superposed on the Aβ peptide.
Figure 6
Figure 6
Comparison of the binding modes of antibodies targeting the N terminus of Aβ. (a) Aducanumab with Aβ peptide shown in magenta, (b) PFA1 with Aβ peptide shown in grey, (c) gantenerumab with Aβ peptide shown in yellow, and (d) bapineuzumab with Aβ peptide shown in orange. The crystal structure of each Fab/Aβ peptide complex is shown in two ways. The left panels show a top view of the Fab in surface representation looking down onto the binding paratope. Residues in the CDR of the heavy chain (H) and light chain (L) that contact the Aβ peptide are shown and the CDRs are highlighted in color: H1 in purple, H2 in blue, H3 in cyan, L1 in tan and L3 in green. The right panels show a side view of the Fab in transparent surface representation, with the heavy chain shown in green and the light chain in cyan. (e) Comparison of the Aβ peptide conformations when bound to aducanumab, PFA1 or gantenerumab (left to right). Residues 2–7 of the Aβ peptide are labeled.
Figure 7
Figure 7
In silico interface and docking analyses. (a) In silico alanine scanning of Aβ residues seen in crystal structures of peptides bound to anti-Aβ antibodies. ∆Interface scores, an approximation of changes in the binding energy upon mutation (∆∆Gbinding), are shown in Rosetta Energy Units (REU) for each Aβ residue resolved in the crystal structure of a Fab/Aβ complex. The blue arrows highlight differences in binding of the antibodies to Aβ residue Arg5. (b) Diversity of Aβ conformations obtained from computationally docking the Aβ peptide to the Fab of aducanumab. Only the Aβ backbones are shown for the models (magenta). The Aβ conformation seen in the crystal structure is highlighted in blue. (c) Docking plots of the Fab/Aβ complexes. The discrimination scores, which quantify the docking performance, are shown in the bottom right corner of the plots.

References

    1. Selkoe DJ, Abraham CR, Podlisny MB, Duffy LK. Isolation of low-molecular-weight proteins from amyloid plaque fibers in Alzheimer’s disease. J Neurochem. 1986;46:1820–1834. doi: 10.1111/j.1471-4159.1986.tb08501.x. - DOI - PubMed
    1. Bayer T, Wirths O. Focusing the amyloid cascade hypothesis on N-truncated Aβ peptides as drug targets against Alzheimer’s disease. Acta Neuropathol. 2014;127:787–801. doi: 10.1007/s00401-014-1287-x. - DOI - PMC - PubMed
    1. Selkoe DJ, Hardy J. The amyloid hypothesis of Alzheimer’s disease at 25years. EMBO Molecular Medicine. 2016;8:595–608. doi: 10.15252/emmm.201606210. - DOI - PMC - PubMed
    1. Polanco JC, et al. Amyloid-β and tau complexity - towards improved biomarkers and targeted therapies. Nat Rev Neurol. 2018;14:22–29. doi: 10.1038/nrneurol.2017.162. - DOI - PubMed
    1. Mullard A. Alzheimer amyloid hypothesis lives on. Nat Rev Drug Discov. 2016;16:3–5. doi: 10.1038/nrd.2016.281. - DOI - PubMed

Publication types

MeSH terms