. 2018 Apr 23;9(1):1590.
doi: 10.1038/s41467-018-03539-8.

Chromatin conformation regulates the coordination between DNA replication and transcription

Affiliations

Chromatin conformation regulates the coordination between DNA replication and transcription

Ricardo Almeida et al. Nat Commun. .

Abstract

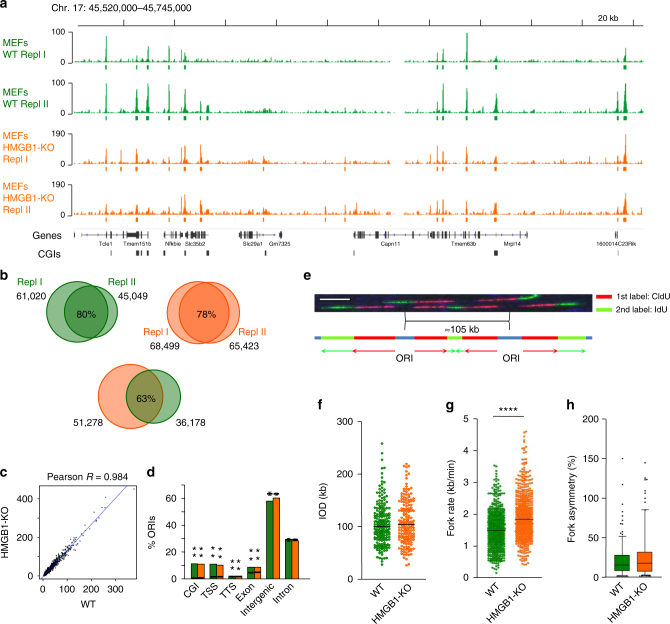
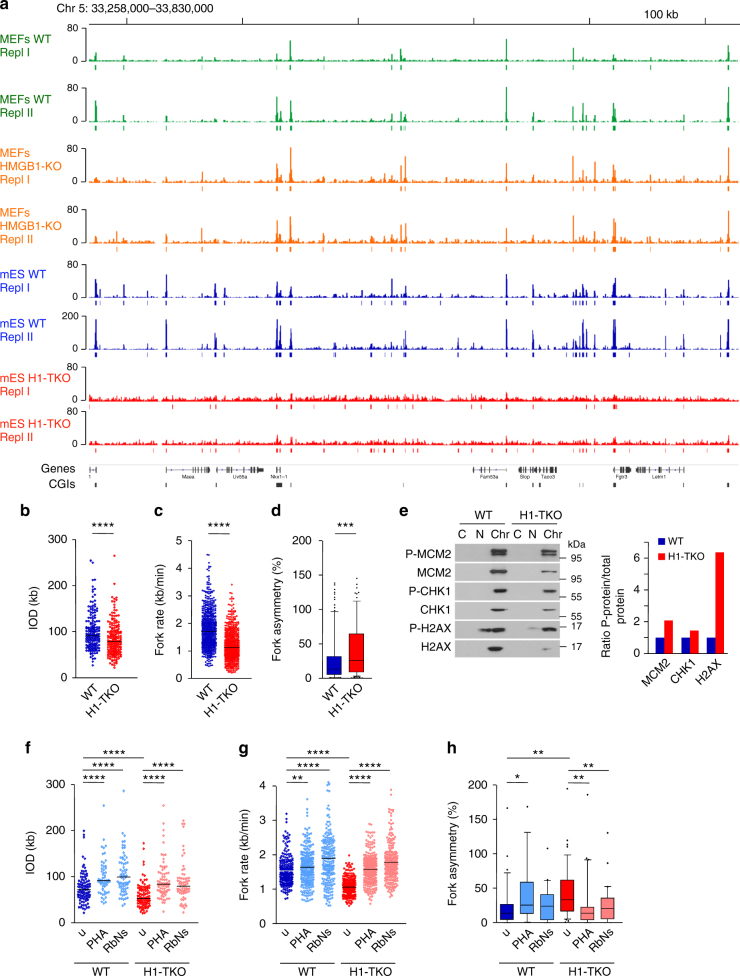
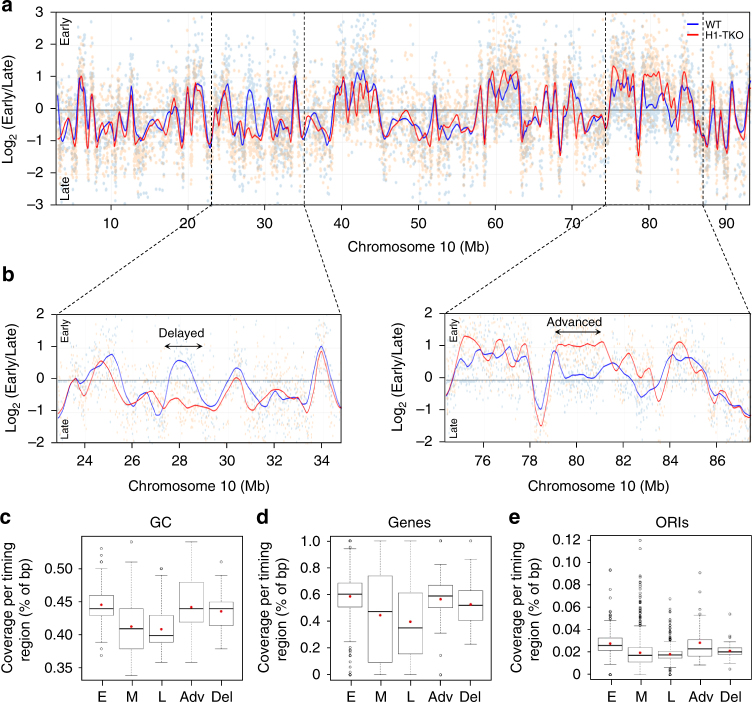
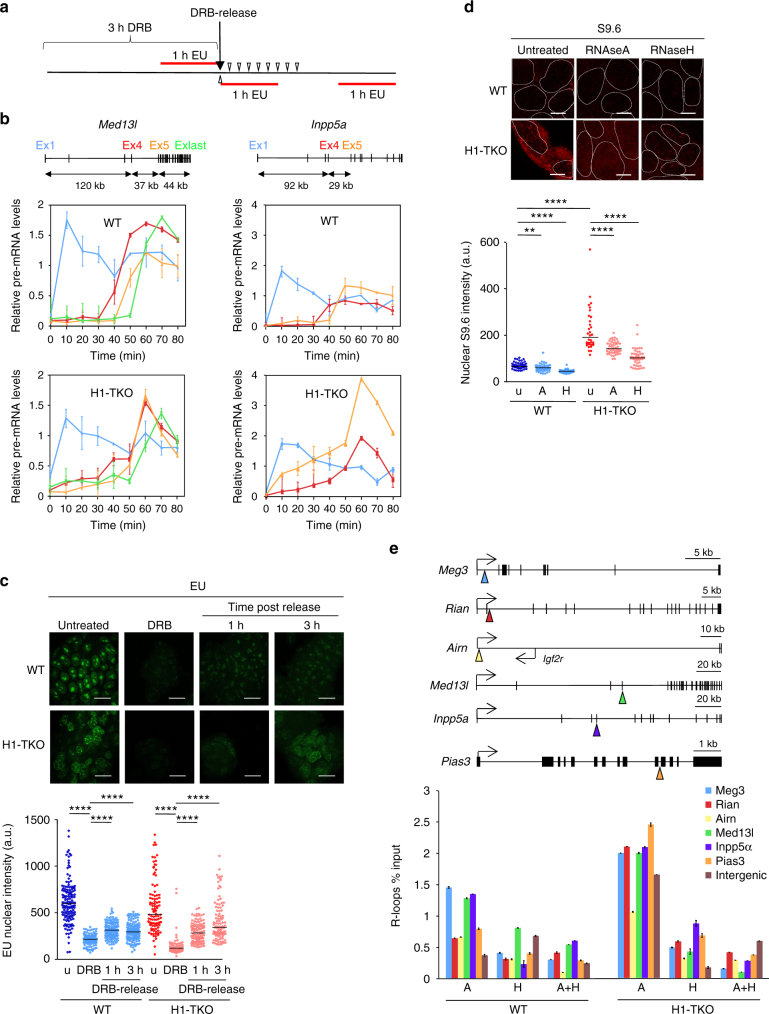
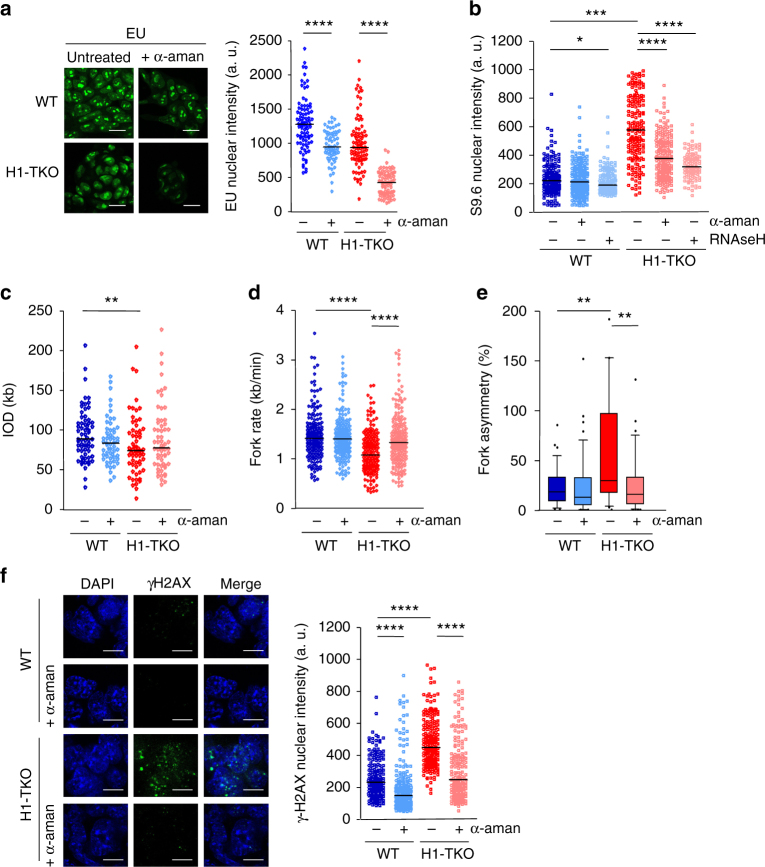
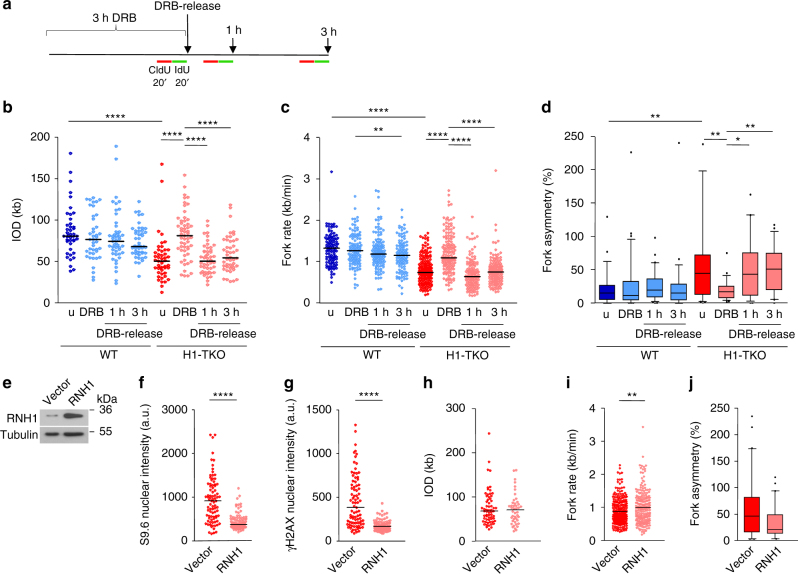
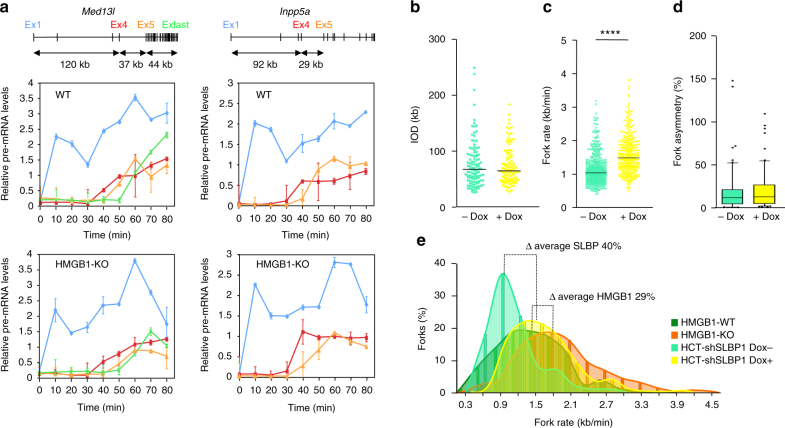
Chromatin is the template for the basic processes of replication and transcription, making the maintenance of chromosomal integrity critical for cell viability. To elucidate how dividing cells respond to alterations in chromatin structure, here we analyse the replication programme of primary cells with altered chromatin configuration caused by the genetic ablation of the HMGB1 gene, or three histone H1 genes. We find that loss of chromatin compaction in H1-depleted cells triggers the accumulation of stalled forks and DNA damage as a consequence of transcription-replication conflicts. In contrast, reductions in nucleosome occupancy due to the lack of HMGB1 cause faster fork progression without impacting the initiation landscape or fork stability. Thus, perturbations in chromatin integrity elicit a range of responses in the dynamics of DNA replication and transcription, with different consequences on replicative stress. These findings have broad implications for our understanding of how defects in chromatin structure contribute to genomic instability.


Conflict of interest statement

The authors declare no competing interests.

Figures

Fig. 1
Fig. 1
Replication initiation landscape and dynamics in cells with reduced nucleosome occupancies. a Representative IGV snapshot showing the SNS-Seq coverage and ORI locations from two biological replicates derived from 300 to 1500 nt SNS purified from wild-type (WT) MEFs (green tracks, upper two rows) or HMGB1-KO MEF cells (orange tracks, lower two rows). Colour rectangles below each track mark the position of the identified ORIs in each replicate. An additional representative genomic region is shown in Fig. 2a. b Venn diagrams showing the overlaps of common ORIs identified between replicates in WT (green) or HMGB1-KO cells (orange) and between both genotypes. c Pair-wise correlation of ORI number per genomic segment between WT and HMGB1-KO MEFs. d ORI enrichments at annotated genomic features in each cell type. Significances were calculated relative to randomized controls (depicted by black lines). The P value denotes the proportion of the randomization distribution that is larger than the observed test statistic. **P < 0.001. e Representative example of DNA fibres labelled sequentially for 20 min with CldU (red) and IdU (green) used to estimate inter-origin distances (IOD), fork rates and fork asymmetries. Scale bar, 10 μm. f IODs, g fork rates and h percentage of fork asymmetry calculated from stretched fibres as those shown in e. Median values are indicated. Data are pooled from three replicate experiments (n = 3). Fork asymmetry is expressed as the ratio of the longest distance covered to the shortest, for each pair of sister replication forks. Box-plots spans the interquartile range and the inside segment show the median value. Whiskers above and below the box show the locations of the 90th and 10th percentile, respectively. Data not included between the whiskers are plotted as outliers (dots). Differences between distributions were assessed with the Mann–Whitney rank sum test. ****P < 0.0001. See Supplementary Fig. 1b-e for full data analysis and numerical values
Fig. 2
Fig. 2
Replication initiation landscape and dynamics in cells with 50% reduction in histone H1 levels. a Representative IGV snapshot showing the SNS-Seq coverage and identified ORIs from two biological replicates derived from 300 to 1500 nt SNS purified from wild-type (WT) mES (blue tracks) or H1-TKO mES cells (red tracks). Data from MEFs WT and HMGB1-KO SNS-Seq are also shown for comparison (green and orange tracks). b IODs, c fork rates and d percentage of fork asymmetry calculated from stretched fibres from WT and H1-TKO cells. See Supplementary Fig. 1g-j for full data analysis and numerical values. Data are pooled from three replicate experiments (n = 3). Box-plots definitions are as in Fig. 1h. e Protein levels of P-MCM2, MCM2, P-CHK1, CHK1, P-H2AX and H2AX at the cytosolic (C), nucleoplasmic (N) and chromatin (Chr) fraction of both cell types. The quantification of the phosphorylated band intensity normalized to the corresponding total band intensity for each sample is shown on the right. f IODs, g fork rates and h % of fork asymmetry upon treating both cell types with PHA-767491 (PHA) or ribonucleosides (RbNs) for 100 min. Median values are indicated (n = 2). Differences between distributions were assessed with the Mann–Whitney rank sum test. ****P < 0.0001; ***P < 0.001; **P < 0.01; *P < 0.05. See Supplementary Fig. 4b for numerical values
Fig. 3
Fig. 3
Replication-timing profiling of WT and H1-TKO mES cells. a Exemplary replication-timing profile of a large segment of Chromosome 10. Raw values for probe log ratios [log2(Early/Late)] and the local polynomial Loess smoothing curve from two replicate experiments of mES WT (blue) and mES H1-TKO (red) are shown. b Enhanced view of the two regions marked in a showing an exemplary delayed and advanced timing region in H1-TKO cells. See Supplementary Data 1 for the genomic location and features of the 97 regions with altered replication timing in H1-TKO cells. Coverage analysis of GC content (c), gene density (d) and ORIs (e) in the early (E), middle (M), late (L), advanced (Adv) and delayed (Del) replication-timing domains (% of bp). Box-plots definitions are as in Fig. 1h. Median values are indicated by a black line and means by a red dot. Data not included between the whiskers are plotted as outliers (empty dots)
Fig. 4
Fig. 4
H1-TKO cells display impaired transcription dynamics. a Diagram of the experimental design to measure transcription elongation rates by transient inhibition of initiating RNAPIIs with DRB. Three hours after DRB incubation, the drug was washed-off to resume transcription elongation and total RNA was extracted from identical number of cells at the indicated time-points (open triangles). Global nascent transcription was evaluated by 1h-EU labelling at the indicated time points (red lines). b Time course transcription elongation measurements at the Med13l and Inpp5a genes in WT mES (upper panels) and H1-TKO mES cells (lower panels). Levels of pre-mRNA at the indicated times were determined by RT-qPCR at the positions marked in the gene maps above the graphs. Pre-mRNA values were normalized to the values of the non-DRB-treated sample. Results are shown as means ± s.d. from two independent experiments (n = 2). c Representative images of EU staining (top) and distribution of EU nuclear intensity during DRB treatment and upon drug-release at the time points shown in the experimental scheme in a (bottom). Scale bar, 20 μm. Statistical analyses and normalized values to those obtained at untreated cells are shown in Supplementary Fig. 6a. d Representative images of S9.6 immunostaining ±RNAseA or +-RNAseH incubation (top) and distribution of S9.6 nuclear intensity (bottom) in WT and H1-TKO cells. Scale bar, 10 μm. Nuclear segmentation (white lines) was based on DAPI staining. Median values are indicated (n = 2). See Supplementary Fig. 6b for numerical values and Supplementary Fig. 6c-d for S-phase distribution of S9.6 and γH2AX nuclear intensities. Differences between distributions were assessed with the Mann–Whitney rank sum test. ****P < 0.0001; ***P < 0.001; **P < 0.01. e DRIP analysis of R-loop enrichment at the indicated genes and at an intergenic control region. Primer positions are shown by colour triangles on the gene maps. Values are % of input from samples treated with RNAseA (A), RNAseH (H) or both (A + H). Means ± s.d. from two independent experiments are shown (n = 2). See Supplementary Table 1 for primer pair sequences and qPCR conditions
Fig. 5
Fig. 5
RNAPII inhibition suppresses the replication phenotypes of H1-TKO cells. a Representative images and quantification of nuclear EU staining of WT and H1-TKO cells untreated or treated with a-amanitin for 6 h. Scale bar, 20 μm. b Distribution of S9.6 nuclear intensity ±RNAseH incubation in WT mES and H1-TKO mES cells untreated or treated with a-amanitin. Data are pooled from two independent experiments (n = 2). Median values are indicated. c IODs, d fork rates and e % of fork asymmetry calculated from stretched fibres of cells untreated or treated with a-amanitin. f Representative images of γH2AX foci (left) and distribution of γH2AX intensity per nucleus (right) in cells untreated or treated with a-amanitin. Scale bar, 10 μm. Median values are indicated. Data are pooled from two independent experiments (n = 2). Differences between distributions were assessed with the Mann–Whitney rank sum test. ****P < 0.0001; ***P < 0.001; **P < 0.01; *P < 0.05. See Supplementary Fig. 7a-d for numerical values
Fig. 6
Fig. 6
Suppression of the replicative stress of H1-TKO cells by RNAPII inhibition is immediately reverted upon transcription re-start. a Diagram of the experimental design to measure replication dynamics by transient inhibition of initiating RNAPIIs with DRB. Cells were labelled sequentially for 20 min with CldU (red) and IdU (green) at the indicated time points before fibre stretching. b IODs, c fork rates and d % of fork asymmetry from WT (blue) and H1-TKO (red) cells untreated (u), treated with DRB for 3 h (DRB) and released from the DRB block (1 h and 3 h DRB-release) as shown in a (n = 2). e Protein levels of RNAse H1 (RNH1) and TUBULIN in H1-TKO cells transfected either with control (vector) or RNAseH1-overexpression vector (RNH1). f, g Distribution of S9.6 and γH2AX nuclear intensities in the same cells (vector, red plots; RNH1, pink plots). h IODs, i fork rates and j % of fork asymmetry of the same cells. Median values are indicated (n = 2). Differences between distributions were assessed with the Mann–Whitney rank sum test. ****P < 0.0001; ***P < 0.001; **P < 0.1; *P < 0.2. See Supplementary Fig. 7e-g for numerical values. Box-plots definitions are as in Fig. 1h
Fig. 7
Fig. 7
Reduced histone content allows faster rates of replication and transcription. a Time course transcription elongation measurements at the Med13l and Inpp5a genes in WT MEFs (upper panels) and HMGB1-KO MEFs cells (lower panels) following the experimental design depicted in Fig. 4a. Levels of pre-mRNA at the indicated times were determined by RT-qPCR at the positions marked in the gene maps above the graphs. Pre-mRNA values were normalized to the values of the non-DRB-treated sample. Results are shown as means ± s.d. from two independent experiments (n = 2). b IODs, c fork rates and d percentage of fork asymmetry calculated from stretched fibres of HCT-shSLBP.1 cells cultured in the absence (light green) or presence (yellow) of Doxicyclin (Dox) for 72 h. Median values are indicated. Data are representative of two replicate experiments and pooled (n = 2). Differences between distributions were assessed with the Mann–Whitney rank sum test. ****P < 0.0001. See Supplementary Fig. 8b for numerical values. Box-plots definitions are as in Fig. 1h. e Distribution of replication fork speeds in cells with reduced histone content relative to their respective WT counterparts

Similar articles

Cited by

References

    1. Devbhandari S, Jiang J, Kumar C, Whitehouse I, Remus D. Chromatin constrains the initiation and elongation of DNA replication. Mol. Cell. 2017;65:131–141. doi: 10.1016/j.molcel.2016.10.035. - DOI - PMC - PubMed
    1. Kurat CL, Yeeles JT, Patel H, Early A, Diffley JF. Chromatin controls DNA replication origin selection, lagging-strand synthesis, and replication fork rates. Mol. Cell. 2017;65:117–130. doi: 10.1016/j.molcel.2016.11.016. - DOI - PMC - PubMed
    1. Luger K, Mader AW, Richmond RK, Sargent DF, Richmond TJ. Crystal structure of the nucleosome core particle at 2.8A resolution. Nature. 1997;389:251–260. doi: 10.1038/38444. - DOI - PubMed
    1. Nalabthula N, et al. The chromatin architectural proteins HMGD1 and H1 bind reciprocally and have opposite effects on chromatin structure and gene regulation. BMC Genom. 2014;15:92. doi: 10.1186/1471-2164-15-92. - DOI - PMC - PubMed
    1. Panday A, Grove A. Yeast HMO1: linker histone reinvented. Microbiol. Mol. Biol. Rev. 2017;81:e00037–16. doi: 10.1128/MMBR.00037-16. - DOI - PMC - PubMed

Publication types

MeSH terms