. 2018 Jun;14(6):591-600.
doi: 10.1038/s41589-018-0044-1. Epub 2018 Apr 23.

Direct multiplex imaging and optogenetics of Rho GTPases enabled by near-infrared FRET

Affiliations

Direct multiplex imaging and optogenetics of Rho GTPases enabled by near-infrared FRET

Daria M Shcherbakova et al. Nat Chem Biol. 2018 Jun.

Erratum in

Abstract

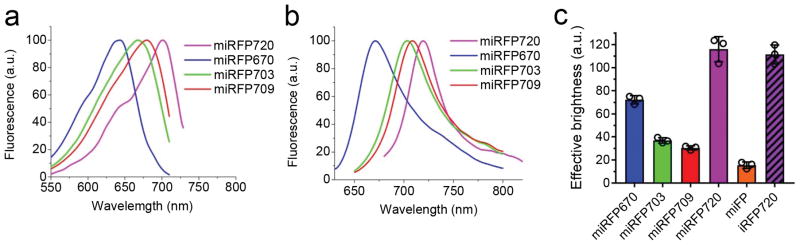
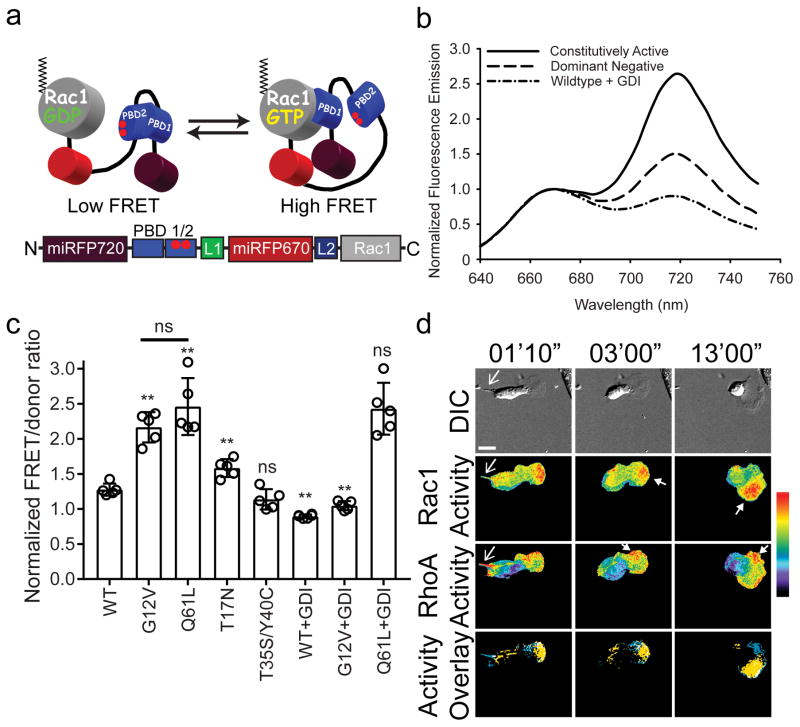
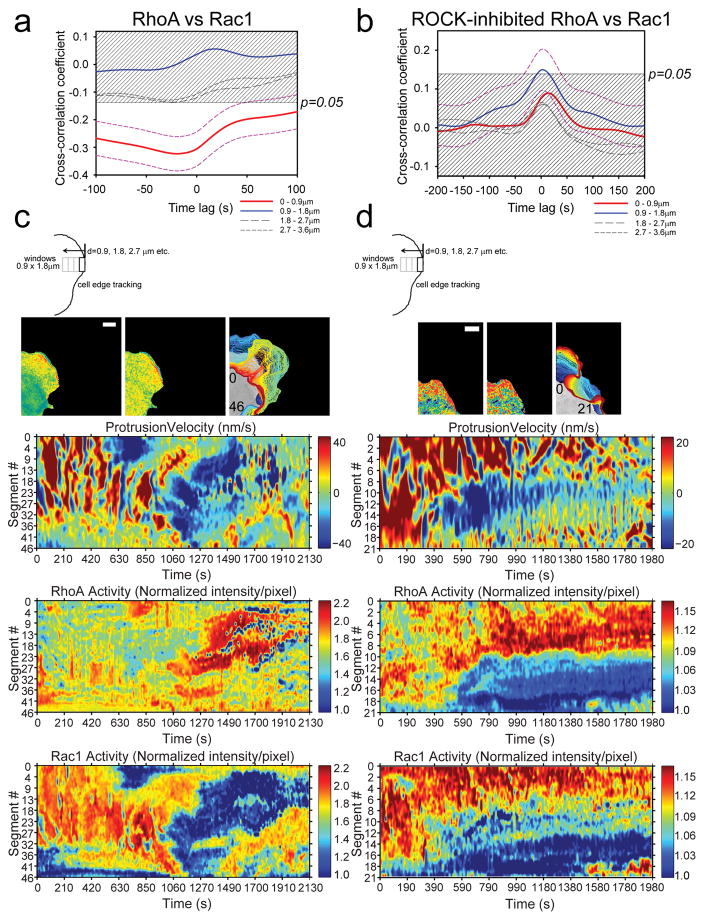
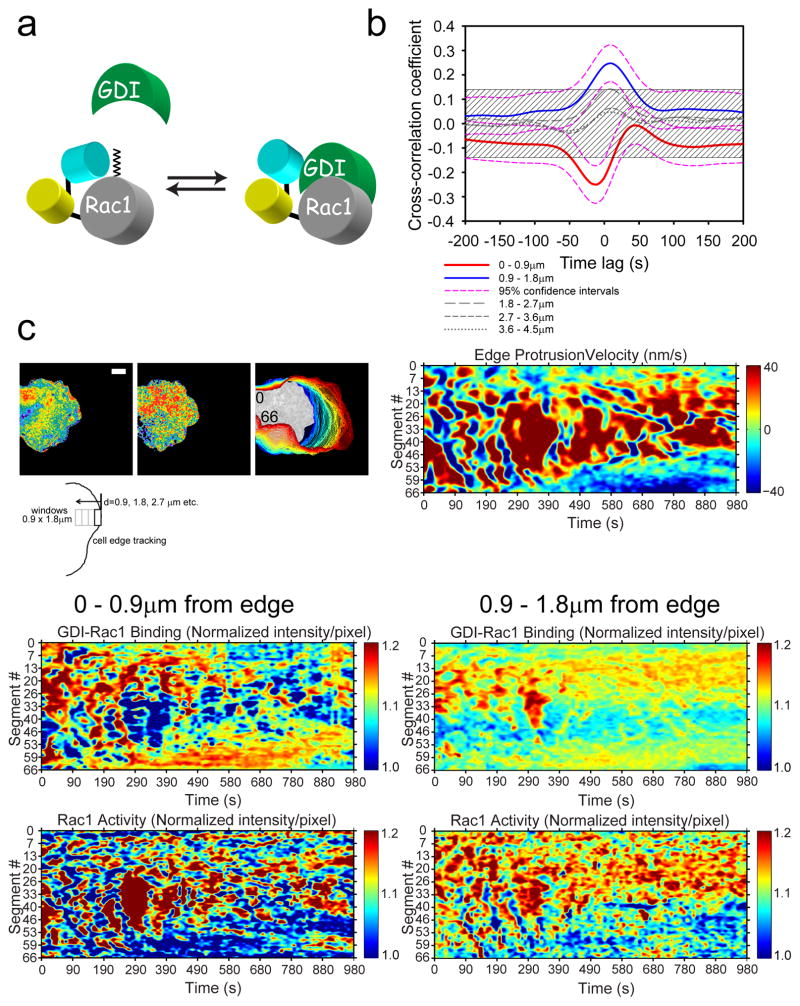
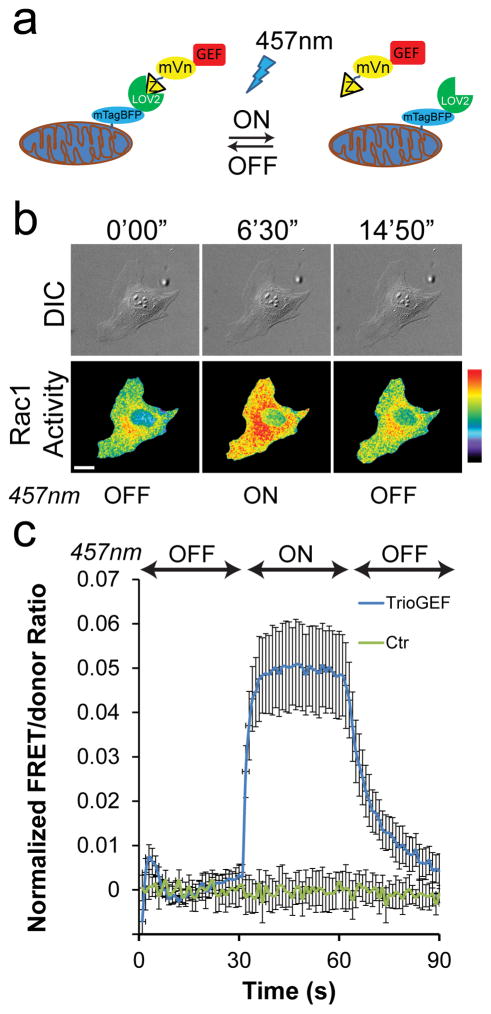
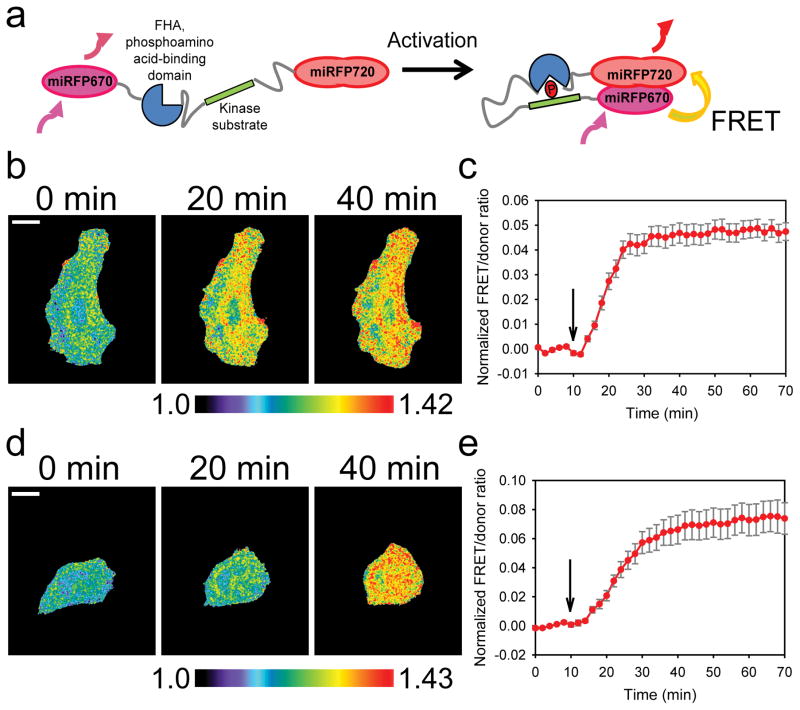
Direct visualization and light control of several cellular processes is a challenge, owing to the spectral overlap of available genetically encoded probes. Here we report the most red-shifted monomeric near-infrared (NIR) fluorescent protein, miRFP720, and the fully NIR Förster resonance energy transfer (FRET) pair miRFP670-miRFP720, which together enabled design of biosensors compatible with CFP-YFP imaging and blue-green optogenetic tools. We developed a NIR biosensor for Rac1 GTPase and demonstrated its use in multiplexed imaging and light control of Rho GTPase signaling pathways. Specifically, we combined the Rac1 biosensor with CFP-YFP FRET biosensors for RhoA and for Rac1-GDI binding, and concurrently used the LOV-TRAP tool for upstream Rac1 activation. We directly observed and quantified antagonism between RhoA and Rac1 dependent on the RhoA-downstream effector ROCK; showed that Rac1 activity and GDI binding closely depend on the spatiotemporal coordination between these two molecules; and simultaneously observed Rac1 activity during optogenetic manipulation of Rac1.


Conflict of interest statement

Competing financial interests: The authors declare no competing financial interests.

Figures

Figure 1
Figure 1. Characterization of the engineered monomeric miRFP720
(a) Fluorescence excitation and (b) fluorescence emission spectra of miRFP720 (magenta) overlaid with spectra of other monomeric NIR FPs, such as miRFP670 (blue), miRFP703 (green) and miRFP709 (red). (c) NIR fluorescence brightness of live HeLa cells transiently transfected with miRFP720 (magenta, open bar) compared to that of parental dimeric iRFP720 (magenta, shaded bar) and other monomeric NIR FPs, such as miRFP670 (blue), miRFP703 (green), miRFP709 (red) and mIFP (orange), analyzed using flow cytometry. NIR fluorescence intensity was normalized to transfection efficiency (fluorescence intensity of co-transfected EGFP), to excitation efficiency of each NIR FP with 635 nm laser, and to fluorescence signal of each NIR FP in the emission filter. Error bars, S.D. (mean of n=3; independent experiments).
Figure 2
Figure 2. NIR-Rac1 biosensor for live cell imaging
(a) Schematic of the single-chain NIR-Rac1 biosensor design. From N- to C-terminus: Dark red: miRFP720; PBD1: p21 binding domain 1; PBD2: p21 binding domain containing H83D-H86D GTPase binding deficient mutations; Red: miRFP670; full length Rac1. This orientation enables posttranslational isoprenylation of the C-terminus, thus maintaining the native interaction with appropriate membrane domains and the guanine nucleotide dissociation inhibitor (GDI). GTP versus GDP-loading of Rac1 changes the intramolecular conformation and affects FRET. (b) Representative normalized fluorescence emission spectra of constitutively activated, dominant negative, and wildtype NIR-Rac1 biosensors expressed with excess GDI. Spectra are measured by exciting the NIR-Rac1 sensor mutants expressed in cell suspensions at 600 nm wavelength, and are from the data analyzed and presented in (c), from 5 independent experiments. (c) Wildtype (WT) or mutant versions of NIR-Rac1 biosensor with or without 4× excess GDI. N=5 independent experiments shown with mean ±SEM. Student t-tests are two-tailed. ** WT vs G12V, p=2.626562×10⁻⁵; WT vs Q61L, p=2.158669×10⁻⁴; WT vs T17N, p=2.122228×10⁻³; WT vs T35S/Y40C, “ns”=not significant, p=0.1003134; G12V vs Q61L, p=0.1877456; WT vs WT+GDI, p=2.627320×10⁻⁶; G12V vs G12V+GDI, p=3.684825×10⁻⁶; and Q61L vs Q61L+GDI, p=0.9049651. (d) Representative timelapse panels of imaging RhoA and Rac1 in a single living MEF (additional time points are shown in Supplementary Fig. 11) from 16 cells from 6 independent experiments. 628/32 and 436/20 excitation filters were used for NIR and mCerulean-mVenus FRET excitation, respectively. 480/40 and 535/30 filter pair was used for mCerulean-mVenus FRET signal, whereas 684/24 and 794/160 filter pair was used for miRFP670-miRFP720 FRET signal. Top panels: Differential interference contrast. Middle two panels: Rac1 activity (upper) and RhoA activity (lower). Bottom panels: Localizations of high Rac1 (yellow) and high RhoA (blue) activities are overlaid, where regions of colocalization are shown in white. Regions of high Rac1 and RhoA activities were defined by intensity thresholding the top 2.5 % of pixel ratio values within the image intensity histogram. Regions and features of interest are indicated using matching colored arrowheads. White bar=20μm. Pseudocolor bar corresponds to ratio limits of 1.0 to 1.55 for Rac1 and 1.0 to 1.32 for RhoA activities (black to red).
Figure 3
Figure 3. Morphodynamic analysis of RhoA-Rac1 antagonism
(a) Cross-correlation coefficient as a function of timelags between RhoA and Rac1 activities in protruding edge of MEFs. Dashed magenta lines indicate 95% confidence interval (CI) for the cross-correlation function from the edge region (Red line: 0–0.9μm). The time difference between RhoA versus Rac1 biosensor response was −19.6s ±31.6s (±95% CI); i.e., RhoA activity onset precedes Rac1 activity onset by approximately 19.6s. 95% CI are omitted from the rest of plots for clarity. The shaded region indicates p>0.05. n=1250 individual sampling window segments were measured from 16 cells, from 6 independent experiments. (b) Example edge tracking evolution (top panels) from a single cell and associated morphodynamic maps of the velocity, RhoA and Rac1 activities (lower three panels). The edge velocity, RhoA activity, and Rac1 activity measured within window segments at the leading edge of a single representative cell are compiled on the Y-axes and followed in time on the X-axis. White bar=10μm. Example set taken from total of 16 cells, from 6 independent experiments. (c) Cross-correlation coefficient as a function of timelags between RhoA and Rac1 activities in protruding edge of MEFs with ROCK inhibitor Y-27632 treatment. Dashed magenta lines indicate 95% CI for the cross-correlation function from the region adjacent to the cell edge (Blue line: 0.9–1.8μm). 95% CI are omitted from the rest of plots for clarity. The shaded region indicates p>0.05. n=990 individual sampling window segments were measured from 18 cells, from 3 independent experiments. (d) Example edge tracking evolution (top panels) from a single cell and associated morphodynamic maps of the velocity, RhoA and Rac1 activities (lower three panels). White bar=10μm. Example set taken from 18 cells, from 3 independent experiments. The number inserts in the edge evolution panels in (b) and (d) indicate the orientation of the measurement window segments that correspond to the Y-axes of the morphodynamic maps as shown.
Figure 4
Figure 4. Morphodynamic analysis of Rac1 activity and Rac1-GDI binding
(a) Schematic drawing of the Rac1-GDI binding biosensor reported previously . The wildtype Rac1 is attached to the C-terminus of the FRET “antenna” that selectively detects the binding of Rac1 to GDI. (b) Cross-correlation coefficient as a function of timelags between Rac1-GDI binding and Rac1 activity in protruding edge of MEFs. Dashed magenta lines indicate 95% CI for the cross-correlation function of the edge and the next adjacent region away from the edge (Red line: 0–0.9μm; blue line: 0.9–1.8μm). The time differences between Rac1-GDI versus Rac1 biosensor response was −11.9s ±23s (±95% CI; Rac1-GDI biosensor response preceded Rac1 biosensor response) at the leading edge (Red line) and +9.6s ±25s (±95% CI; Rac1 activity preceded Rac1-GDI biosensor response) at the region adjacent to the edge (Blue line). 95% CI are omitted from the rest of plots for clarity. The shaded region indicates p>0.05. n=827 individual sampling window segments were measured from 10 cells from 3 independent experiments. (c) Example morphodynamic data set of a MEF imaged for Rac1 activity and Rac1-GDI binding in the same cell. The edge tracking evolution (top left panels) from a single cell and associated morphodynamic maps of the edge velocity (top right panel), Rac1-GDI binding at the edge (middle left panel), Rac1-GDI binding at the next adjacent region away from the edge (middle right panel), Rac1 activity at the edge (bottom left panel), and Rac1 activity at the next adjacent region away from the edge (bottom right panel). White bar=10μm. Example set taken from 10 cells from 3 independent experiments. The number inserts in the edge evolution panel in (c) indicate the orientation of the measurement window segments that correspond to the Y-axes of the morphodynamic maps as shown.
Figure 5
Figure 5. Concurrent measurement of Rac1 activity during LOV-TRAP optogenetics
(a) Schematic drawing of the LOV-TRAP system. Mitochondrially targeted mtagBFP-LOV2wt sequesters the GEF-domain of interest attached to Zdk1 molecule. Upon photoactivation with 457nm light, Zdk1-GEF is released and act on the target GTPase, followed by dark relaxation upon cessation of illumination. (b) An example panel of a MEF undergoing photoactivation of LOV-TRAP and concurrent measurements of Rac1 activity using the NIR-Rac1 biosensor. NIR-Rac1 biosensor image sets were acquired every 10s. 457nm illumination (cycles of 4s-on, 6s-off) was started at 300 s and ended at 600 s time points (additional time points are shown in Supplementary Fig. 15a). White bar=20 μm. Pseudocolor limits are 1.0 to 1.74 (black to red). Example taken from N=17 independent photoactivation experiments. (c) Quantification of Rac1 activity measured concurrently with the LOV-TRAP-TrioGEF photoactivation. During the “on” phase of the 457nm illumination, Rac1 activity levels are significantly elevated compared to the control which received no 457nm illumination. The Student t-test (two-tailed) was used to compare Rac1 activity during photoactivation (300s–600s) and dark relaxation (600s–900s) versus the activity prior to photoactivation (0s–300s), and shown in Supplementary Table 2. N=17 independent photoactivation experiments for LOV-TRAP-TrioGEF, n=10 independent mock-photoactivation experiments for the control condition, all shown with mean ±SEM.
Figure 6
Figure 6. NIR-FRET pair of fluorescent proteins in kinase-substrate biosensors
(a) The basic design principle for the PKA and JNK sensors, modified from the original cyan-yellow fluorescent protein versions to using the NIR miRFP670 and miRFP720 fluorescent proteins. (b) Representative timelapse images of a HeLa cell expressing the NIR-AKAR PKA sensor and undergoing stimulation (additional time points are shown in Supplementary Fig. 16a), from n=3 independent stimulation experiments. 1mM dbcAMP was added at the 10min time point and the FRET/donor ratio was monitored for up to 70min; FRET/donor ratio from NIR-AKR is shown with mean ±SEM (c). White bar, 20μm. Black arrow indicates the time point at which the stimulation was performed. n=3 stimulation experiments. Student t-test was used (two tailed) to determine p-values between FRET/donor ratio before (0–8min) and after stimulation (10–70min), shown in Supplementary Table 3. (d) Representative time-lapse images of a HeLa cell expressing the NIR-JNKAR JNK sensor and undergoing stimulation(additional time points are shown in Supplementary Fig. 16b), from n=3 independent stimulation experiments. 1μg/mL anisomycin was added at the 10 min time point and the FRET/donor ratio was monitored for up to 70 min; FRET/donor ratio from NIR-JNKR is shown with mean ±SEM (e). White bar, 20 μm. Black arrow indicates the time point at which the stimulation was performed. N=3 independent stimulation experiments. Student t-test was used (two tailed) to determine p-values between FRET/donor ratio before (0–8min) and after stimulation (10–70min), shown in Supplementary Table 3.

References

    1. Machacek M, et al. Coordination of Rho GTPase activities during cell protrusion. Nature. 2009;461:99–103. - PMC - PubMed
    1. Hodgson L, et al. FRET binding antenna reports spatiotemporal dynamics of GDI-Cdc42 GTPase interactions. Nat Chem Biol. 2016;12:802–9. - PMC - PubMed
    1. Ouyang M, et al. Simultaneous visualization of protumorigenic Src and MT1-MMP activities with fluorescence resonance energy transfer. Cancer Research. 2010;70:2204–12. - PMC - PubMed
    1. Grant DM, et al. Multiplexed FRET to image multiple signaling events in live cells. Biophys J. 2008;95:L69–71. - PMC - PubMed
    1. Demeautis C, et al. Multiplexing PKA and ERK1&2 kinases FRET biosensors in living cells using single excitation wavelength dual colour FLIM. Sci Rep. 2017;7:41026. - PMC - PubMed

Publication types