. 2018 May;50(5):708-717.
doi: 10.1038/s41588-018-0105-0. Epub 2018 Apr 23.

Discordant inheritance of chromosomal and extrachromosomal DNA elements contributes to dynamic disease evolution in glioblastoma

Affiliations

Discordant inheritance of chromosomal and extrachromosomal DNA elements contributes to dynamic disease evolution in glioblastoma

Ana C deCarvalho et al. Nat Genet. 2018 May.

Abstract

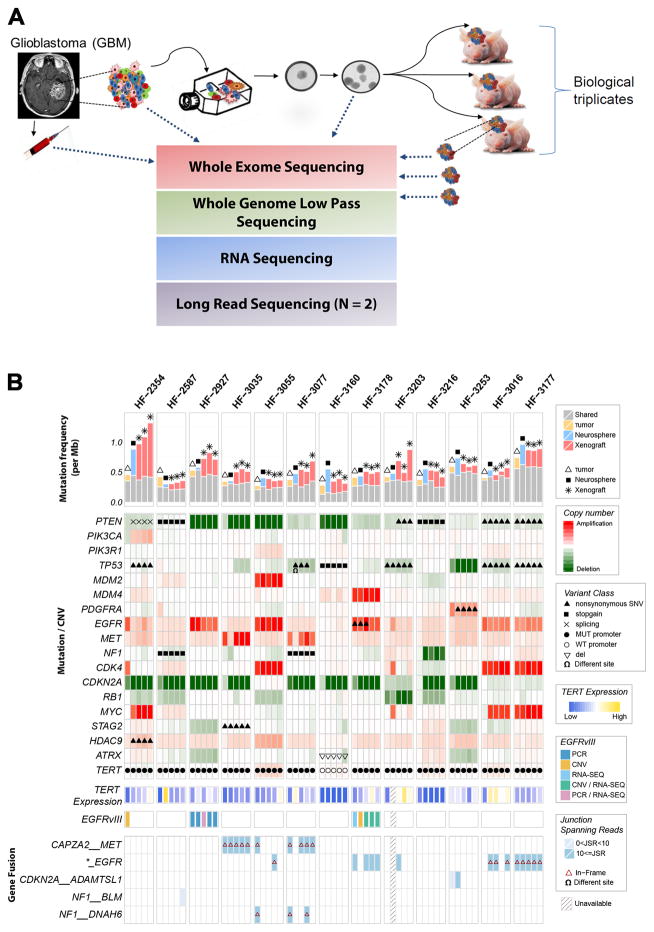
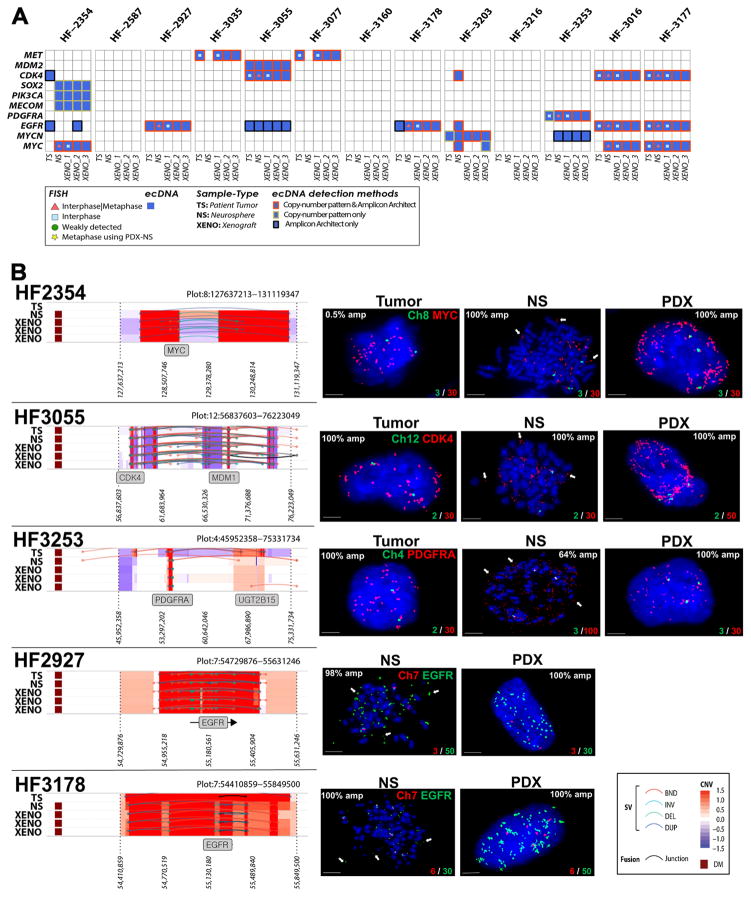
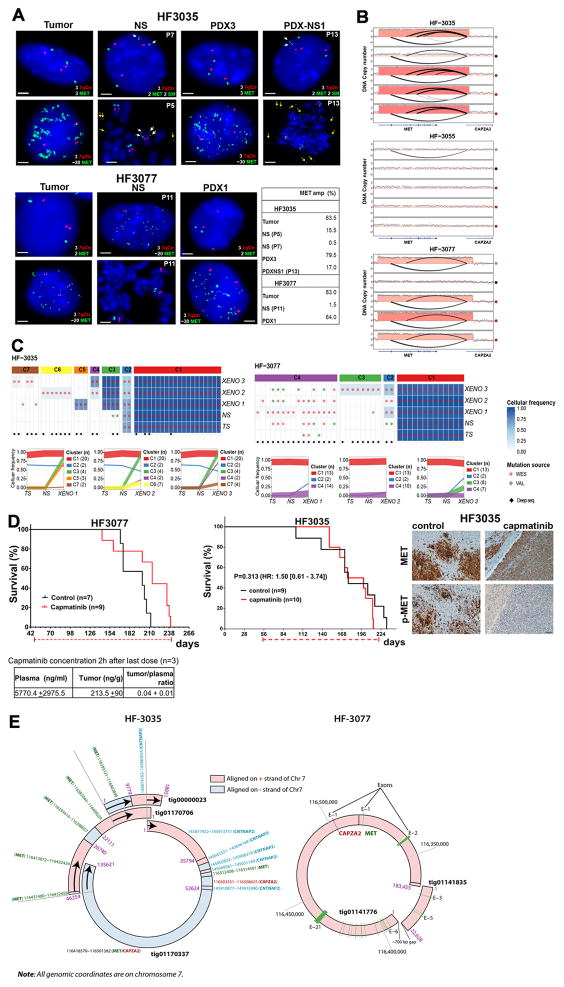
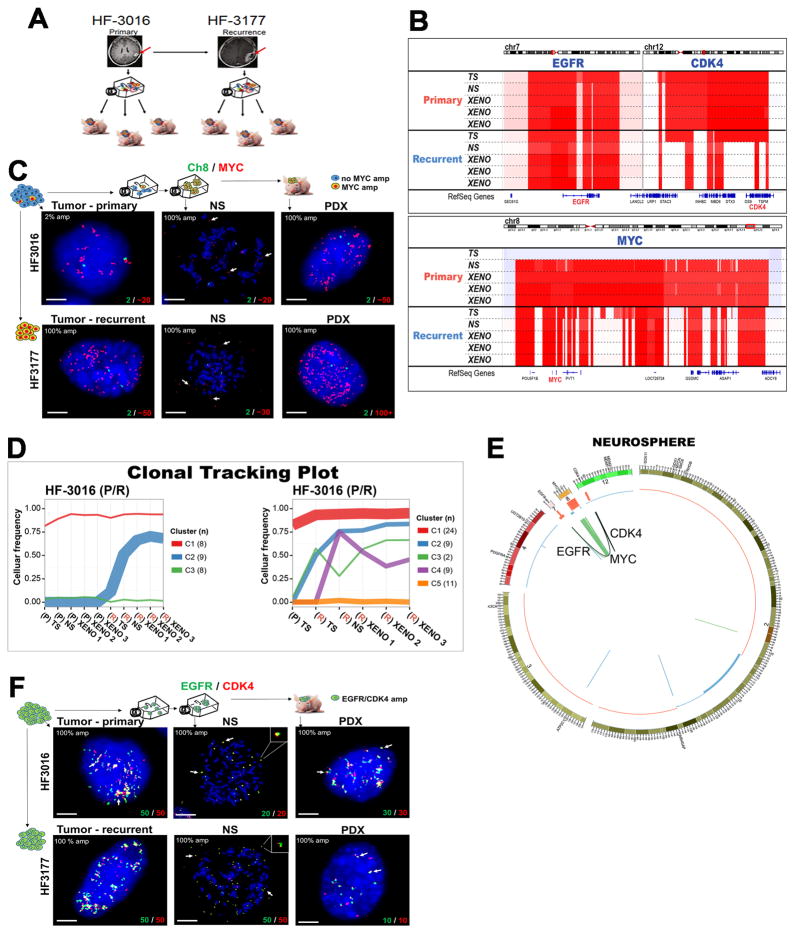
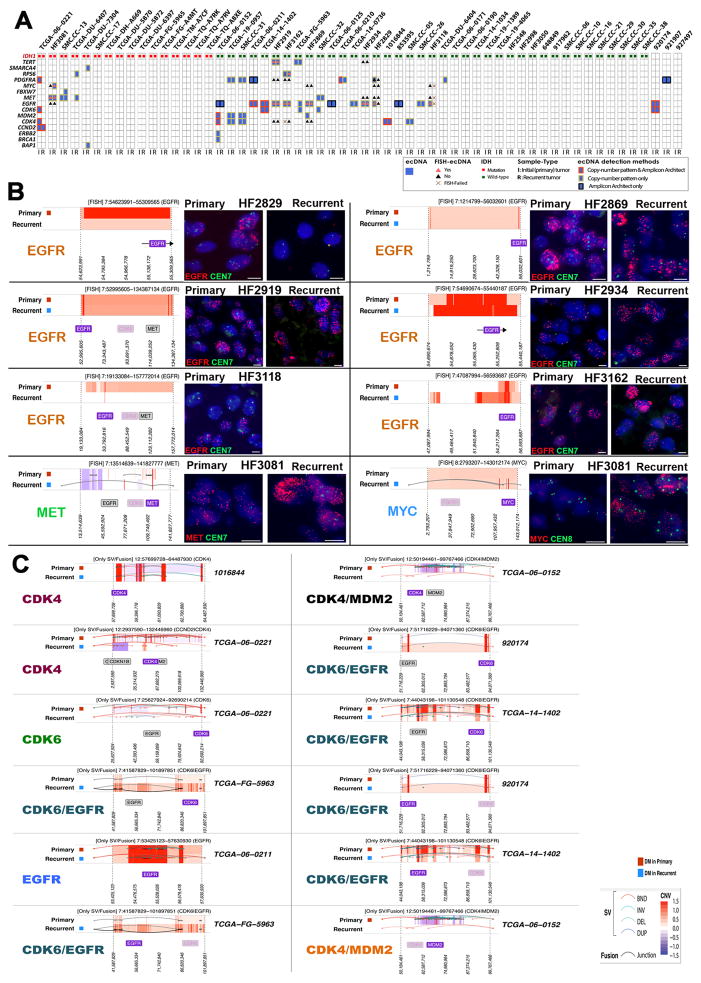
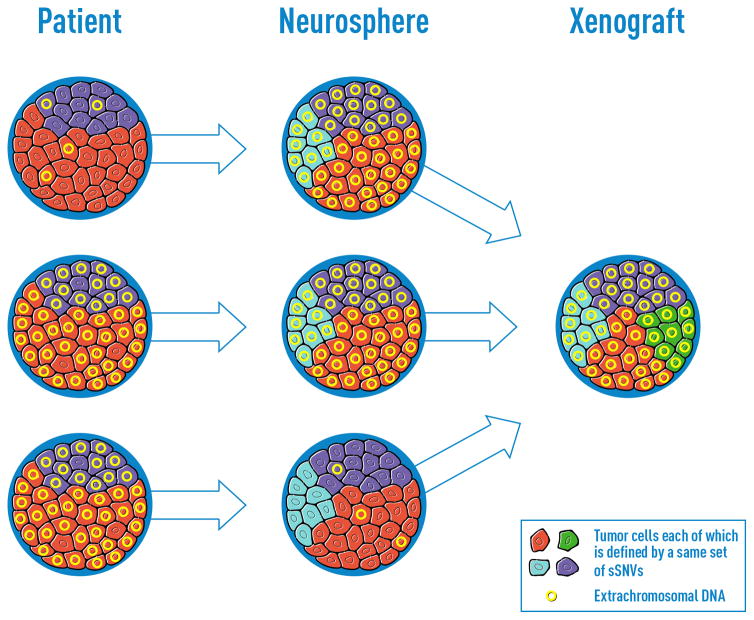
To understand how genomic heterogeneity of glioblastoma (GBM) contributes to poor therapy response, we performed DNA and RNA sequencing on GBM samples and the neurospheres and orthotopic xenograft models derived from them. We used the resulting dataset to show that somatic driver alterations including single-nucleotide variants, focal DNA alterations and oncogene amplification on extrachromosomal DNA (ecDNA) elements were in majority propagated from tumor to model systems. In several instances, ecDNAs and chromosomal alterations demonstrated divergent inheritance patterns and clonal selection dynamics during cell culture and xenografting. We infer that ecDNA was unevenly inherited by offspring cells, a characteristic that affects the oncogenic potential of cells with more or fewer ecDNAs. Longitudinal patient tumor profiling found that oncogenic ecDNAs are frequently retained throughout the course of disease. Our analysis shows that extrachromosomal elements allow rapid increase of genomic heterogeneity during GBM evolution, independently of chromosomal DNA alterations.


Conflict of interest statement

COMPETING INTERESTS

The authors declare no competing financial interests.

Figures

Figure 1
Figure 1. Comprehensive comparison of GBM, derived neurospheres and PDX models
Genomic and transcriptomic characterization were performed on 13 patient tumors, their derivative neurosperes and xenograft models. Long read PacBio sequencing was performed on two xenograft tumors. A. Schematic study overview. B. Somatic driver alterations compared between GBM tumors and derivative model systems.
Figure 2
Figure 2. ecDNA in hGBM samples and FISH validation
A. Heatmap of samples versus driver genes predicted to reside on extrachromosomal DNA elements that were detected with either copy number based or Amplicon Architect methods. Only ecDNAs with markers were validated using FISH. B. Left panel: DNA copy number and genomic rearrangements at ecDNA loci that were predicted with the copy number based approach. Right panel: Representative FISH images showing amplification of MYC, CDK4, PDGFRA in tumor (T), neurospheres (NS, metaphase spread) and PDXs (red) and control chromosomal probes (green). EGFR amplification in neurospheres and PDX (green) and Chr7 control are shown. Arrows in metaphase FISH images mark extrachromosomally DNA elements. A minimum of 100 nuclei for each tumor, NS and two PDX biological replicates were counted. The percentage of nuclei presenting each oncogene amplification is shown. Scale bars, 3 μm.
Figure 3
Figure 3. Extrachromosomal MET DNA
A. Representative FISH images for MET (green) and chromosome 7 control probes (7qCtr, red) labeling of HF3035 and HF3077 tumor, neurosphere (NS), xenografts (PDX), and NS established from HF3035 xenograft tumors (PDX-NS1). Passage numbers are indicated for neurosphere cultures. White arrows point to 2 fragmented MET signals in one chromosome in HF3035 samples (2SM). Yellow arrows point to extrachromosomal MET in metaphase nuclei of HF3035 neurospheres. The percentage of nuclei presenting MET amplification for each sample is shown. Scale bars, 2 μm. B. DNA copy number and chromosomal rearrangement of the 7q31 locus in three sets of GBM tumors and derivate models. C. Top panel: Coverage-controlled sSNVs detected using exome and deep validation sequencing Color reflects cellular frequency estimates. Bottom panel: Clonal tracing from HF3035 and HF3077 parent tumor to neurospheres and xenografts. Each line represents a group of mutations computationally inferred to reflect a subclone. D. Top panel: Treatment with single agent capmatinib (30 mg/kg, daily oral doses) increases survival of HF3077 PDX, but not of HF3035. Kaplan-Meier survival curves were compared by log-rank (Mantel-Cox) test, significance set at P<0.05 (*), HR [95% CI], treatment schedule (doted red line) and number of mice in each arm (n) are shown. Representative images for MET and p-MET immunohistochemistry of 5 control and 5 capmatinib-treated HF3035 PDXs show complete inhibition of p-MET and unaltered MET expression in treated tumors. Scale, 40 μm. Bottom panel: Capmatinib concentration in the plasma and tumor tissue collected 2h after the last dose was determined by LC-MS/MS for HF3077 PDX, results are expressed as mean ± SE for 3 samples E. Double minute structures containing the chromosome 7q31 locus including the MET and CAPZA2 genes in HF3035 and HF3077 xenografts, predicted from long read sequencing.
Figure 4
Figure 4. Extrachromosomal DNA marks subclones driving tumor progression in patient tumors and derived model systems
A. Establishing neurosphere cultures and PDX models from a paired primary/recurrent GBM. B. DNA copy number analysis shows co-amplification of EGFR (chr7)/CDK4 (chr 12) is detected in primary GBM HF3016 which is sustained in both neurosphere and xenografts derived from this primary tumor, as well as the recurrent GBM HF3177, and the neurosphere/xenografts thereof. The HF3016 primary tumor is not MYC amplified. The HF3016 neurosphere, as well as all HF3177 samples, show focal MYC amplification. C. Representative FISH images from 50 metaphase and 100 interphase nuclei for MYC (red) and Ch8 marker (green) show that a small fraction (2%) of the cells in HF3016 tumor presents MYC amplification, while 100% of nuclei in the remaining samples present MYC amplification, which is clearly extrachromosomal (white arrows) in the metaphase spreads (NS). D. Clonal tracing of a pair of primary-recurrent GBM, their matching neurospheres, and xenografts. Each line represents a group of mutations computationally inferred to reflect a subclone. E. Starting in the neurosphere of the primary tumor, a complex structural variant is identified that connects the CDK4 locus to the EGFR locus. The MYC locus is not part of this variant. The EGFR/CDK4 variant is detected in HF3016 PDXs as well as all HF3177 samples. F. EGFR (green) and CDK4 (red), detected by FISH, are amplified in 100% of nuclei for every sample from this patient, with identical copy numbers in each nucleus (bottom of the panels). Overlapping dots show that EGFR/CDK4 co-localize (white arrows) and metaphase FISH (NS) shows extrachromosomal co-amplification in the same double minute (inserts). Images are representative of 50 metaphase and 100 interphase nuclei per group. Scale bars, 3 μm.
Figure 5
Figure 5. Copy number variant driver genes located on the potential double minute (DM) regions
A. 66 tumors (33 P, 33 R) from 38 patients were predicted to contain at least one ecDNA that was detected with either copy number based or Amplicon Architect methods. Amongst these, 44 driver gene harboring ecDNAs were predicted in 25 primary tumors, of which 32 were also detected in the matching recurrent tumors. B. Left panel: DNA copy number and genomic rearrangements at predicted ecDNA loci that were predicted with the copy number based approach. Right panel: Representative FISH images in FFPE tissue sections showing amplification of EGFR, MET and MYC in (red) and control chromosomal probes (green). Fifty nuclei were examined per sample. Scale bars, 5 μM. C. DNA copy number based predictions of extrachromosomal DNA segments validated using whole genome or RNA sequencing.
Figure 6
Figure 6. Schematic illustration of extrachromosomal DNA element contribution to clonal evolution in GBM patient derived models
The proliferation patterns in GBM tumors and models in which ecDNAs provide a dominant evolutionary force.

References

    1. Roos WP, Thomas AD, Kaina B. DNA damage and the balance between survival and death in cancer biology. Nat Rev Cancer. 2016;16:20–33. - PubMed
    1. Yap TA, Gerlinger M, Futreal PA, Pusztai L, Swanton C. Intratumor heterogeneity: seeing the wood for the trees. Sci Transl Med. 2012;4:127ps10. - PubMed
    1. Aparicio S, Caldas C. The implications of clonal genome evolution for cancer medicine. N Engl J Med. 2013;368:842–51. - PubMed
    1. Kim H, et al. Whole-genome and multisector exome sequencing of primary and post-treatment glioblastoma reveals patterns of tumor evolution. Genome Res. 2015;25:316–27. - PMC - PubMed
    1. Sequist LV, et al. Genotypic and histological evolution of lung cancers acquiring resistance to EGFR inhibitors. Sci Transl Med. 2011;3:75ra26. - PMC - PubMed

Publication types