

Origin and evolution of fungal HECT ubiquitin ligases
- PMID: 29686411
- PMCID: PMC5913265
- DOI: 10.1038/s41598-018-24914-x
Origin and evolution of fungal HECT ubiquitin ligases
Abstract
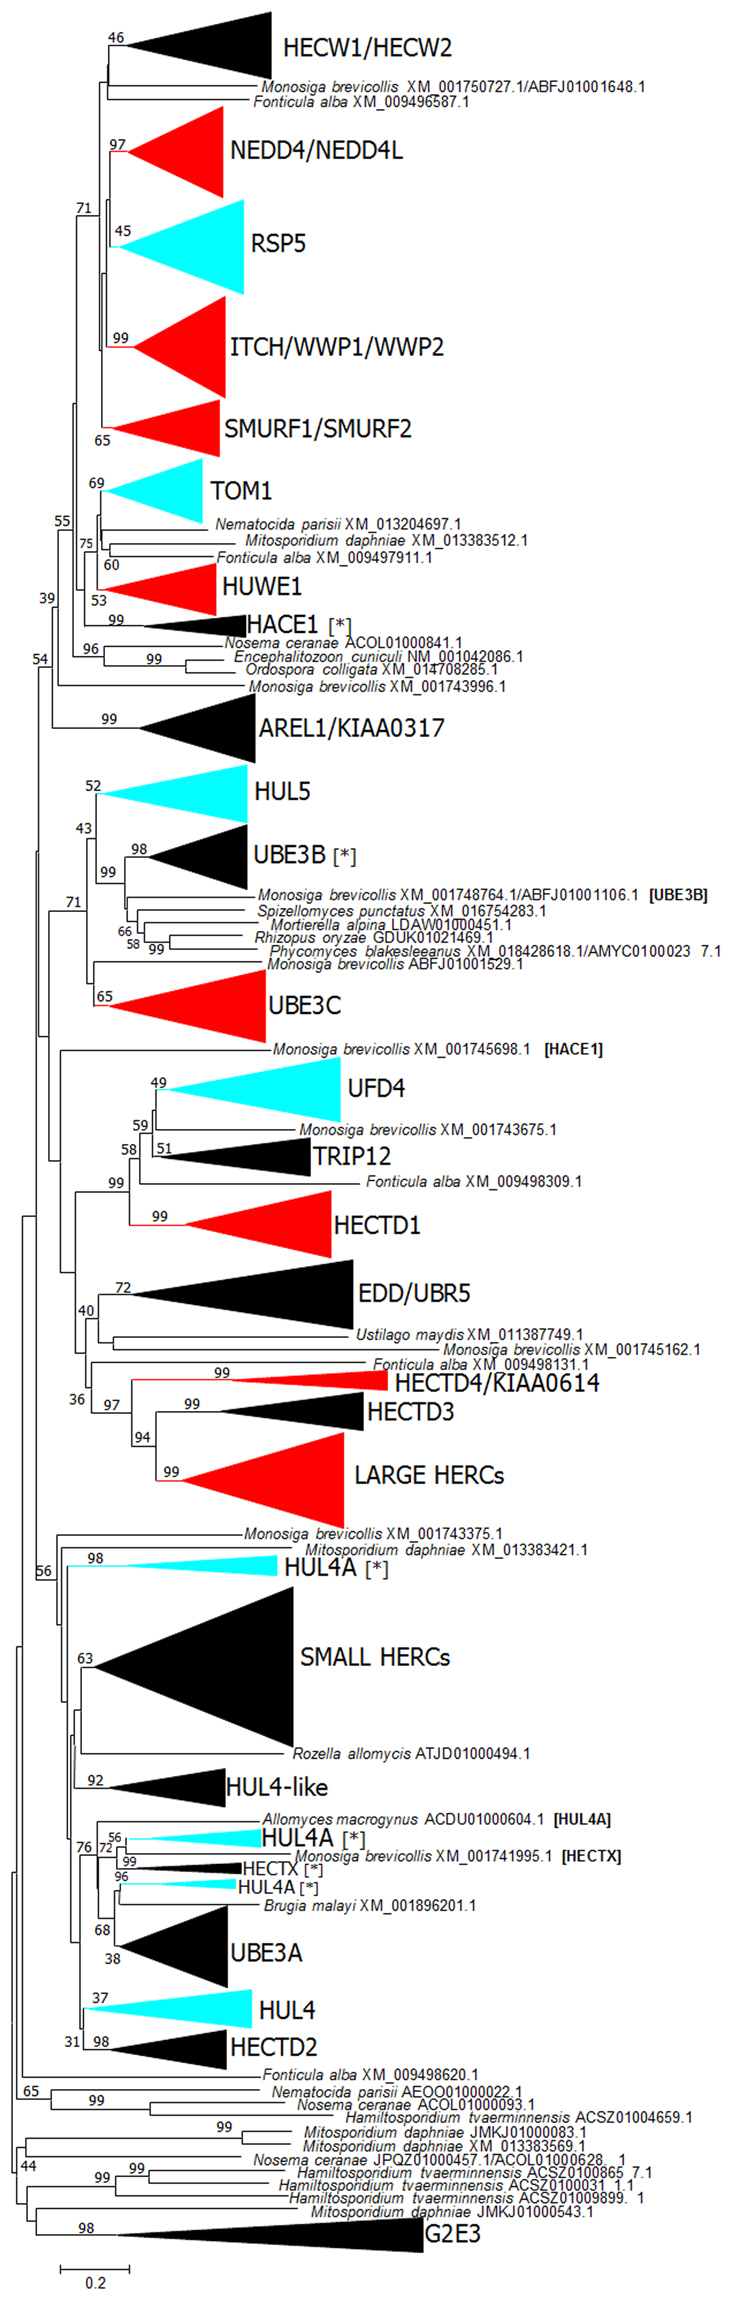
Ubiquitin ligases (E3s) are basic components of the eukaryotic ubiquitination system. In this work, the emergence and diversification of fungal HECT ubiquitin ligases is described. Phylogenetic and structural data indicate that six HECT subfamilies (RSP5, TOM1, UFD4, HUL4, HUL4A and HUL5) existed in the common ancestor of all fungi. These six subfamilies have evolved very conservatively, with only occasional losses and duplications in particular fungal lineages. However, an early, drastic reduction in the number of HECT genes occurred in microsporidians, in parallel to the reduction of their genomes. A significant correlation between the total number of genes and the number of HECT-encoding genes present in fungi has been observed. However, transitions from unicellularity to multicellularity or vice versa apparently had no effect on the evolution of this family. Likely orthologs or co-orthologs of all fungal HECT genes have been detected in animals. Four genes are deduced to be present in the common ancestor of fungi, animals and plants. Protein-protein interactions detected in both the yeast Saccharomyces cerevisiae and humans suggest that some ancient functions of HECT proteins have been conserved since the animals/fungi split.
Conflict of interest statement
The author declares no competing interests.
Figures


Similar articles
-
Evolution of plant HECT ubiquitin ligases.PLoS One. 2013 Jul 15;8(7):e68536. doi: 10.1371/journal.pone.0068536. Print 2013. PLoS One. 2013. PMID: 23869223 Free PMC article.
-
Animal HECT ubiquitin ligases: evolution and functional implications.BMC Evol Biol. 2010 Feb 22;10:56. doi: 10.1186/1471-2148-10-56. BMC Evol Biol. 2010. PMID: 20175895 Free PMC article.
-
A genomic survey of HECT ubiquitin ligases in eukaryotes reveals independent expansions of the HECT system in several lineages.Genome Biol Evol. 2013;5(5):833-47. doi: 10.1093/gbe/evt052. Genome Biol Evol. 2013. PMID: 23563970 Free PMC article.
-
Adaptors as the regulators of HECT ubiquitin ligases.Cell Death Differ. 2021 Feb;28(2):455-472. doi: 10.1038/s41418-020-00707-6. Epub 2021 Jan 5. Cell Death Differ. 2021. PMID: 33402750 Free PMC article. Review.
-
Regulation of catalytic activities of HECT ubiquitin ligases.Biochem Biophys Res Commun. 2007 Mar 9;354(2):329-33. doi: 10.1016/j.bbrc.2007.01.025. Epub 2007 Jan 16. Biochem Biophys Res Commun. 2007. PMID: 17240353 Free PMC article. Review.
Cited by
-
Vertebrate TNF Superfamily: Evolution and Functional Insights.Biology (Basel). 2025 Jan 10;14(1):54. doi: 10.3390/biology14010054. Biology (Basel). 2025. PMID: 39857285 Free PMC article.
-
Regulation of the endocytosis and prion-chaperoning machineries by yeast E3 ubiquitin ligase Rsp5 as revealed by orthogonal ubiquitin transfer.Cell Chem Biol. 2021 Sep 16;28(9):1283-1297.e8. doi: 10.1016/j.chembiol.2021.02.005. Epub 2021 Mar 4. Cell Chem Biol. 2021. PMID: 33667410 Free PMC article.
-
A Comprehensive Insight into Fungal Enzymes: Structure, Classification, and Their Role in Mankind's Challenges.J Fungi (Basel). 2021 Dec 28;8(1):23. doi: 10.3390/jof8010023. J Fungi (Basel). 2021. PMID: 35049963 Free PMC article. Review.
-
Ubiquitin ligases and a processive proteasome facilitate protein clearance during the oocyte-to-embryo transition in Caenorhabditis elegans.Genetics. 2022 May 5;221(1):iyac051. doi: 10.1093/genetics/iyac051. Genetics. 2022. PMID: 35377419 Free PMC article.
-
Taxonomic revision of Blumeria based on multi-gene DNA sequences, host preferences and morphology.Mycoscience. 2021 May 20;62(3):143-165. doi: 10.47371/mycosci.2020.12.003. eCollection 2021. Mycoscience. 2021. PMID: 37091321 Free PMC article.
References
MeSH terms
Substances
LinkOut - more resources
Full Text Sources
Other Literature Sources
Molecular Biology Databases
