. 2018 May;24(5):580-590.
doi: 10.1038/s41591-018-0008-8. Epub 2018 Apr 23.

Transcript-indexed ATAC-seq for precision immune profiling

Affiliations

Transcript-indexed ATAC-seq for precision immune profiling

Ansuman T Satpathy et al. Nat Med. 2018 May.

Abstract

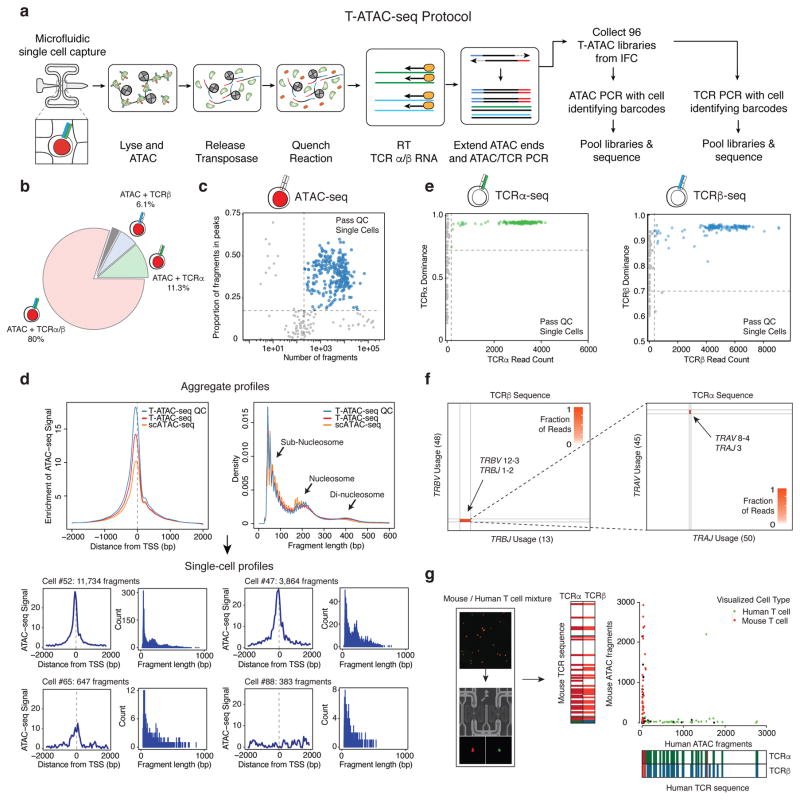
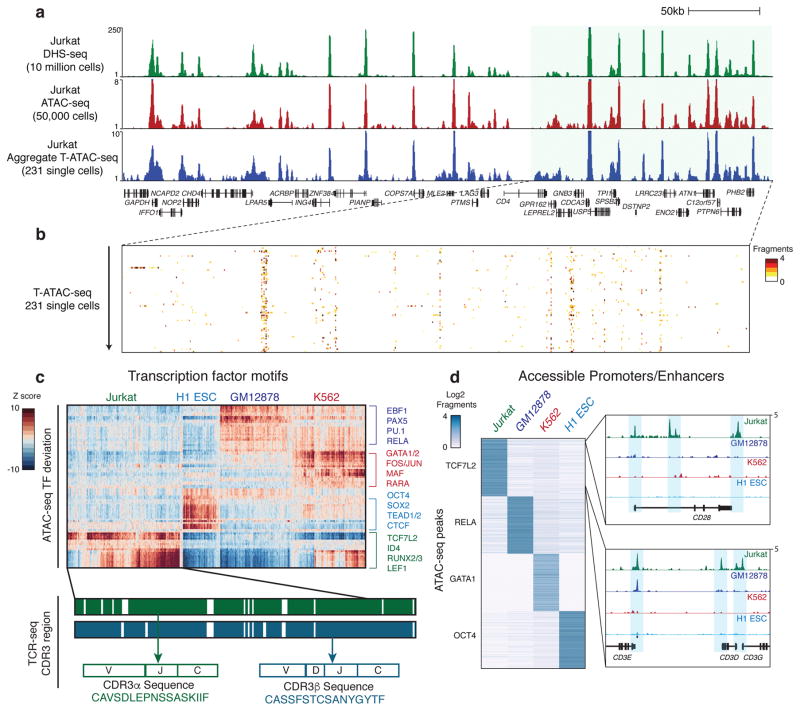
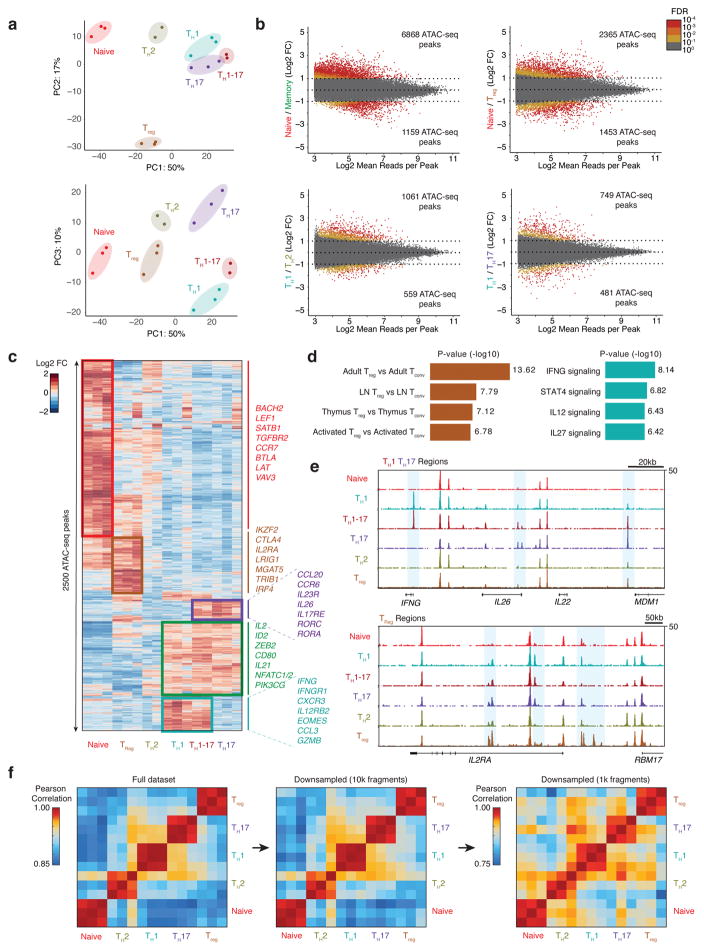
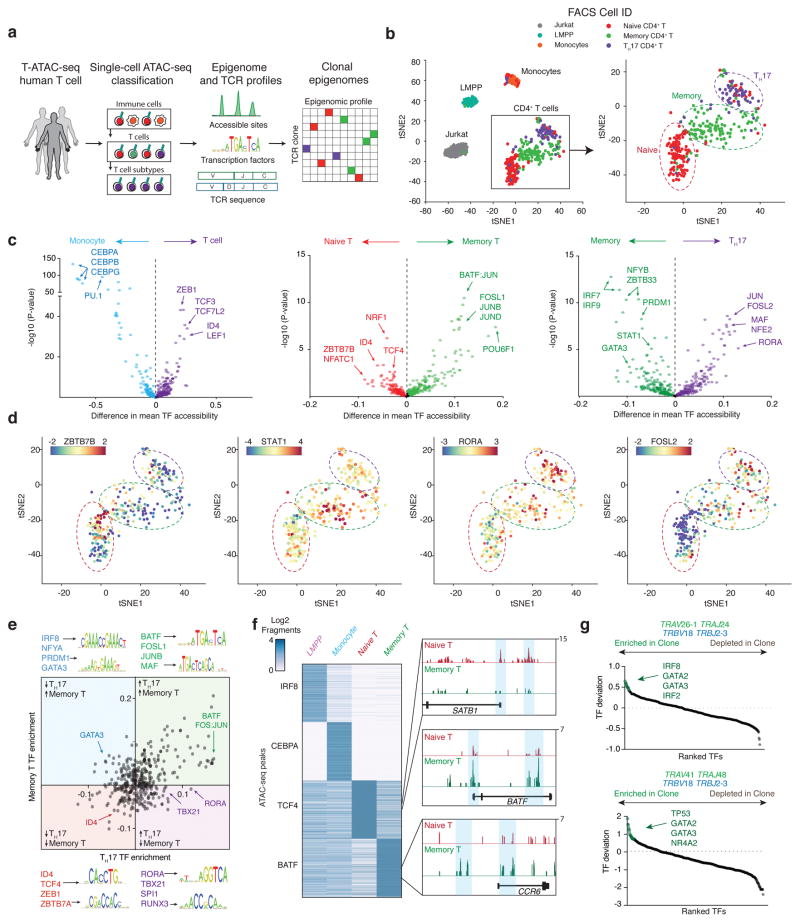
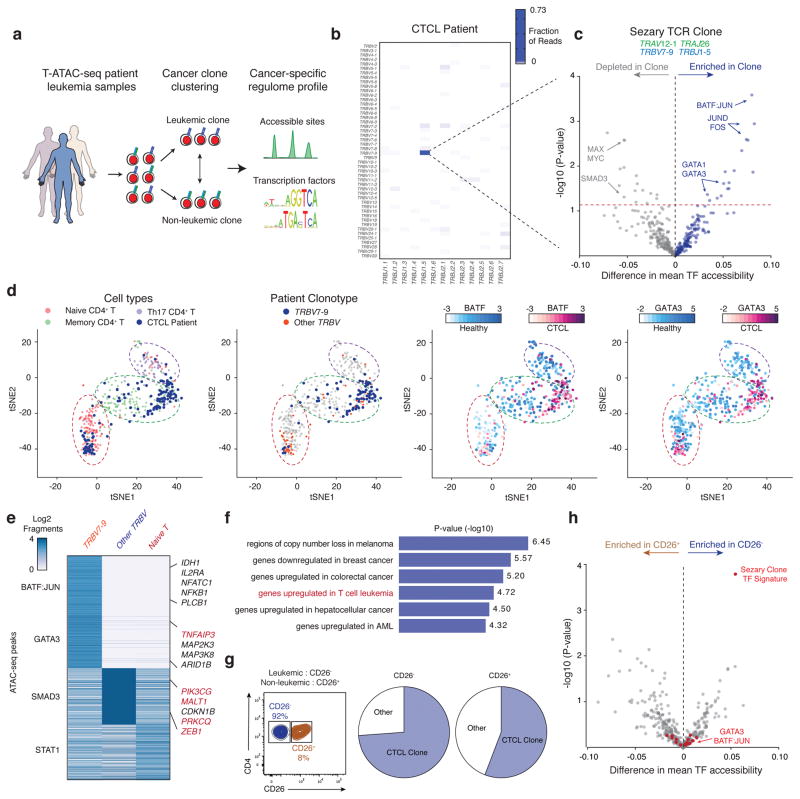
T cells create vast amounts of diversity in the genes that encode their T cell receptors (TCRs), which enables individual clones to recognize specific peptide-major histocompatibility complex (MHC) ligands. Here we combined sequencing of the TCR-encoding genes with assay for transposase-accessible chromatin with sequencing (ATAC-seq) analysis at the single-cell level to provide information on the TCR specificity and epigenomic state of individual T cells. By using this approach, termed transcript-indexed ATAC-seq (T-ATAC-seq), we identified epigenomic signatures in immortalized leukemic T cells, primary human T cells from healthy volunteers and primary leukemic T cells from patient samples. In peripheral blood CD4+ T cells from healthy individuals, we identified cis and trans regulators of naive and memory T cell states and found substantial heterogeneity in surface-marker-defined T cell populations. In patients with a leukemic form of cutaneous T cell lymphoma, T-ATAC-seq enabled identification of leukemic and nonleukemic regulatory pathways in T cells from the same individual by allowing separation of the signals that arose from the malignant clone from the background T cell noise. Thus, T-ATAC-seq is a new tool that enables analysis of epigenomic landscapes in clonal T cells and should be valuable for studies of T cell malignancy, immunity and immunotherapy.


Conflict of interest statement

Conflict of Interest

H.Y.C. and W.J.G. are founders of Epinomics and members of its scientific advisory board. H.Y.C. is a founder of Accent Therapeutics and a member of its scientific advisory board. H.Y.C. is a member of the scientific advisory board of Spring Discovery.

Figures

Figure 1
Figure 1. T-ATAC-seq generates open chromatin and TCR profiles in single T cells
(a) Outline of the T-ATAC-seq protocol. Squares indicate individual microfluidic chambers in the IFC. T cells are individually captured and sequentially subjected to ATAC-seq (chambers 1–3), reverse transcription of TCRα and TCRβ chain transcripts, and amplification of ATAC-seq and TCR-seq amplicons, in nanoliter-scale reaction volumes. Single-cell libraries are then amplified with cell-identifying barcodes and analyzed by high-throughput sequencing. (b) Pie chart indicating overlap of TCR-seq and ATAC-seq data from single Jurkat cells (231 single cells from 3 independent experiments) that passed quality control filters. Shown are the proportion of cells generating ATAC-seq profiles in which TCRα or TCRβ sequence was also obtained. The gray bar indicates the portion of cells in which ATAC-seq data was obtained, but TCRα or TCRβ data was not (2.6%). (c) T-ATAC-seq data quality control filters. Shown are the number of unique ATAC-seq nuclear fragments in each single Jurkat cell compared to the percentage of fragments in ATAC-seq peaks derived from ensemble Jurkat ATAC-seq profiles. (d) Aggregate (top) and single-cell (bottom) T-ATAC-seq profile characteristics. Shown are enrichments of ATAC-seq Tn5 insertions around transcription start sites (TSS) and the nucleosomal periodicity of ATAC-seq fragment lengths. Aggregate profiles obtained from all T-ATAC-seq single cells, T-ATAC-seq single cells passing quality control filters (QC), and scATAC-seq cells are shown. Fragment length indicates the genomic distance between two Tn5 insertion sites, as determined by paired-end sequencing of ATAC fragments. Density indicates the fraction of fragments with the indicated length. The cell # indicates the position of each individual cell in the IFC, and the associated fragment number indicates the number of unique nuclear fragments obtained in that cell. Count indicates the number of fragments for each fragment length. (e) Quality control filters for TCRα (left) and TCRβ (right) sequences. Shown are TCRα or TCRβ paired-end sequencing read counts for each single cell compared to TCR dominance of the top clone for each cell. TCR dominance is quantified as the fraction of reads that support the most prevalent TCR clone by sequence identity. Dashed lines represent quality control filters of 100 reads and 70% dominance for Jurkat cells. (f) Heat maps showing TCRα or TCRβ rearrangements identified in Jurkat cells. Each axis represents all possible genes within the indicated TCR locus. The labeled genes indicate the sequences identified using T-ATAC-seq. (g) Mouse/human T cell mixing experiment. Shown are visualized cells in the IFC (left), unique nuclear ATAC-seq fragments aligning to the mouse or human genome, and TCR-seq clones identified when compared to mouse or human references (right). In the IFC, human T cells are labeled in green and mouse T cells are labeled in red.
Figure 2
Figure 2. T-ATAC-seq identifies epigenomic signatures of clonal Jurkat T cells
(a) Genome tracks showing a comparison of aggregate single-cell T-ATAC-seq profiles to ensemble ATAC-seq and DHS-seq profiles. (b) Zoom-in of the indicated genome track in (a), showing accessibility profiles for single Jurkat cells. Each pixel represents a 200bp region. (c) Heat map of TF deviation z-scores in single Jurkat cells (231 cells, 3 independent experiments) obtained using T-ATAC-seq compared to previously published profiles from H1 ESC (84 cells), GM12878 (159 cells), and K562 cells (258 cells) obtained using scATAC-seq. The presence or absence of paired TCRα or TCRβ is indicated by green and blue bars. Amino acid sequences represent the identified CDR3 region, which spans V, (D), J, and C genes. (d) Left, heat map showing ATAC-seq fragment counts in peaks (rows) containing the indicated motifs from aggregated single cells. Cell types analyzed (aggregated from single-cell profiles) are indicated above each column. Right, genome tracks for aggregated single-cell ATAC-seq data. Jurkat-specific peaks in the CD28 and CD3E, D, and G locus are shown.
Figure 3
Figure 3. Epigenomic landscape of ensemble human CD4+ T cell subtypes
(a) PCA of ensemble ATAC-seq profiles from CD4+ T cell subtypes using the top 2500 variable ATAC-seq peaks (as defined by variance rank of log2 variance-stabilized read counts; n=3, 3 independent experiments). Percentages indicate percent of variance explained by each PC. (b) Differential ATAC-seq peaks for the indicated T cell subtypes. Memory T cell signatures reflect the average accessibility in TH1, TH2, TH17, and TH1-17 cells. (c) Heat map showing clusters for top 2500 varying ATAC-seq peaks. Colors indicate log2 fold-change of reads in each peak compared to the mean across all T cell types. (d) Left, MSigDB Immunologic Signatures of Treg-specific ATAC-seq peaks as obtained from GREAT analysis. Right, MSigDB Pathway Signatures of TH1-specific ATAC-seq peaks as obtained from GREAT analysis (Binomial test, n=3, 3 independent experiments). (e) Ensemble ATAC-seq data genome tracks for the indicated T cell subtypes. Highlighted regions show cell type-specific ATAC-seq peaks. (f) Pearson correlation of PC scores of ensemble ATAC-seq profiles and of ensemble ATAC-seq profiles after downsampling each profile to 10,000 or 1,000 fragments. Downsampling was performed by randomly selecting 10,000 or 1,000 nuclear fragments in each ensemble ATAC-seq .bam file. Heat maps demonstrate that CD4+ T cell subtype profiles can be distinguished from one another using the full dataset or profiles with a fraction of the fragments, as expected in single-cell libraries (16 ATAC-seq profiles obtained from 3 independent experiments).
Figure 4
Figure 4. Single-cell epigenomic and TCR profiling of human CD4+ T cells
(a) Outline for T-ATAC-seq analysis in primary human T cells. Single cells are first sequentially classified to major blood lineages, and then to T cell subsets, by similarity to ensemble reference ATAC-seq profiles. T-ATAC-seq data from classified single T cells are then analyzed for accessibility at regulatory DNA elements and TF activity using ATAC-seq data, and for TCR sequence identity. Finally, integrative analysis of both data types is performed to identify epigenomic signatures in T cell clones. (b) t-SNE projection of naive and memory T cells (T-ATAC-seq, 320 cells, 6 independent experiments), Jurkat T cells (T-ATAC-seq, 145 cells, 3 independent experiments), Monocytes (scATAC-seq, 71 cells), and Lymphoid-primed multipotent progenitors (LMPP; scATAC-seq, 86 cells). See Methods for generation of tSNE plots from high-quality single-cell libraries. (c) TF bias-corrected deviation enrichments (chromVAR) in aggregated single-cell populations. TF enrichments are calculated as the difference in mean TF motif accessibility between two populations of single cells. Shown are enrichments for all T cells compared to monocytes (left), memory T cells compared to naive T cells (classified according to t-SNE clustering; middle), and TH17 cells compared to memory T cells (right). P-values were calculated using a two-tailed t-test. (d) t-SNE projection of single T cells colored by ZBTB7B (enriched in naive cells), STAT1 (enriched in memory cells), RORA (enriched in TH17 cells), and FOSL2 (enriched in TH17 cells) motif accessibility TF z-scores. Scale bars indicate the range of TF z-scores. (e) Mean bias-corrected deviations ranked for difference in aggregated TH17 cells vs aggregated naive cells (x-axis) and aggregated memory (non-TH17) cells vs aggregated naive cells (y-axis). Shown are TF motifs for selected factors in each quadrant. For example, BATF motifs show increased accessibility in memory T cells and TH17 cells. In contrast, RORA motifs show increased accessibility in TH17 cells, but not in memory T cells. (f) Left, heat map showing ATAC-seq fragment counts in peaks (rows) containing the indicated motifs from aggregated single cells. Cell types analyzed are indicated above each column. Right, aggregated single-cell genome tracks for naive T cell- and memory T cell-specific peaks in the SATB1, BATF, and CCR6 loci. (g) TCR clone and CDR3 sequences for two memory T cell clones and associated TF deviation enrichments in clonal cells vs non-clonal memory T cells. Clone #1 is shown in the top panel, and clone #2 is shown in the bottom panel. Epigenomic profiles from each clone were aggregated and compared against an aggregate profile from all non-clonal memory T cells.
Figure 5
Figure 5. T-ATAC-seq identifies epigenomic signatures of clonal leukemic T cells in patient samples
(a) Outline for T-ATAC-seq analysis in patient T cell leukemia samples. Single cells are first classified according to TCR sequence identity as leukemic cells or non-leukemic cells. ATAC-seq data from classified single T cells are then analyzed for accessibility at regulatory DNA elements and TF activity. (b) Heat map showing TCRβ rearrangements in peripheral blood samples from a patient with Sezary syndrome (3 independent experiments). (c) TF bias-corrected deviation enrichments in aggregated clonal T cells as compared to all other T cells. Shown is the TCR sequence identified in the putative leukemic T cell clone (top). TF enrichments (bottom) are calculated as the difference in mean TF motif accessibility between aggregated leukemic T cell clone profiles and non-clonal T cell profiles in the same patient. Selected TF motifs enriched or depleted in the T cell clone are indicated. P-values were calculated using a two-tailed t-test. (d) t-SNE projection of healthy naive and memory T cells (320 cells, 6 independent experiments) and patient cells (139 cells, 3 independent experiments) colored by Cell ID (left), clonal vs non-clonal cells (middle left), BATF TF score (middle right), and GATA3 TF score (right). Scale bars indicate range of TF z-scores. (e) Heat map showing ATAC-seq fragment counts in peaks containing the indicated motifs (left). Labels indicate genes associated with differential peaks, including genes previously shown to be mutated in CTCL (red). (f) MSigDB Perturbation Signatures of TRB7–9-specific ATAC-seq peaks as obtained from GREAT analysis (Binomial test, 102 aggregated single cells, 3 independent experiments). (g) Sort strategy for CD26+ and CD26 CD4+ T cells (left), and clonal TCR profiles in each population (right). The lack of CD26 expression has been previously used to distinguish leukemic cells from non-leukemic cells. (h) TF bias-corrected deviation enrichments in aggregated CD26 cells (56 single cells) compared to CD26+ cells (49 single cells). P-values were calculated using a two-tailed t-test. TFs identified above the dashed line in (c) are highlighted in red.

References

    1. Davis MM, Bjorkman PJ. T-cell antigen receptor genes and T-cell recognition. Nature. 1988;334:395–402. - PubMed
    1. Shalek AK, et al. Single-cell RNA-seq reveals dynamic paracrine control of cellular variation. Nature. 2014;510:363–369. - PMC - PubMed
    1. Gaublomme JT, et al. Single-Cell Genomics Unveils Critical Regulators of Th17 Cell Pathogenicity. Cell. 2015;163:1400–1412. - PMC - PubMed
    1. Paul F, et al. Transcriptional Heterogeneity and Lineage Commitment in Myeloid Progenitors. Cell. 2015;163:1663–1677. - PubMed
    1. Tirosh I, et al. Dissecting the multicellular ecosystem of metastatic melanoma by single-cell RNA-seq. Science. 2016;352:189–196. - PMC - PubMed

Publication types