. 2018 Apr 23;9(1):1597.
doi: 10.1038/s41467-018-04088-w.

A mobile endocytic network connects clathrin-independent receptor endocytosis to recycling and promotes T cell activation

Affiliations

A mobile endocytic network connects clathrin-independent receptor endocytosis to recycling and promotes T cell activation

Ewoud B Compeer et al. Nat Commun. .

Abstract

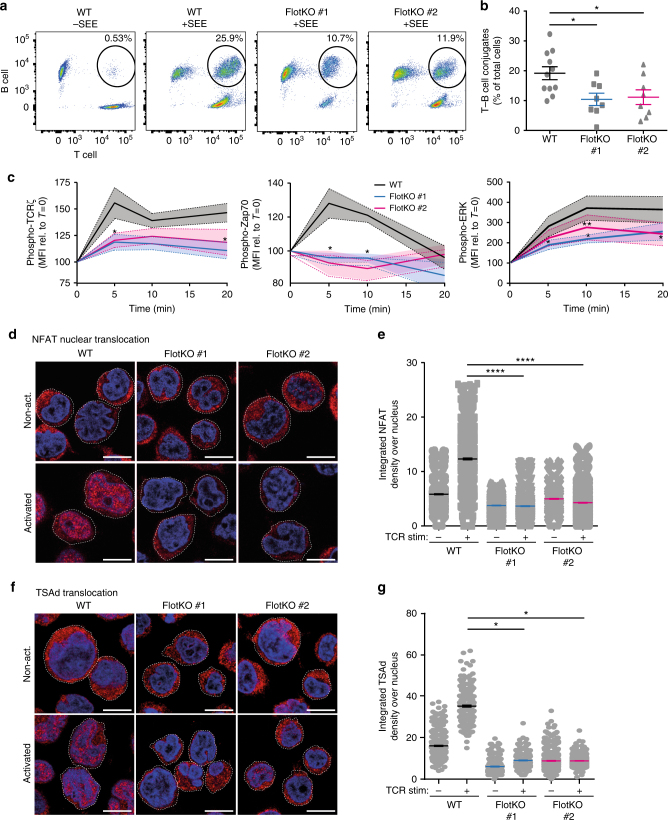
Endocytosis of surface receptors and their polarized recycling back to the plasma membrane are central to many cellular processes, such as cell migration, cytokinesis, basolateral polarity of epithelial cells and T cell activation. Little is known about the mechanisms that control the organization of recycling endosomes and how they connect to receptor endocytosis. Here, we follow the endocytic journey of the T cell receptor (TCR), from internalization at the plasma membrane to recycling back to the immunological synapse. We show that TCR triggering leads to its rapid uptake through a clathrin-independent pathway. Immediately after internalization, TCR is incorporated into a mobile and long-lived endocytic network demarked by the membrane-organizing proteins flotillins. Although flotillins are not required for TCR internalization, they are necessary for its recycling to the immunological synapse. We further show that flotillins are essential for T cell activation, supporting TCR nanoscale organization and signaling.


Conflict of interest statement

The authors declare no competing interests.

Figures

Fig. 1
Fig. 1
T cell activation and signaling promote fast internalization of TCRζ but not of Lck. a Left: Representative images of Jurkat T cells expressing TCRζ-PA-mCherry (top panels) or Lck-PA-mCherry (bottom panels), allowed to adhere on non-activating (poly-l-lysine) or b activating (anti-CD3ε and anti-CD28) surfaces, photoactivated on membrane region of interest and subsequently imaged for 250 s. Images show T cells before and after activation and at indicated time points. Right: number of PA-mCherry vesicles detected in each frame during the time of acquisition. c Maximum number of PA-mCherry vesicles detected in a given frame during the 250 s acquisition time. Each dot represents a cell. d Maximum number of PA-mCherry vesicles detected in Jurkat cells lacking functional Lck (JCam1), Zap70 (P116) or Lat (LAT KO) and activated on anti-CD3ε and anti-CD28 coated surfaces. Horizontal dashed line represents the values for TCRζ in activated cells from panel c. e Representative examples of TCRζ-PA-mCherry vesicle tracks detected in activated untreated cells or treated with dynasore or CK666. Color scale is length in µm. f Length of vesicle tracks in untreated, dynasore or CK666 treated cells. Each dot is one track. g Zoomed images of immobile TCRζ-PA-mCherry vesicles in dynasore (top) or CK666 (bottom) treated Jurkat T cells. Scale bar is 0.5 µm. h Fluorescence intensity profiles over time of single vesicles, such as those shown in g and neighboring plasma membrane regions of the same size. Scale bars, 5 µm. Data obtained from three or more independent experiments. Small horizontal lines indicate mean (±SEM). ns, not significant; *p < 0.01; ***p < 0.0001; ****p < 0.00001; Mann–Whitney t-test
Fig. 2
Fig. 2
TCRζ is internalized through a clathrin-independent pathway in vesicles positive for flotillin-2. a Representative images of activated Jurkat T cells expressing TCRζ-PA-mCherry either pretreated with 6 µM pitstop2 or co-expressing AP180-C-EGFP and activated and photoactivated as before. b Maximum number of PA-mCherry vesicles in cells treated with pitstop2 or co-expressing AP180-C-EGFP. cf Representative images (c and d) and cross-channel nearest neighbor distance (e and f) between vesicles defined by Clathrin-EGFP and TCRζ-PA-mCherry or Clathrin-PA-mCherry and transferrin-Alexa488, and flotillin-2-EGFP and TCRζ-PA-mCherry or flotillin-2-PA-mCherry and transferrin-Alexa488, in Jurkat T cells activated on anti-CD3ε and anti-CD28-coated surfaces. Percentages shown are for vesicles having a distance of less than 320 nm to their nearest neighbor in the other channel. g Representative examples of Clathrin-PA-mCherry (left) or flotillin-2-PA-mCherry (right) vesicle tracks detected in activated T cells untreated (top) or treated with CK666 (bottom). Color scale depicts length in µm. h Length of vesicle tracks in vehicle-treated and CK666-treated cells. Each dot represents a single track. Scale bars, 5 µm. Data obtained from three or more independent experiments. Small horizontal lines indicate mean (±SEM). ns, not significant; **p < 0.001; ****p < 0.00001; Mann–Whitney t-test
Fig. 3
Fig. 3
Internalized flotillins and TCRζ define a long-lived mobile endocytic network. a Representative images of Jurkat T cells expressing Clathrin-PA-mCherry (left) or Flotillin-PA-mCherry (right), activated on anti-CD3ε and anti-CD28-coated surfaces, photoactivated on a region of interest and subsequently imaged for 250 s. Images are from 50 and 200 s after photoactivation. Number of PA-mCherry vesicles detected in each frame at (b) 50 s and (c) 200 s. d Number of PA-mCherry vesicles detected at any given point during 250 s acquisition. e Number of PA-mCherry vesicles detected within or outside of the central endosomal region for each frame during the time of acquisition for Flotillin2-PA-mCherry and (f) Clathrin-PA-mCherry. g Ratio of Flotillin2-PA-mCherry or Clathrin-PA-mCherry positive vesicles detected in or out of the central endosomal region. h Example of Jurkat T cells expressing TCRζ-PA-mCherry after photoactivation of a region of interest and imaged for 450 s (extended) or in cells repetitively photoactivated every 8 s (repetitive). i Number of PA-mCherry vesicles detected in each frame during the time of acquisition as in Fig. 1b (standard) or during extended and repetitive acquisition. j Number of TCRζ-PA-mCherry vesicles detected within or outside of the central endosomal region for each frame during the time of acquisition. Each dot represents a cell. Scale bars, 5 µm. Data obtained from three or more independent experiments. Small horizontal lines indicate mean (±SEM). ns, not significant; **p < 0.001, Mann–Whitney t-test
Fig. 4
Fig. 4
Flotillin expression is required for recycling of TCR but not for its internalization. a Flotillin knock-out Jurkat T cells expressing TCRζ-PA-mCherry, activated on anti-CD3ε-coated and anti-CD28-coated surfaces, photoactivated on outer membrane region of interest, and subsequently imaged for 250 s. b Number of PA-mCherry vesicles detected for each frame during the time of acquisition. c Maximum number of PA-mCherry vesicles detected in a given frame for Flotillin1/2 KO T cells and WT T cells (dotted line). d Diagram of internalization flow cytometry assay. e Mean fluorescent intensity (MFI) at the surface of 50,000 Jurkat T cells (Left: wildtype; Right: Flotillin1/2 KO) stained with an activating antibody against CD3ε and allowed to internalize TCR complexes for 0, 5, 10, and 20 min. f Decrease of MFI at indicated time points relative to t = 0. g Diagram of antibody feeding assay. h MFI of 50,000 Jurkat T cells (Left: wildtype; Right: Flotillin-1/-2 KO) allowed to recycle TCR for 0, 5, 10, and 20 min after having internalizing TCR complexes labelled with an activating antibody against CD30ε for 40 min. i MFI increase at indicated time points relative to t = 0. j Images of WT and flotillin1/2 KO cells on activated surfaces and expressing TCRζ-PA-mCherry at 1 and 10 min after photoactivation. k Number of PA-mCherry vesicles detected at 10 min after photoactivation. Scale bar, 5 µm. Data obtained from three or more independent experiments, with at least five cells per experiment. Small horizontal dotted lines indicate mean (±SEM). ns, not significant; *p < 0.01, Mann–Whitney t-test
Fig. 5
Fig. 5
Flotillins organize the subcellular localization of TCRζ. a Representative images of wildtype and Flotillin1/2 KO Jurkat T cells expressing TCRζ-mCherry and conjugated to SEE pulsed Raji B cells. b TCRζ-mCherry intensity at the immunological synapse, a region directly behind the synapse, and at a region in the plasma membrane distal to the immunological synapse. Regions are indicated by corresponding colored boxes in a (arrows). c Representative TIRF images of wildtype and Flotillin1/2 KO Jurkat T cells expressing TCRζ-mCherry on activating anti-CD3ε and anti-CD28 antibodies coated glass surfaces. d Quantification of the 2D spatial distribution of TCRζ-mCherry intensity. A score of 1 means that the total mCherry intensity detected in the image is concentrated within one single pixel. Scale bars, 5 µm. Data obtained from three independent experiments. Error bars indicate mean (±SEM). ns, not significant; *p < 0.01; ***p < 0.0001; ****p < 0.00001; Mann–Whitney t-test
Fig. 6
Fig. 6
Flotillin-mediated TCR recycling controls TCRζ cell surface nanoscale organization. a Left: Representative single-molecule images of TCRζ-PSCFP2 in WT (top) and flotillin1/2 KO (bottom) Jurkat T cells on activating anti-CD3ε and anti-CD28 antibodies coated glass surfaces. Right: cluster maps color-coded for the relative molecular density from regions (3 µm × 3 µm) highlighted in the single-molecule images (boxes); normalized relative density is pseudocoloured. b Number of TCRζ-PSCFP2 clusters per µm2 identified by DB-SCAN, in WT and flotillin1/2 KO Jurkat T cells. c TCRζ-PSCFP2 cluster size distribution in WT Jurkat T cells on non-activating (anti-CD90 antibodies; grey) and activating (anti-CD3ε and anti-CD28 antibodies; black) coated glass surfaces. d TCRζ-PSCFP2 cluster size distribution in WT and flotillin1/2 KO Jurkat T cells on activating (anti-CD3ε and anti-CD28 antibodies) coated glass surfaces. Scale bars, 5 µm. Data obtained from three or more independent experiments, with at least five cells per experiment. Error bars indicate mean (±SEM). ns, not significant; **p < 0.001; ***p < 0.0001; Mann–Whitney t-test
Fig. 7
Fig. 7
Flotillin expression is required for conjugate formation and T cell signaling. a Representative flow cytometry dot plots of wildtype and Flotillin1/2 KO Jurkat T cells conjugated to SEE pulsed Raji B cells and stained with cell viability dye and CFDA, respectively. b Percentage of stable T–B cell conjugates determined as violet dye and CFDA double positives, relative to total cell population. c Flow cytometry quantification of WT and flotillin1/2 KO Jurkat T cells activated with soluble CD3ε and CD28 and fixed prior or 5, 10, and 20 min after activation. Cells were stained with antibodies against phosphorylated (left) TCRζ-pY142, (middle) Zap70-pY493, and (right) ERK-pY202/204. d Representative immunofluorescence microscopy images of WT and flotillin1/2 KO Jurkat T cells stained with antibodies against nuclear factor of activated T-cells (NFAT) and e the integrated NFAT fluorescence intensity over the Hoechst-stained nucleus in WT and flotillin1/2 KO Jurkat T cells activated or not with anti-CD3ε and CD28 antibodies. f Representative immunofluorescence microscopy images of WT and flotillin1/2 KO Jurkat T cells stained with antibodies against T-cell-specific adaptor protein (TSAd) and g the integrated TSAd fluorescence intensity over the Hoechst-stained nucleus in WT and flotillin1/2 KO Jurkat T cells activated or not with anti-CD3ε and CD28 antibodies. Scale bars, 5 µm. Data obtained from three or more independent experiments. Error bars indicate mean (±SEM). *p < 0.01; **p < 0.001; ****p < 0.00001; Mann–Whitney t-test
Fig. 8
Fig. 8
Flotillin expression is required for activation of mouse primary CD4 T cells. a Western blot of splenocyte lysate from WT and flotillin2 KO mice probed with antibodies against flotillin1 and flotillin2. be Representative flow cytometry histograms of CD4 T cells isolated from the spleen of WT or flotillin2 KO mice, activated on anti-CD3 and anti-CD28 surfaces for 20 and 36 h and stained with antibodies against CD69 (b) or CD25 (d). Mean fluorescent intensity (MFI) at the surface of 10,000 cells of WT and flotillin2 KO CD4 T cells stained with antibodies against CD69 (c) or CD25 (e). Data obtained from three mice for each condition. Error bars indicate mean (±SEM). *p < 0.01; **p < 0.001; ***p < 0.0001; ANOVA test

References

    1. Goldenring JR. Recycling endosomes. Curr. Opin. Cell Biol. 2015;35:117–122. doi: 10.1016/j.ceb.2015.04.018. - DOI - PMC - PubMed
    1. Taguchi T. Emerging roles of recycling endosomes. J. Biochem. 2013;153:505–510. doi: 10.1093/jb/mvt034. - DOI - PubMed
    1. Mellman I, Nelson WJ. Coordinated protein sorting, targeting and distribution in polarized cells. Nat. Rev. Mol. Cell Biol. 2008;9:833–845. doi: 10.1038/nrm2525. - DOI - PMC - PubMed
    1. Jones MC, Caswell PT, Norman JC. Endocytic recycling pathways: emerging regulators of cell migration. Curr. Opin. Cell Biol. 2006;18:549–557. doi: 10.1016/j.ceb.2006.08.003. - DOI - PubMed
    1. Montagnac G, Echard A, Chavrier P. Endocytic traffic in animal cell cytokinesis. Curr. Opin. Cell Biol. 2008;20:454–461. doi: 10.1016/j.ceb.2008.03.011. - DOI - PubMed

Publication types