. 2018 Apr 9:9:328.
doi: 10.3389/fphys.2018.00328. eCollection 2018.

Inhibitory Neural Regulation of the Ca 2+ Transients in Intramuscular Interstitial Cells of Cajal in the Small Intestine

Affiliations

Inhibitory Neural Regulation of the Ca 2+ Transients in Intramuscular Interstitial Cells of Cajal in the Small Intestine

Salah A Baker et al. Front Physiol. .

Abstract

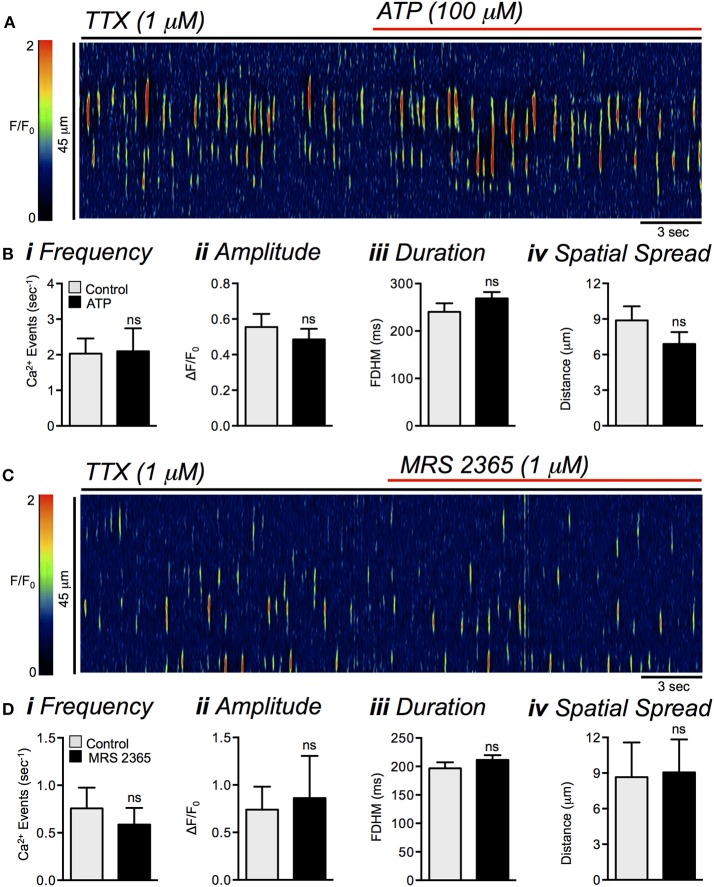
Gastrointestinal motility is coordinated by enteric neurons. Both inhibitory and excitatory motor neurons innervate the syncytium consisting of smooth muscle cells (SMCs) interstitial cells of Cajal (ICC) and PDGFRα+ cells (SIP syncytium). Confocal imaging of mouse small intestines from animals expressing GCaMP3 in ICC were used to investigate inhibitory neural regulation of ICC in the deep muscular plexus (ICC-DMP). We hypothesized that Ca2+ signaling in ICC-DMP can be modulated by inhibitory enteric neural input. ICC-DMP lie in close proximity to the varicosities of motor neurons and generate ongoing Ca2+ transients that underlie activation of Ca2+-dependent Cl- channels and regulate the excitability of SMCs in the SIP syncytium. Electrical field stimulation (EFS) caused inhibition of Ca2+ for the first 2-3 s of stimulation, and then Ca2+ transients escaped from inhibition. The NO donor (DEA-NONOate) inhibited Ca2+ transients and Nω-Nitro-L-arginine (L-NNA) or a guanylate cyclase inhibitor (ODQ) blocked inhibition induced by EFS. Purinergic neurotransmission did not affect Ca2+ transients in ICC-DMP. Purinergic neurotransmission elicits hyperpolarization of the SIP syncytium by activation of K+ channels in PDGFRα+ cells. Generalized hyperpolarization of SIP cells by pinacidil (KATP agonist) or MRS2365 (P2Y1 agonist) also had no effect on Ca2+ transients in ICC-DMP. Peptidergic transmitter receptors (VIP and PACAP) are expressed in ICC and can modulate ICC-DMP Ca2+ transients. In summary Ca2+ transients in ICC-DMP are blocked by enteric inhibitory neurotransmission. ICC-DMP lack a voltage-dependent mechanism for regulating Ca2+ release, and this protects Ca2+ handling in ICC-DMP from membrane potential changes in other SIP cells.

Keywords: Ca2+ imaging; SIP syncytium; VIP; enteric nervous system; gastrointestinal motility; nitric oxide; tonic inhibition.


Figures

Figure 1
Figure 1
Ca2+ transients in ICC-DMP are inhibited after initiation of nerve stimulation. (A) Representative ST map of Ca2+ transients in a single ICC-DMP taken from a recording in situ (60x objective). A color-coded overlay and calibration scale was imported to depict fluorescence intensity (F/F0) and enhance visualization of Ca2+ sites. Low fluorescence areas are indicated in dark blue or black. High intensity fluorescence areas are indicated in red and orange. EFS (10 Hz, for 5 s) was applied, as indicated by the white dashed box. The red dashed box highlights the initial 2 s of EFS. The white arrows near the beginning of the ST map indicate 3 specific Ca2+ firing sites and their firing activity is plotted in the traces shown in (B). (C–H) Summary data quantifying the effects of nerve evoked responses on ICC-DMP Ca2+ transient frequency (C), amplitude (D), duration (E), spatial spread (F), number of Ca2+ firing sites (G) and Ca2+ transient velocity (H) during the initial 2 s of EFS (n = 19, c = 48). All statistical analyses are in comparison to the pre-EFS period. ****P < 0.0001.
Figure 2
Figure 2
Escape from EFS inhibition occurs at variable times at diferent Ca2+ firing sites in ICC-DMP. (A) Representative ST map of Ca2+ transients in a single ICC-DMP in situ. The period of EFS (10 Hz; 5 s) is indicated by the white dashed box, and the red dashed box highlights the initial 2 s of EFS. (B) 3-D plots illustrating Ca2+ transient firing in the ICC-DMP shown in (A) in the 5 s pre-EFS (i), during EFS (ii), and post-EFS (iii). The white arrows in (Bii) highlight 2 distinct firing sites, which were inhibited during the initial phase of EFS and then escaped inhibition at different times. The durations of inhibition at site 1 and 2 are highlighted by the red and yellow dashed lines, respectively, and the activities of the 2 sites are plotted in (C). The initial 2 s of EFS is indicated by the red dashed box and green lines indicate different inhibition times for each site. (D) Summary histogram showing the number of Ca2+ firing sites contained in ICC-DMP (n = 19, c = 48). (E) Summary histogram showing the timing of the first Ca2+ firing site in ICC-DMP to escape from inhibition during EFS (n = 19, c = 48). (F) Summary histogram showing the times at which all Ca2+ firing sites in ICC-DMP escaped from inhibition during EFS (n = 19, c = 48).
Figure 3
Figure 3
EFS effects on Ca2+ transients in multiple ICC-DMP. (A) FOV of ICC-DMP in situ recorded with a 60x objective showing 2 adjacent cells illustrated by the green and red ROIs. The activities of these cells are plotted as ST maps of cell 1 (B) and cell 2 (C) represented in (A) which have been uniformly colored to show all Ca2+ activity in the cell as either red (cell 1) or green (cell 2). These ST maps are merged in (D). (E) FOV of ICC-DMP in situ recorded with a 60x objective showing 3 cells illustrated by the red, green, and blue ROIs. The summated Ca2+ activity is plotted in the color-coded traces shown in the bottom half of the panel with the period of EFS (10 Hz, 5 s) indicated by the dashed black box. Note that all 3 cells in the FOV ceased activity at the initiation of EFS, but Ca2+ transients escaped from inhibition at different points in time during stimulation.
Figure 4
Figure 4
Nitrergic modulation of basal Ca2+ transients in ICC-DMP. (A) Representative ST maps showing the effects of L-NNA (100 μM) on basal Ca2+ transients in ICC-DMP. (B) Summary bar graphs showing the effects of L-NNA (100 μM) on the frequency (i), amplitude (ii), duration (iii), and spatial spread (iv) of Ca2+ transients in ICC-DMP (n = 5, c = 11). (C) Representative ST maps showing the effects of DEA-NONOate (10 μM) on Ca2+ transients in ICC-DMP. (D) Summary graphs showing the effects of DEA-NONOate (10 μM) on the frequency (i), amplitude (ii), duration (iii), and spatial spread (iv) of Ca2+ transients in ICC-DMP (n = 5, c = 10). Paired t-test was used; ns = P > 0.05, *P < 0.05, **P < 0.01, ***P < 0.001.
Figure 5
Figure 5
Effects of L-NNA on EFS-evoked inhibition of Ca2+ transients. (A,B) Representative ST maps of ICC-DMP showing inhibition of Ca2+ transients initially during sustained EFS (A; EFS at 10 Hz for 5 s; indicated by the solid red line and dotted white box in ST maps) and the relief of EFS evoked inhibition on Ca2+ transients in the presence of L-NNA (100 μM; B). The dotted red box indicates the initial 2 s of sustained EFS. (C) Summary data showing the inhibitory effects of L-NNA (100 μM) on Ca2+ transient frequency (i), amplitude (ii), duration (iii), and spatial spread (iv) in ICC-DMP during control conditions (pre-EFS), and in the 1st 2 s of EFS (n = 5, c = 15). ns = P > 0.05, *P < 0.05, ****P < 0.0001.
Figure 6
Figure 6
The effect of MRS 2500 on basal activity and EFS-evoked inhibitory effects on Ca2+ responses. (A) Representative ST map showing lack of effects of MRS 2500 (1 μM) on basal Ca2+ transients in ICC-DMP. (B) Summary data showing the effects of MRS 2500 (1 μM) on basal Ca2+ transient activity in ICC-DMP. Neither frequency (i), amplitude (ii), duration (iii), or spatial spread (iv) were affected by MRS2500 (n = 5; c = 10; ns = P > 0.05). (C,D) Representative ST maps showing the effects of MRS 2500 (1 μM) on Ca2+ transients during EFS (10 Hz for 5 s; indicated by the red line and dotted white box in ST maps). (E) Summary data showing the lack of effects of MRS 2500 (1 μM) on the inhibition of Ca2+ transients during the first 2 s of EFS: frequency (i), amplitude (ii), duration (iii), and spatial spread (iv) in ICC-DMP during control conditions (pre-EFS), and within the first 2 s of sustained EFS (n = 5, c = 6). ns = P > 0.05.
Figure 7
Figure 7
Effects of combining L-NNA + MRS 2500 on EFS-evoked inhibitory Ca2+ responses in ICC-DMP. (A,B) Representative ST maps of ICC-DMP showing inhibition of Ca2+ transients initially during sustained EFS (A); EFS at 10 Hz for 5 s; indicated by the solid red line and dotted white box in ST maps) and the blockade of EFS evoked inhibition in response to a combination of L-NNA (100 μM) and MRS 2500 (1 μM; B). (C) Summary data showing the blockade of EFS evoked inhibitory effects by L-NNA (100 μM) + MRS 2500 (1 μM) on Ca2+ transient frequency (i), amplitude (ii), duration (iii), and spatial spread (iv) in ICC-DMP during control conditions (pre-EFS), and in the 1st 2 s of EFS (n = 9, c = 26). ns = P > 0.05, *P < 0.05, ****P < 0.0001.
Figure 8
Figure 8
Lack of effects of purinergic agonists on Ca2+ transients in ICC-DMP. (A) Representative ST map showing lack of effects of ATP (100 μM) on Ca2+ transients in ICC-DMP in the presence of TTX (1 μM). (B) Summary bar graphs showing the lack of effects of ATP (100 μM) on the frequency (i), amplitude (ii), duration (iii), and spatial spread (iv) of Ca2+ transients in ICC-DMP in the presence of TTX (n = 3, c = 6). ns = P > 0.05. (C) Representative ST maps showing the lack of effects of P2Y1 receptor agonist MRS 2365 (1 μM) on Ca2+ transients in ICC-DMP in the presence of TTX. (D) Summary bar graphs showing lack of the effects of MRS 2365 (1 μM) on the frequency (i), amplitude (ii), duration (iii), and spatial spread (iv) of Ca2+ transients in ICC-DMP in the presence of TTX (n = 3, c = 5). ns = P > 0.05.
Figure 9
Figure 9
The effects of pinacidil on Ca2+ transients in ICC-DMP. (A) Representative ST maps showing the effects of pinacidil (10 μM) on Ca2+ transients in ICC-DMP in the presence of TTX (1 μM). (B) Summary bar graphs showing the effects of pinacidil (10 μM) on the frequency (i), amplitude (ii), duration (iii), and spatial spread (iv) of Ca2+ transients in ICC-DMP in the presence of TTX (n = 4, c = 16). ns = P > 0.05.
Figure 10
Figure 10
Expression of genes encoding nitrergic and peptidergic signaling molecules in ICC. (A) Quantitative PCR (qPCR) data showing the relative expression of transcripts for Gucy1a1 and Gucy1b1, protein kinase cGMP-dependent type 1: Prkg1, and inositol-1,4,5 triphosphate receptor I-associated G kinase substrate (IRAG; Mrvi1) in sorted small intestinal ICC by FACS and unsorted cells (total cell population). qPCR data is expressed as relative expression, normalized to Gapdh, n = 4. (B) qPCR data showing the relative expression of transcripts for Vipr1 and Vipr2 (VIP receptors) and Adcyplr1 (PACAP receptor) in FACS sorted small intestinal ICC and unsorted cells (total cell population). qPCR data is expressed as relative expression, normalized to Gapdh, n = 4.
Figure 11
Figure 11
Effects of a soluble guanylyl cyclase (sGC) inhibitor and activator on Ca2+ transients in ICC-DMP. (A) Representative ST maps showing the effects of sGC inhibitor ODQ (10 μM) on ICC-DMP Ca2+ transients. (B) Summary graphs showing the effect of ODQ on the frequency (i), amplitude (ii), duration (iii), and spatial spread (iv) of spontaneous Ca2+ transients in ICC-DMP (n = 11, c = 25). Note that Ca2+ transient events in ICC-DMP were increased in the presence of ODQ. (C) Representative ST maps showing the effect of sGC activator Bay 58-2667 (1 μM) on Ca2+ transients. (D) Summary graphs showing the inhibitory effects of Bay 58-2667 on the frequency (i), amplitude (ii), duration (iii), and spatial spread (iv) of Ca2+ transients (n = 5, c = 14). ns = P > 0.05, *P < 0.05, **P < 0.01, ***P < 0.001, ****P < 0.0001.
Figure 12
Figure 12
Effects of soluble guanylyl cyclase (sGC) inhibitor (ODQ) on EFS-evoked inhibitory Ca2+ responses in ICC-DMP. (A,B) Representative ST maps showing Ca2+ transient events inhibition in response to nerve stimulation (EFS at 10 Hz for 5 s; indicated by the red line and dotted white box in ST maps) as shown in (A). EFS failed to induce inhibitory effects on Ca2+ transients In the presence of ODQ (10 μM) as shown in (B). (C) Summary data showing the effects of ODQ (10 μM) on Ca2+ transient frequency (i), amplitude (ii), duration (iii), and spatial spread (iv) in ICC-DMP during control conditions (pre-EFS), and in the 1st 2 s of EFS and in the presence of ODQ (n = 3, c = 12). ns = P > 0.05, *P < 0.05, **P < 0.01, ****P < 0.0001.
Figure 13
Figure 13
PKG inhibitors had no effect on basal Ca2+ transients in ICC-DMP. (A) Representative ST maps showing the effect of KT 5823 (1 μM) on Ca2+ spontaneous transients in ICC-DMP. (B) Summary graphs showing the lack of effect of KT 5823 on the frequency (i), amplitude (ii), duration (iii), and spatial spread (iv) of basal Ca2+ transients in ICC-DMP (n = 4, c = 11). (C) Representative ST maps showing the lack of effect of Rp-8-pCPT-cGMPS (10 μM) on basal Ca2+ transients in ICC-DMP. (D) Summary graphs showing the lack of effect of Rp-8-pCPT-cGMPS on the frequency (i), amplitude (ii), duration (iii), and spatial spread (iv) of Ca2+ transients in ICC-DMP (n = 8, c = 21). ns = P > 0.05.
Figure 14
Figure 14
VIP modulation of spontaneous ICC-DMP Ca2+ transients. (A) Representative ST maps showing the effects of VIP (100 nM) on Ca2+ transients in ICC-DMP. (B) Summary graphs showing the effect of VIP on the frequency (i), amplitude (ii), duration (iii), and spatial spread (iv) of Ca2+ transients in ICC-DMP (n = 5, c = 12). (C) Representative ST maps showing the effect of VIP 6-28 (10 μM) on basal Ca2+ transients in ICC-DMP. (D) Summary graphs showing the effect of VIP 6–28 on the frequency (i), amplitude (ii), duration (iii), and spatial spread (iv) of Ca2+ transients in ICC-DMP (n = 5, c = 23). ns = P > 0.05, **P < 0.01, ***P < 0.001.
Figure 15
Figure 15
VIP 6-28 failed to block inhibitory responses in ICC-DMP to EFS. (A,B) Representative ST maps showing the effects of VIP 6-28 (10 μM) on Ca2+ transients in response to EFS (10 Hz 5 s; indicated by the red line and dotted white box in ST maps). (C) Summary data showing the inhibitory effects of VIP 6-28 (10 μM) on Ca2+ transient frequency (i), amplitude (ii), duration (iii), and spatial spread (iv) in ICC-DMP during control conditions (pre-EFS), and in the 1st 2 s of EFS (n = 5, c = 16). ns = P > 0.05, *P < 0.05, **P < 0.01.

References

    1. Baker S. A., Drumm B. T., Saur D., Hennig G. W., Ward S. M., Sanders K. M. (2016). Spontaneous Ca2+ transients in interstitial cells of Cajal located within the deep muscular plexus of the murine small intestine. J. Physiol. 594, 3317–3338. 10.1113/JP271699 - DOI - PMC - PubMed
    1. Baker S. A., Drumm B. T., Skowronek K. E., Rembetski B. E., Peri L. E., Hennig G. W., et al. (2018). Excitatory neuronal responses of Ca+2 transients in interstitial cells of cajal in the small intestine. ENEURO 0080–18.2018. 10.1523/ENEURO.0080-18.2018 - DOI - PMC - PubMed
    1. Baker S. A., Hennig G. W., Salter A. K., Kurahashi M., Ward S. M., Sanders K. M. (2013). Distribution and Ca2+ signalling of fibroblast-like (PDGFR(+)) cells in the murine gastric fundus. J. Physiol. 591, 6193–6208. 10.1113/jphysiol.2013.264747 - DOI - PMC - PubMed
    1. Baker S. A., Hennig G. W., Ward S. M., Sanders K. M. (2015). Temporal sequence of activation of cells involved in purinergic neurotransmission in the colon. J. Physiol. 593, 1945–1963. 10.1113/jphysiol.2014.287599 - DOI - PMC - PubMed
    1. Banks B. E., Brown C., Burgess G. M., Burnstock G., Claret M., Cocks T. M., et al. (1979). Apamin blocks certain neurotransmitter-induced increases in potassium permeability. Nature 282, 415–417. 10.1038/282415a0 - DOI - PubMed

LinkOut - more resources