Review
. 2018 Apr 9:9:356.
doi: 10.3389/fphys.2018.00356. eCollection 2018.

Modeling the Electrophysiological Properties of the Infarct Border Zone

Affiliations
Review

Modeling the Electrophysiological Properties of the Infarct Border Zone

Caroline Mendonca Costa et al. Front Physiol. .

Abstract

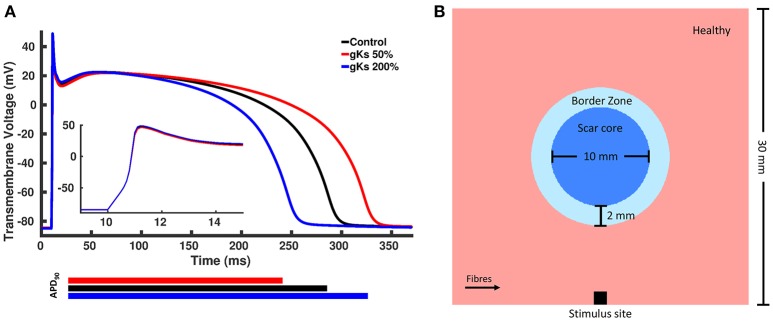
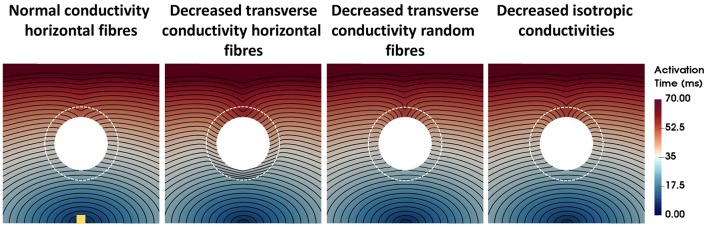
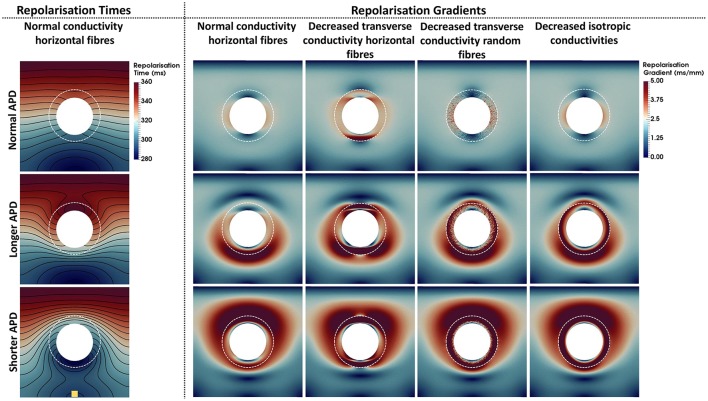
Ventricular arrhythmias (VA) in patients with myocardial infarction (MI) are thought to be associated with structural and electrophysiological remodeling within the infarct border zone (BZ). Personalized computational models have been used to investigate the potential role of the infarct BZ in arrhythmogenesis, which still remains incompletely understood. Most recent models have relied on experimental data to assign BZ properties. However, experimental measurements vary significantly resulting in different computational representations of this region. Here, we review experimental data available in the literature to determine the most prominent properties of the infarct BZ. Computational models are then used to investigate the effect of different representations of the BZ on activation and repolarization properties, which may be associated with VA. Experimental data obtained from several animal species and patients with infarct show that BZ properties vary significantly depending on disease's stage, with the early disease stage dominated by ionic remodeling and the chronic stage by structural remodeling. In addition, our simulations show that ionic remodeling in the BZ leads to large repolarization gradients in the vicinity of the scar, which may have a significant impact on arrhythmia simulations, while structural remodeling plays a secondary role. We conclude that it is imperative to faithfully represent the properties of regions of infarction within computational models specific to the disease stage under investigation in order to conduct in silico mechanistic investigations.

Keywords: cardiac electrophysiology; computational modeling; gray zone; infarct border zone; myocardial infarct.


Figures

Figure 1
Figure 1
Schematic representation of the distinct types of BZ. Healthy myocardium is represented in pink, scar core in black and BZ in gray.
Figure 2
Figure 2
(A) Action potentials of the control and two modified models. The blue line represents the model with shorter action potential duration (APD) obtained by increasing the conductance of the slow rectifying potassium current, gKs, to 200% of the control value, whereas the red line represents the model with longer APD obtained by decreasing gKs to 50% of the control value and the black line represented the control model with unchanged parameters. (B) Rectangular tissue model with a circumferential scar. The whole tissue measures 30 mm × 30 mm, where the scar core measures 10 mm in diameter and is surrounded by a 2 mm thick BZ. Healthy myocardium is represented in pink, scar core in dark blue and BZ in light blue. Fibers in healthy myocardium are always aligned with the x axis, whereas at the BZ, fibers are either aligned with the x axis or randomly oriented. Stimuli are delivered at the center of the bottom tissue edge.
Figure 3
Figure 3
Activation times for four computational representations of the BZ with normal APD. The Scar core is shown as a white filled circle, whereas the interface of BZ with normal tissue is marked as a dashed white circle. The stimulus site is represented by the yellow square at the bottom left panel. The stimulus site was the same for all simulations. Activation times ranging from 0 ms (blue) to 70 ms (red) are shown for the four models. The columns show, from left to right, the models with normal conductivity, decreased transverse conductivity with horizontal fibers, decreased transverse conductivity with random fibers, and decreased isotropic conductivities in the BZ.
Figure 4
Figure 4
Repolarization times and gradients computed for the 12 computational representations of the BZ. The Scar core is shown as a white filled circle, whereas the interface of BZ with normal tissue is marked as a dashed white circle. The stimulus site is represented by the yellow square at the bottom left panel. The stimulus site was the same for all simulations. The left column shows the repolarization time maps. Repolarization times ranging from 280 ms (blue) to 360 ms (red) are shown for the models with normal conductivities and horizontal fibers. The second to fifth columns from left to right show the repolarization gradients. Gradients range from 0 ms/mm (dark blue) to 5 ms/mm (dark red). The upper, central, and bottom rows show the models where the APD was set to normal, longer, or shorter than normal tissue, respectively. The second to fifth columns show, from left to right, the models with normal conductivity, decreased transverse conductivity with horizontal fibers, decreased transverse conductivity with random fibers, and decreased isotropic conductivities in the BZ.

References

    1. Adelman J. P., Maylie J., Sah P. (2012). Channels: form and function. Annu. Rev. Physiol. 74, 245–69. 10.1146/annurev-physiol-020911-153336 - DOI - PubMed
    1. Arevalo H., Plank G., Helm P., Halperin H., Trayanova N. (2013). Tachycardia in Post-Infarction Hearts: insights from 3D Image-Based Ventricular Models. PLoS ONE 8:e68872. 10.1371/journal.pone.0068872 - DOI - PMC - PubMed
    1. Arevalo H. J., Helm P. A., Trayanova N. A. (2008). Development of a model of the infarcted canine heart that predicts arrhythmia generation from specific cardiac geometry and scar distribution. Comput. Cardiol. 35, 497–500. 10.1109/CIC.2008.4749087 - DOI
    1. Arevalo H. J., Vadakkumpadan F., Guallar E., Jebb A., Malamas P., Wu K. C., et al. . (2016). Arrhythmia risk stratification of patients after myocardial infarction using personalized heart models. Nat. Commun. 7:11437. 10.1038/ncomms11437 - DOI - PMC - PubMed
    1. Ashikaga H., Arevalo H., Vadakkumpadan F., Blake R. C., Bayer J. D., Nazarian S., et al. . (2013). Feasibility of image-based simulation to estimate ablation target in human ventricular arrhythmia. Heart Rhythm 10, 1109–1116. 10.1016/j.hrthm.2013.04.015 - DOI - PMC - PubMed