

Comparison of six different methods to calculate cell densities
- PMID: 29686723
- PMCID: PMC5901878
- DOI: 10.1186/s13007-018-0297-4
Comparison of six different methods to calculate cell densities
Abstract
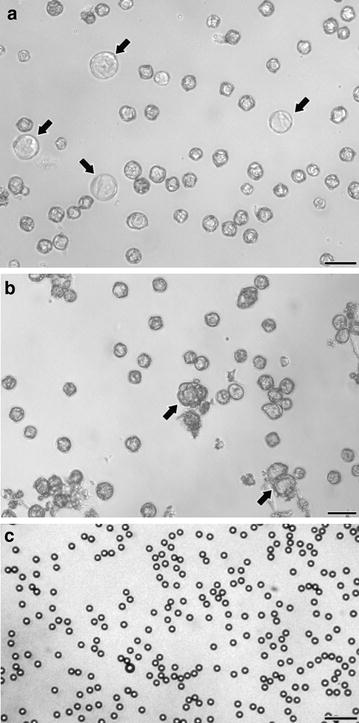
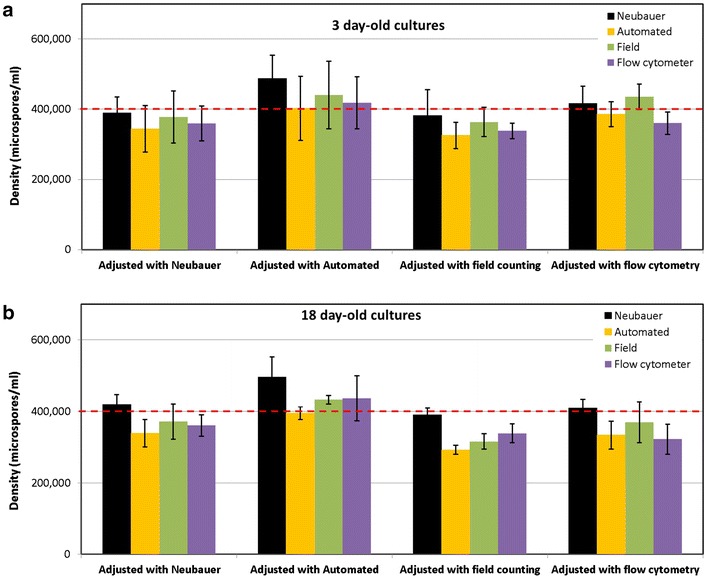
Background: For in vitro culture of plant and animal cells, one of the critical steps is to adjust the initial cell density. A typical example of this is isolated microspore culture, where specific cell densities have been determined for different species. Out of these ranges, microspore growth is not induced, or is severely reduced. A similar situation occurs in many other plant and animal cell culture systems. Traditionally, researchers have used counting chambers (hemacytometers) to calculate cell densities, but little is still known about their technical advantages. In addition, much less information is available about other, alternative methods. In this work, using isolated eggplant microspore cultures and fluorescent beads (fluorospheres) as experimental systems, we performed a comprehensive comparison of six methods to calculate cell densities: (1) a Neubauer improved hemacytometer, (2) an automated cell counter, (3) a manual-counting method, and three flow cytometry methods based on (4) autofluorescence, (5) propidium iodide staining, and (6) side scattered light (SSC).
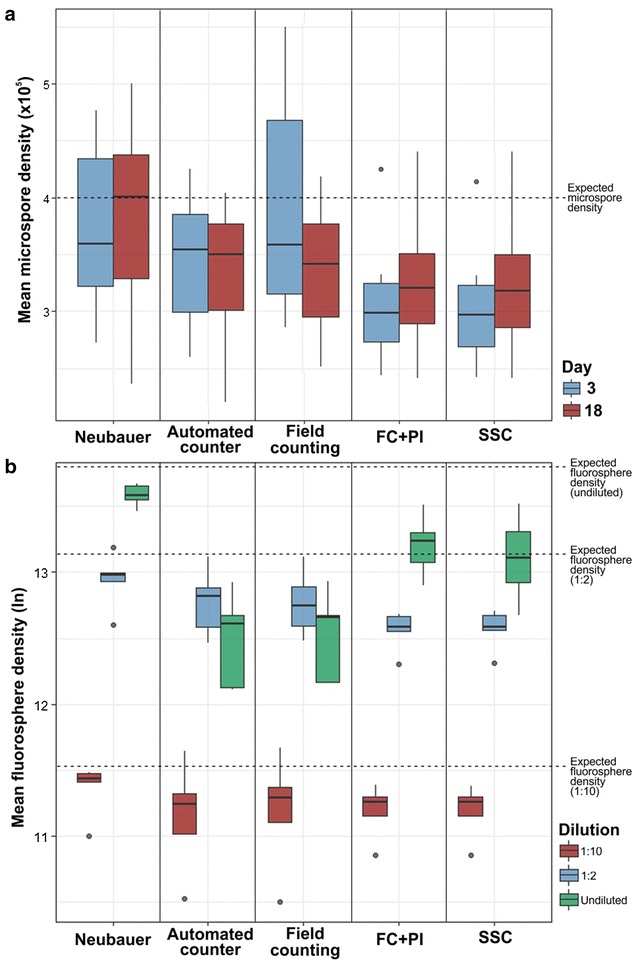
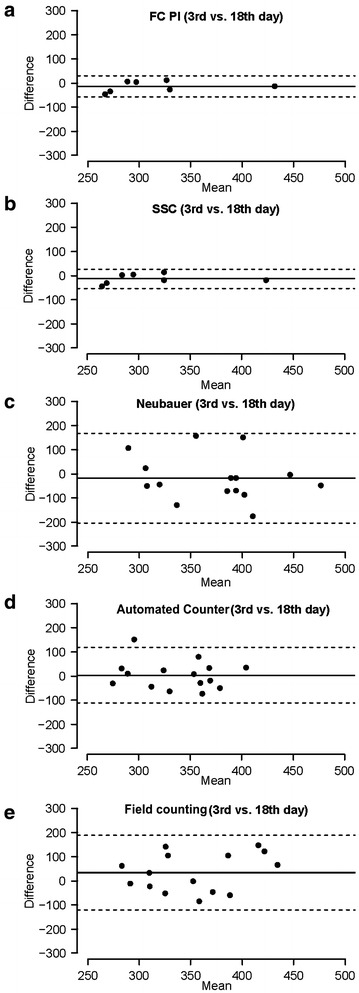
Results: Our results show that from a technical perspective, hemacytometers are the most reasonable option for cell counting, which may explain their widely spread use. Automated cell counters represent a good compromise between precision and affordability, although with limited accuracy. Finally, the methods based on flow cytometry were, by far, the best in terms of reproducibility and agreement between them, but they showed deficient accuracy and precision.
Conclusions: Together, our results show a thorough technical evaluation of each counting method, provide unambiguous arguments to decide which one is the most convenient for the particular case of each laboratory, and in general, shed light into the best way to determine cell densities for in vitro cell cultures. They may have an impact in such a practice not only in the context of microspore culture, but also in any other plant cell culture procedure, or in any process involving particle counting.
Keywords: Automated cell counter; Cell counting; Flow cytometry; Fluorospheres; Hemacytometer; Image analysis; Microscopy; Microspore culture.
Figures

Similar articles
-
Accurate measurement of peripheral blood mononuclear cell concentration using image cytometry to eliminate RBC-induced counting error.J Immunol Methods. 2013 Feb 28;388(1-2):25-32. doi: 10.1016/j.jim.2012.11.010. Epub 2012 Nov 29. J Immunol Methods. 2013. PMID: 23201386
-
Manual versus computer-automated semen analyses. Part I. Comparison of counting chambers.Fertil Steril. 1996 Jan;65(1):150-5. doi: 10.1016/s0015-0282(16)58043-1. Fertil Steril. 1996. PMID: 8557132
-
Multi-volume hemacytometer.Sci Rep. 2021 Jul 8;11(1):14106. doi: 10.1038/s41598-021-93477-1. Sci Rep. 2021. PMID: 34238959 Free PMC article.
-
Continuing developments with the automated platelet count.Int J Lab Hematol. 2007 Apr;29(2):77-91. doi: 10.1111/j.1751-553X.2007.00909.x. Int J Lab Hematol. 2007. PMID: 17474881 Review.
-
Scaling up cell-counting efforts in neuroscience through semi-automated methods.iScience. 2023 Aug 7;26(9):107562. doi: 10.1016/j.isci.2023.107562. eCollection 2023 Sep 15. iScience. 2023. PMID: 37636060 Free PMC article. Review.
Cited by
-
High-throughput quantification of the effect of DMSO on the viability of lung and breast cancer cells using an easy-to-use spectrophotometric trypan blue-based assay.Histochem Cell Biol. 2019 Jul;152(1):75-84. doi: 10.1007/s00418-019-01775-7. Epub 2019 Feb 16. Histochem Cell Biol. 2019. PMID: 30778673 Free PMC article.
-
Modulation of calcium, callose synthesis, membrane permeability and pectin methyl-esterase activity affect cell wall composition and embryo yield during Brassica napus microspore embryogenesis.Ann Bot. 2025 Sep 2;136(1):99-110. doi: 10.1093/aob/mcaf054. Ann Bot. 2025. PMID: 40229941 Free PMC article.
-
Isolation of fungi using the diffusion chamber device FIND technology.Beilstein J Org Chem. 2019 Sep 19;15:2191-2203. doi: 10.3762/bjoc.15.216. eCollection 2019. Beilstein J Org Chem. 2019. PMID: 31598176 Free PMC article.
-
Calcium dynamics and modulation in carrot somatic embryogenesis.Front Plant Sci. 2023 Mar 31;14:1150198. doi: 10.3389/fpls.2023.1150198. eCollection 2023. Front Plant Sci. 2023. PMID: 37063186 Free PMC article.
-
Comprehensive analysis of cellular metrics: From proliferation to mitochondrial membrane potential and cell death in a single sample.Cell Death Discov. 2025 Mar 24;11(1):119. doi: 10.1038/s41420-025-02391-2. Cell Death Discov. 2025. PMID: 40128566 Free PMC article.
References
-
- Kobayashi T, Higashi K, Saitou T, Kamada H. Physiological properties of inhibitory conditioning factor(s), inhibitory to somatic embryogenesis, in high-density cell cultures of carrot. Plant Sci. 1999;144:69–75. doi: 10.1016/S0168-9452(99)00062-X. - DOI
-
- Castillo AM, Valles MP, Cistue L. Comparison of anther and isolated microspore cultures in barley. Effects of culture density and regeneration medium. Euphytica. 2000;113:1–8. doi: 10.1023/A:1003937530907. - DOI
LinkOut - more resources
Full Text Sources
Other Literature Sources
