. 2018 Mar 1:2018:9158187.
doi: 10.1155/2018/9158187. eCollection 2018.

Secondary Degeneration of Auditory Neurons after Topical Aminoglycoside Administration in a Gerbil Model

Affiliations

Secondary Degeneration of Auditory Neurons after Topical Aminoglycoside Administration in a Gerbil Model

Jae-Hun Lee et al. Biomed Res Int. .

Abstract

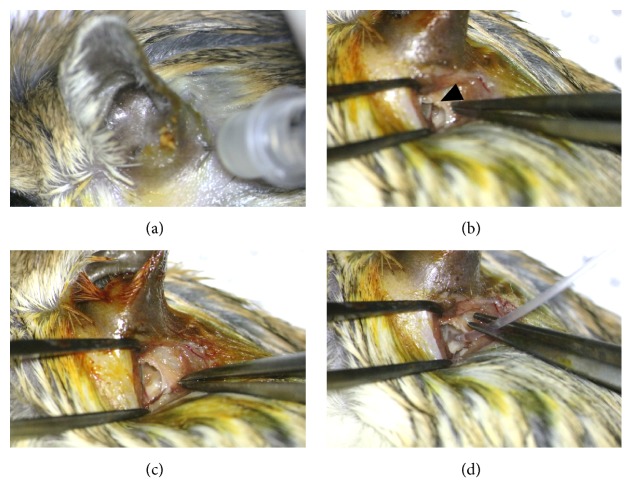
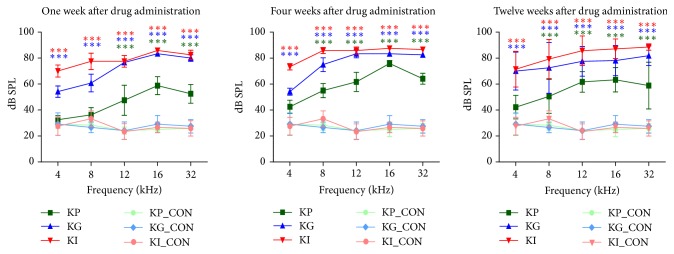
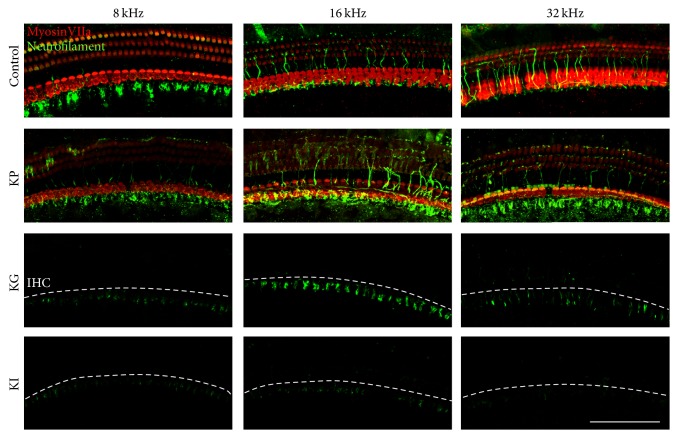
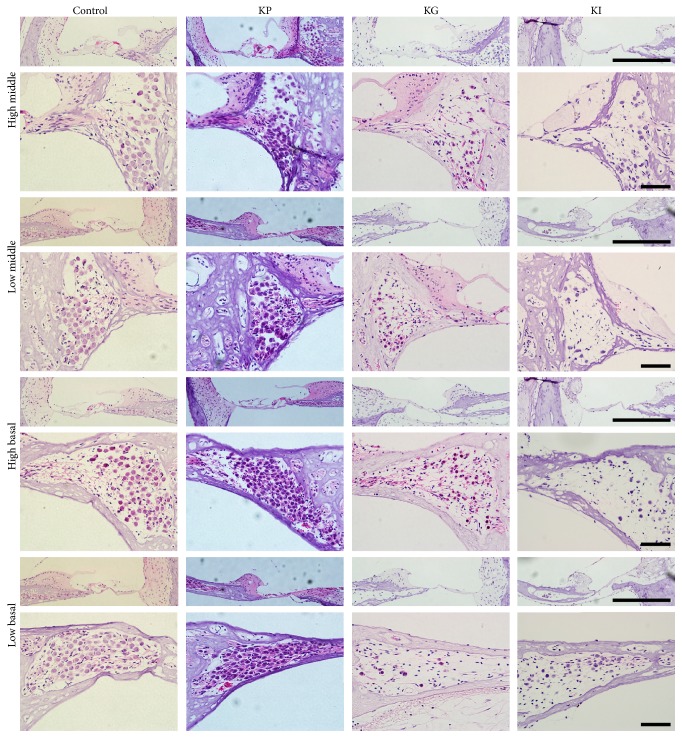
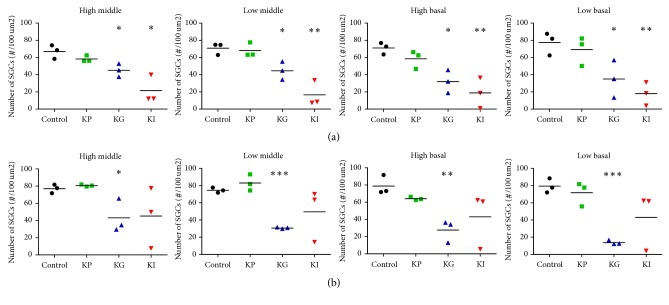
Hair cells in the cochlea can be damaged by various causes. Damaged hair cells can lead to additional destruction of parts of the auditory afferent pathway sequentially, which is called secondary degeneration. Recently, researches regarding cochlear implants have been actively carried out for clinical purposes; secondary degeneration in animals is a much more practical model for identifying the prognosis of cochlear implants. However, an appropriate model for this research is not established yet. Thus, we developed a secondary degeneration model using an ototoxic drug. 35 gerbils were separated into four different groups and kanamycin was applied via various approaches. ABR was measured several times after drug administration. SGCs were also counted to identify any secondary degeneration. The results showed that outer and inner HCs were damaged in all kanamycin-treated groups. Twelve weeks after kanamycin treatment, the round window membrane injection group showed severe subject differences in hair cells and SGC damage, whereas the gelfoam group showed consistent and severe damage in hair cells and SGCs. In this study, we successfully induced secondary degeneration in hair cells in a gerbil model. This model can be used for various purposes in the hearing research area either for treatment or for preservation.


Figures

Figure 1
Figure 1
Drug delivery via different methods. The KM solution was injected by a syringe to the KP group (a). A small hole on the bulla was made and the RWM (black arrowhead) was exposed (b). A gelfoam with KM was placed on the RWM for the KG group (c). The tip of a cannula was inserted in the RWM niche for the KI group (d).
Figure 2
Figure 2
Serial changes of the hearing threshold after drug administration. Hearing thresholds at multiple frequencies were measured at three different time points (1 week, 4 weeks, and 12 weeks) for kanamycin percutaneous (KP), kanamycin gelfoam (KG), and kanamycin RW injection (KI) groups. See Methods for more descriptions. In the KP group, hearing thresholds increased at high frequency regions (12, 16, and 32 kHz) at four weeks after drug administration and these increased thresholds remained until 12 weeks after drug administration. KG group showed a more severe hearing threshold change at all time points. KI group showed the worst hearing thresholds change at all tested frequencies and all test points (∗∗∗p < 0.001).
Figure 3
Figure 3
Epifluorescence analysis of the OC at 12 weeks after drug administration. Hair cells (MyosinVIIa, red) and the peripheral auditory nerve (Neurofilament, green) were observed at three parts of the cochlea that are tonotopically responsible for 8, 16, and 32 kHz of hearing. The control group showed intact hair cells and nerve fibers. KP group showed intact IHCs and a few defects of OHCs at three different parts. Nerve fiber connections from hair cells to SGCs were disrupted in the KP group. In the KG and KI groups, IHCs and OHCs completely disappeared and only fragments of nerve fibers were observed. The three groups were kanamycin percutaneous (KP), kanamycin gelfoam (KG), and kanamycin RW injection (KI). The white dotted lines represent the IHC place. Scale bar is 100 um.
Figure 4
Figure 4
Histologic analysis of the OC and SGCs at four different parts of the cochlea at 4 weeks after drug administration. At 4 weeks after drug administration, OC was intact in both KP and KG groups, but the KG group showed a flat epithelium without any sensory cells at all parts except the high middle part. In the KG group, a damaged spiral limbus (black arrowhead) was found at the high basal part. The KI group also showed severely damaged OC at all parts of the cochlea. The KG group showed no reduction of SGC density, showing a similar result to the control group. The KG group showed sparse SGCs at low middle, high basal, and low basal parts of the cochlea. The KI group showed sparse SGCs at all parts of the cochlea. The three groups were kanamycin percutaneous (KP), kanamycin gelfoam (KG), and kanamycin RW injection (KI). Scale bar represents 100 um.
Figure 5
Figure 5
Histologic analysis of the OC and SGCs at four different parts of the cochlea at 12 weeks after drug administration. At 12 weeks after drug administration, the OC was intact in the KP group, but the KG group showed a flat epithelium without any sensory cells at all parts except the high middle part. The KI group showed a disrupted OC at all parts of the cochlea. The KP group showed no reduction of SGC density, showing a similar result to the control group. However, the KG group showed sparse SGCs at all parts of the cochlea, which is more severe than 4 weeks after drug administration. For the KI group, more severe depletion of SGCs was found at all parts of the cochlea. The three groups were kanamycin percutaneous (KP), kanamycin gelfoam (KG), and kanamycin RW injection (KI). Scale bar represents 100 um.
Figure 6
Figure 6
SGC densities at four different parts of the cochlea at 4 (a) and 12 weeks (b) after drug administration. The KP group showed no significant decrease in SGC densities compared to the control at both 4 and 12 weeks. The KG group showed a significant SGC density decrease at all locations at both time points. The KI group showed a significant SGC density decrease at all locations at the 4-week time point but did not show a significant decrease at the 12-week time point. All units in the plot (black dot: control; green square: KP; blue triangle: KG; red inverted triangle: KI) represent individual subjects. The three groups were kanamycin percutaneous (KP), kanamycin gelfoam (KG), and kanamycin RW injection (KI). The asterisk () indicates a p value lower than .05, the double asterisk (∗∗) indicates a p value lower than .01, and the triple asterisk (∗∗∗) indicates a p value lower than .001.

Similar articles

Cited by

References

    1. Spoendlin H. Factors inducing retrograde degeneration of the cochlear nerve. Annals of Otology, Rhinology & Laryngology. 1984;93(4):76–82. - PubMed
    1. Leake P. A., Hradek G. T. Cochlear pathology of long term neomycin induced deafness in cats. Hearing Research. 1988;33(1):11–33. doi: 10.1016/0378-5955(88)90018-4. - DOI - PubMed
    1. Kroon S., Ramekers D., Smeets E. M., Hendriksen F. G. J., Klis S. F. L., Versnel H. Degeneration of auditory nerve fibers in guinea pigs with severe sensorineural hearing loss. Hearing Research. 2017;345:79–87. doi: 10.1016/j.heares.2017.01.005. - DOI - PubMed
    1. Gao K., Ding D., Sun H., Roth J., Salvi R. Kanamycin Damages Early Postnatal, but Not Adult Spiral Ganglion Neurons. Neurotoxicity Research. 2017;32(4):603–613. doi: 10.1007/s12640-017-9773-2. - DOI - PMC - PubMed
    1. Abbas L., Rivolta M. N. Aminoglycoside ototoxicity and hair cell ablation in the adult gerbil: A simple model to study hair cell loss and regeneration. Hearing Research. 2015;325:12–26. doi: 10.1016/j.heares.2015.03.002. - DOI - PMC - PubMed

LinkOut - more resources