. 2018 Mar 1;5(4):429-444.
doi: 10.1002/acn3.540. eCollection 2018 Apr.

Axonal abnormalities in vanishing white matter

Affiliations

Axonal abnormalities in vanishing white matter

Melanie D Klok et al. Ann Clin Transl Neurol. .

Abstract

Objective: We aimed to study the occurrence and development of axonal pathology and the influence of astrocytes in vanishing white matter.

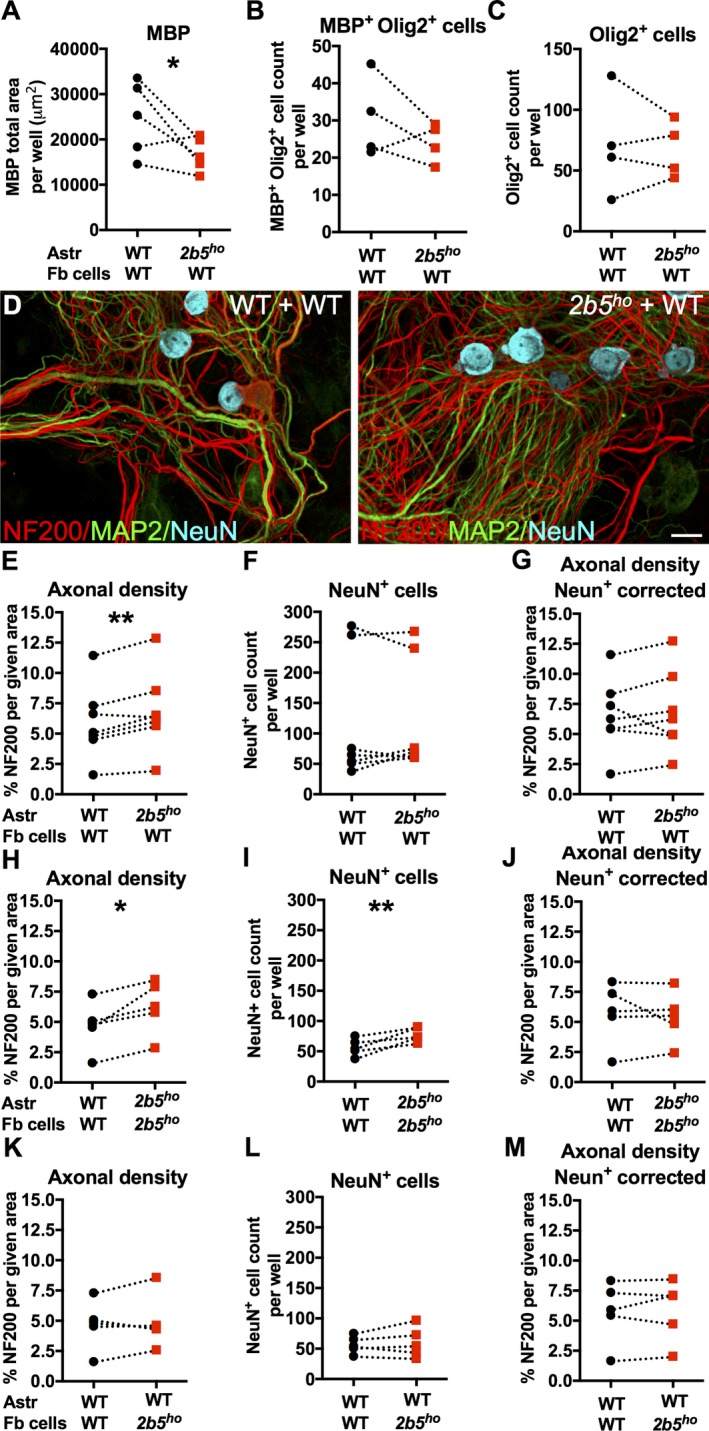
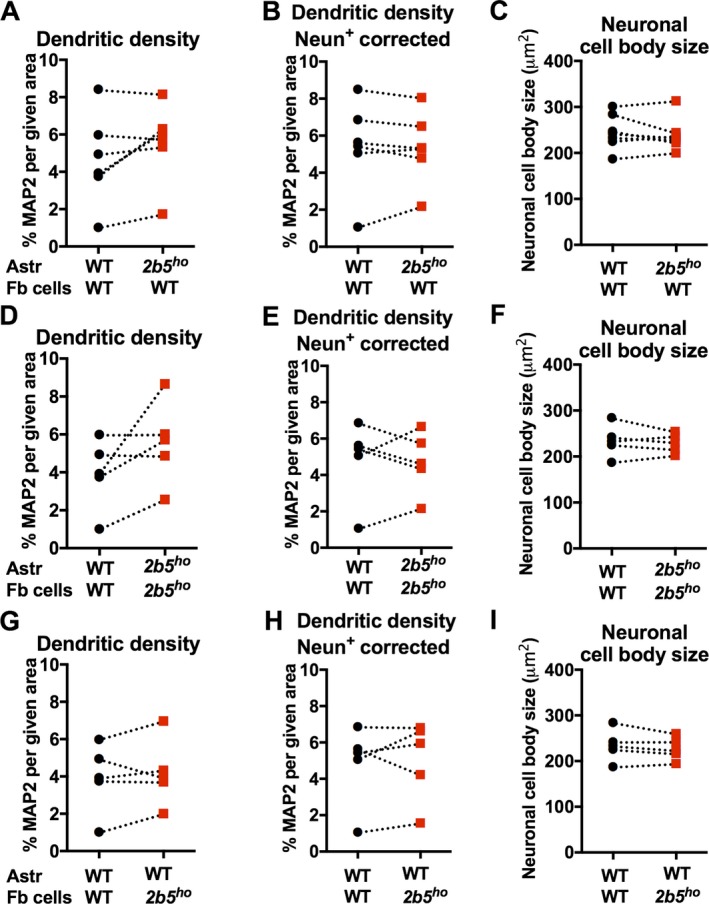
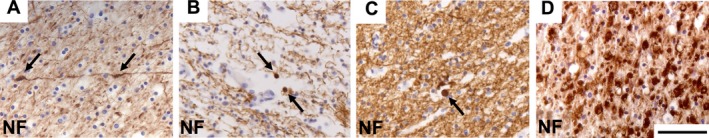
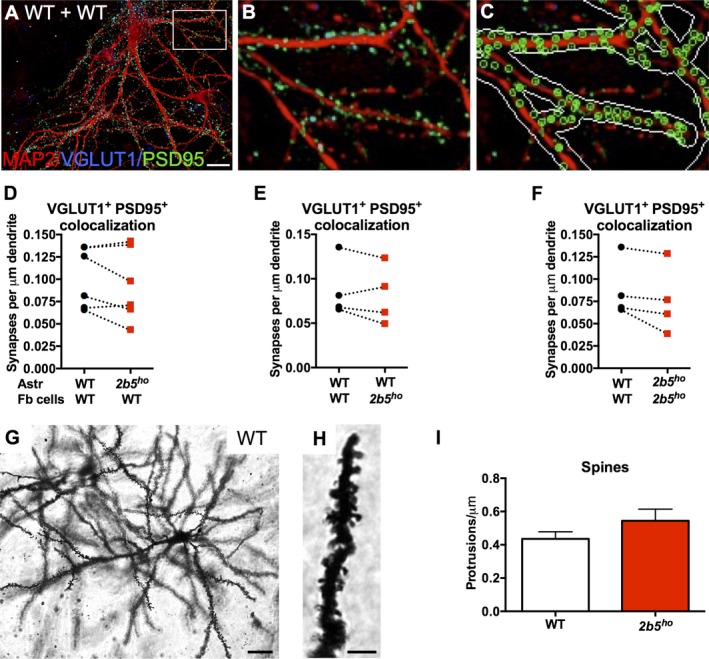
Methods: Axons and myelin were analyzed using electron microscopy and immunohistochemistry on Eif2b4 and Eif2b5 single- and double-mutant mice and patient brain tissue. In addition, astrocyte-forebrain co-culture studies were performed.

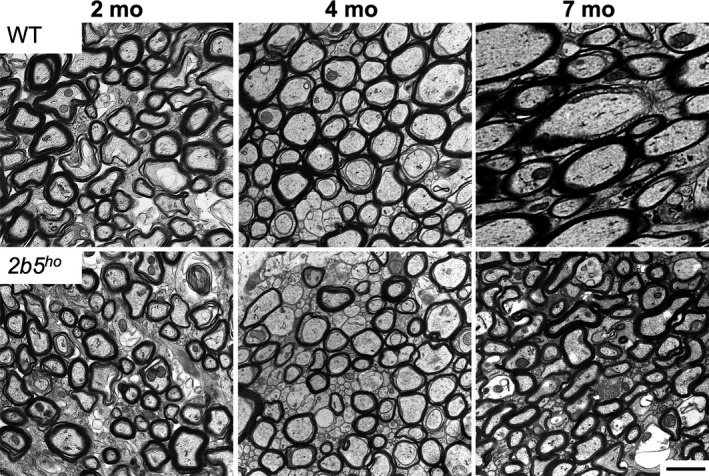
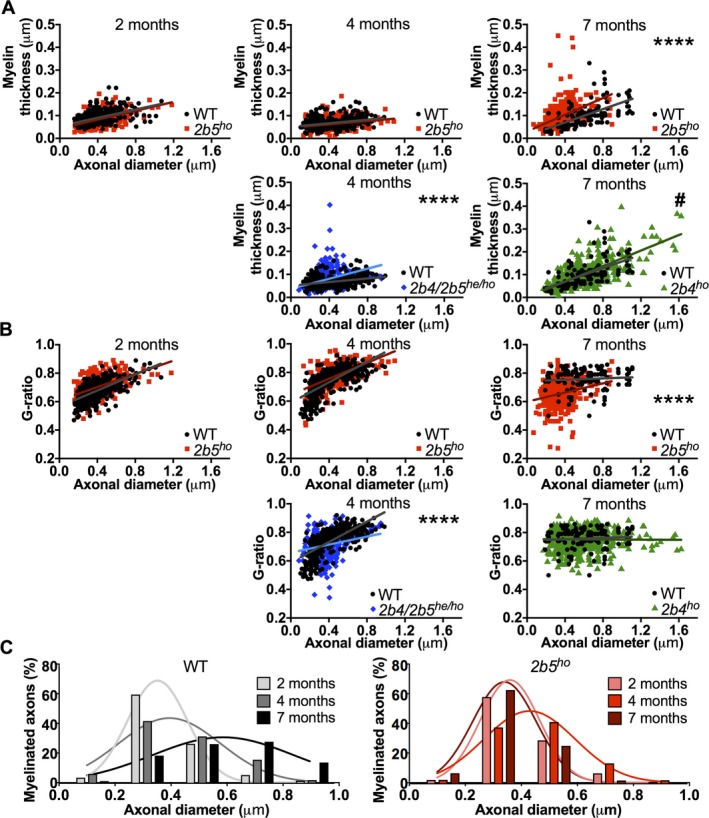
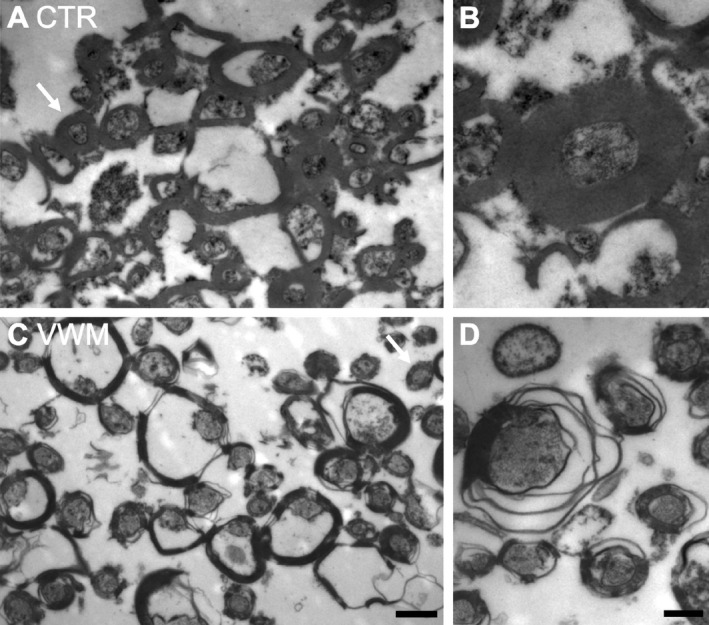
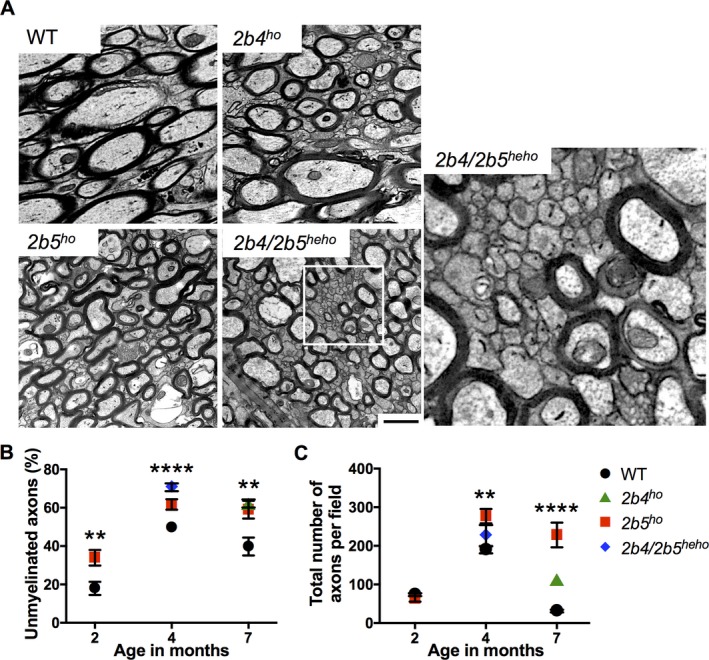
Results: In the corpus callosum of Eif2b5-mutant mice, myelin sheath thickness, axonal diameter, and G-ratio developed normally up to 4 months. At 7 months, however, axons had become thinner, while in control mice axonal diameters had increased further. Myelin sheath thickness remained close to normal, resulting in an abnormally low G-ratio in Eif2b5-mutant mice. In more severely affected Eif2b4-Eif2b5 double-mutants, similar abnormalities were already present at 4 months, while in milder affected Eif2b4 mutants, few abnormalities were observed at 7 months. Additionally, from 2 months onward an increased percentage of thin, unmyelinated axons and increased axonal density were present in Eif2b5-mutant mice. Co-cultures showed that Eif2b5 mutant astrocytes induced increased axonal density, also in control forebrain tissue, and that control astrocytes induced normal axonal density, also in mutant forebrain tissue. In vanishing white matter patient brains, axons and myelin sheaths were thinner than normal in moderately and severely affected white matter. In mutant mice and patients, signs of axonal transport defects and cytoskeletal abnormalities were minimal.

Interpretation: In vanishing white matter, axons are initially normal and atrophy later. Astrocytes are central in this process. If therapy becomes available, axonal pathology may be prevented with early intervention.


Figures

Figure 1
Figure 1
EM pictures of wild‐type and 2b5 ho mouse corpus callosum at 2, 4, and 7 months of age. Axonal diameters in 7‐month‐old 2b5 ho are smaller than in wild‐type mice. Scale bar: 1 μm for all pictures.
Figure 2
Figure 2
Disproportionally smaller axonal diameter and lower G‐ratio in VWM mouse corpus callosum in more severely affected animals. (A) Whereas axonal diameter and myelin sheath thickness were normal or close to normal in 2‐ and 4‐month‐old 2b5 ho mice, axonal diameter was smaller in 7‐month‐old 2b5 ho than in wild‐type mice (wild‐type median 0.61 vs. 2b5 ho median 0.33, Z = −11.05, ****P < 0.0001, r = 0.46), while myelin sheath thickness remained close to normal. In the 2b4/2b5 heho mice, myelin sheaths were thicker than normal (wild‐type median 0.64 vs. 2b4/2b5 heho median 0.75, Z = −3.91, ****P < 0.0001, r = 0.14). In the 2b4 ho mice, the axons were smaller compared to wild‐type mice (wild‐type median 0.61 vs. 2b4 ho median 0.49, Z = −2.89, #P = 0.0039, r = 0.11; which is a borderline significant trend with a Bonferroni‐corrected P value of 0.0033 for all 15 comparisons performed in A and B). Slopes of correlations between myelin sheath thickness and axonal diameter were similar between wild‐type mice and 2b4 ho and 2b5 ho mutants, but slightly higher in the 4‐month‐old 2b4/2b5 heho mice. (B) G‐ratio's were comparable in 2‐ and 4‐month‐old wild‐type and 2b5 ho mice and in 7‐month‐old wild‐type and 2b4 ho mice. Aberrant G‐ratios were detected for 4‐month‐old 2b4/2b5 heho mice (wild‐type median 0.76 vs. 2b4/2b5 heho median 0.72, Z = −5.78, ****P < 0.0001, r = 0.20) and 7‐month‐old 2b5 ho mice (wild‐type median 0.78 vs. 2b5 ho median 0.66, Z = ‐11.68, ***P < 0.001, r = 0.49). (C) Wild‐type mice showed a clear shift to thicker myelinated axons from 2 to 4, to 7 months of age, whereas the 2b5 ho mice showed a shift to thicker axons from 2 to 4 months but shifted back to smaller axons at 7 months, comparable as the 2‐month‐old mice. (A, B) Mann‐Whitney U test.
Figure 3
Figure 3
Thinner myelin in vanishing white matter patients’ corpus callosum. EM on formalin‐fixed tissue of (A, B) a control and (C, D) a vanishing white matter subject showed that, although several tissue preparation artifacts were present, myelin sheaths were thinner in patients’ corpus callosum than in the control (arrows indicate axons of similar size but with different myelin sheath thicknesses). (A, C) Scale bar: 1 μm. (B, D) Pictures zoomed in on an axon. Scale bar: 500 nm.
Figure 4
Figure 4
More thin unmyelinated axons and higher axonal density in VWM mouse corpus callosum. (A) EM pictures showing thin and unmyelinated axons in corpus callosum of 7‐month‐old 2b4 ho and 2b5 ho mice and 4‐month‐old 2b4/2b5 heho mice compared to 7‐month‐old wild‐type mice. Scale bar: 1 μm for all pictures. Picture on the right is zoomed in picture of 2b4/2b5 heho mouse. (B) Quantification (at least 10 fields of view per genotype and age) showed higher percentages of unmyelinated axons in VWM mice than in wild‐type mice at 2 months (wild‐type median 11 vs. 2b5 ho median 35, Z = −2.88, **P < 0.01, r = 0.47 by Mann–Whitney U test), 4 months (H(2) = 22.81, ****P < 0.0001 by Kruskal–Wallis test, where 2b5 ho and 2b4/2b5 heho mice differ from wild‐type mice by Mann–Whitney U test, Z = −3.17, P < 0.01, r = 0.48 and Z = 4.38, P < 0.0001, r = 0.74, respectively), and 7 months (H(2) = 9.65, **P < 0.01 by Kruskal–Wallis test, where 2b4 ho and 2b5 ho mice differ significantly from wild‐type mice by Mann–Whitney U test, Z = −2.80, P < 0.01, r = 0.52 and Z = −2.09, P value below Bonferroni‐corrected P of 0.025, r = 0.40, respectively). (C) Quantification of the total number of axons per field of view (at least 10 fields of view per genotype and age) showed higher axonal densities in the VWM mice than in the wild‐type mice at 4 months (H(2) = 12.93, **P < 0.01 by Kruskal–Wallis test, where 2b5 ho mice differ from wild‐type mice by Mann–Whitney U test, Z = ‐3.66, P < 0.001, r = 0.55) and 7 months (H(2) = 29.85, ****P < 0.0001 by Kruskal–Wallis test, where 2b4 ho and 2b5 ho mice differ from wild‐type mice by Mann–Whitney U test, Z = ‐4,32, P < 0.0001, r = 0.80 and Z = −4.36, P < 0.0001, r = 0.81, respectively). Data represent mean ± SEM.
Figure 5
Figure 5
Higher axonal density in VWM astrocyte‐based co‐culture. (A) MBP amounts (t(5.03) = ‐2.73, P < 0.05, r = 0.77) and in most cultures (B) percentages of MBP‐expressing Olig2+ cell numbers (although overall not significant, t(4.03) = −1.69, P = 0.17, r = 0.64) were lower when wild‐type forebrain mixed cells were cultured on 2b5 ho astrocytes than if cultured on wild‐type astrocytes, while having no effect on (C) the total number of Olig2+ cells (P = 0.68). (D) Co‐culture of wild‐type forebrain cells on wild‐type versus 2b5 ho astrocytes stained for axons (NF200, red), dendrites (MAP2, green), and neuronal cell bodies (NeuN, cyan). For the sake of clarity, the astrocytes themselves are not shown. Scale bar: 20 μm. A higher axonal density was obtained when wild‐type forebrain cells (t(7.07) = 3.86, **P < 0.01, r = .82, (E) or 2b5 ho forebrain cells (t(5.07) = 2.52, P = .052, r = 0.75, not shown) were cultured on 2b5 ho astrocytes than on wild‐type astrocytes, which was partly related to variance in neuronal cell numbers (F, G). (H) A similar effect on axonal density was detected in cultures consisting of two layers of 2b5 ho cells in comparison to wild‐type cells (t(5.10) = 3.92, *P < 0.05, r = 0.89), associated with a higher neuronal cell number (t(49.08) = 3.28, **P < 0.01, r = 0.42, (I, J). No effect on axonal density was detected when 2b5 ho forebrain cells in comparison to wild‐type forebrain cells were cultured on either wild‐type astrocytes (KM) or 2b5 ho astrocytes (not shown). (EM) The different plots present data of the same five to seven individual experiments. Each data point represents the mean of an individually performed experiment, for the specified co‐culture combination. Statistics were obtained by multi‐level analysis on the raw data of all experiments combined. Astr = astrocyte monolayer; Fb cells = forebrain cells.
Figure 6
Figure 6
No significant differences in dendritic density and neuronal cell body size between co‐cultures consisting of 2b5 ho versus wild‐type mouse‐derived cells. No effect of 2b5 ho in comparison to wild‐type astrocytes on neuronal cell body size was detected when wild‐type forebrain cells (AC) or 2b5 ho forebrain cells (not shown) were cultured on top. Also two layers of 2b5 ho versus wild‐type cells (DF) or 2b5 ho forebrain cells on either (C) wild‐type astrocytes or 2b5 ho astrocytes (not shown) did not give a difference in dendritic density or neuronal cell body size. (AI) The different plots present data of the same five to seven individual experiments, the same experiments as plotted in Fig. 4. Each data point represents the mean of an individually performed experiment, for the specified co‐culture combination. Statistics were obtained by multi‐level analysis on the raw data of all experiments combined. Astr = astrocyte monolayer; Fb cells = forebrain cells.
Figure 7
Figure 7
Axonal damage in VWM patients’ white matter. (A) NF‐staining of frontal lobe of a 37‐yr‐old VWM patient showed a few swellings (arrows). (B) Frontal lobe of a 10‐yr‐old VWM patient showed a few spheroids (arrows), whereas tissue damage was severe. (C) Internal capsule of the same 10‐yr‐old VWM patient showed one spheroid (arrow), whereas tissue damage was meager. (D) NF staining of occipital lobe of the same 37‐yr‐old VWM patient showed many axonal swellings and spheroids, while the tissue and myelin (not shown) was relatively intact. Scale bar: 50 μm for all.
Figure 8
Figure 8
No difference in synapse or spine density in primary co‐cultures or along primary apical dendrites of layer V pyramidal neurons (A) Co‐culture of wild‐type forebrain cells on wild‐type astrocytes stained for dendrites (MAP2, red), presynapses (VGLUT1, cyan), and postsynapses (PSD95, green). For the sake of clarity, the astrocytes themselves are not shown. Scale bar: 20 μm. (B) Zoomed in picture of boxed area in A. (C) Identification of dendrites and synapses included in quantification. No difference in synaptic density was detected when wild‐type forebrain cells (D) or 2b5 ho forebrain cells (not shown) were cultured on 2b5 ho astrocytes compared to wild‐type astrocytes (P = 0.17 and P = 0.40, respectively). Also no significant effect of 2b5 ho versus wild‐type forebrain cells was detected on either (E) wild‐type or (not shown) 2b5 ho astrocytes (P = 0.09 and P = 0.20, respectively). (F) Two layers of 2b5 ho cells in comparison to wild‐type cells resulted in a trend for a lower synaptic density ((t(5.09) = −2.334, P = 0.07, r = 0.72). (G, H) Golgi‐stained mouse layer V pyramidal neuron. (G) Scale bar: 20 μm. (H) Scale bar: 5 μm. (I) No difference in spine density was detected along primary apical dendrites of wild‐type and 2b5 ho layer V pyramidal neurons. (D‐F) The different plots present data of the same four to six individual experiments. Each data point represents the mean of an individually performed experiment, for the specified co‐culture combination. Statistics were obtained by multi‐level analysis on the raw data of all experiments combined. Astr = astrocyte monolayer; Fb cells = forebrain cells.

Similar articles

Cited by

References

    1. van der Knaap MS, Pronk JC, Scheper GC. Vanishing white matter disease. Lancet Neurol 2006;5:413–423. - PubMed
    1. Fogli A, Schiffmann R, Bertini E, et al. The effect of genotype on the natural history of eIF2B‐related leukodystrophies. Neurology 2004;62:1509–1517. - PubMed
    1. Hanefeld F, Holzbach U, Kruse B, et al. Diffuse white matter disease in three children: an encephalopathy with unique features on magnetic resonance imaging and proton magnetic resonance spectroscopy. Neuropediatrics 1993;24:244–248. - PubMed
    1. Schiffmann R, Moller JR, Trapp BD, et al. Childhood ataxia with diffuse central nervous system hypomyelination. Ann Neurol 1994;35:331–340. - PubMed
    1. van der Knaap MS, Barth PG, Gabreëls FJ, et al. A new leukoencephalopathy with vanishing white matter. Neurology 1997;48:845–855. - PubMed

LinkOut - more resources