. 2018 Apr 20;5(2):ENEURO.0007-18.2018.
doi: 10.1523/ENEURO.0007-18.2018. eCollection 2018 Mar-Apr.

Firing of Putative Dopamine Neurons in Ventral Tegmental Area Is Modulated by Probability of Success during Performance of a Stop-Change Task

Affiliations

Firing of Putative Dopamine Neurons in Ventral Tegmental Area Is Modulated by Probability of Success during Performance of a Stop-Change Task

Stephen S Tennyson et al. eNeuro. .

Abstract

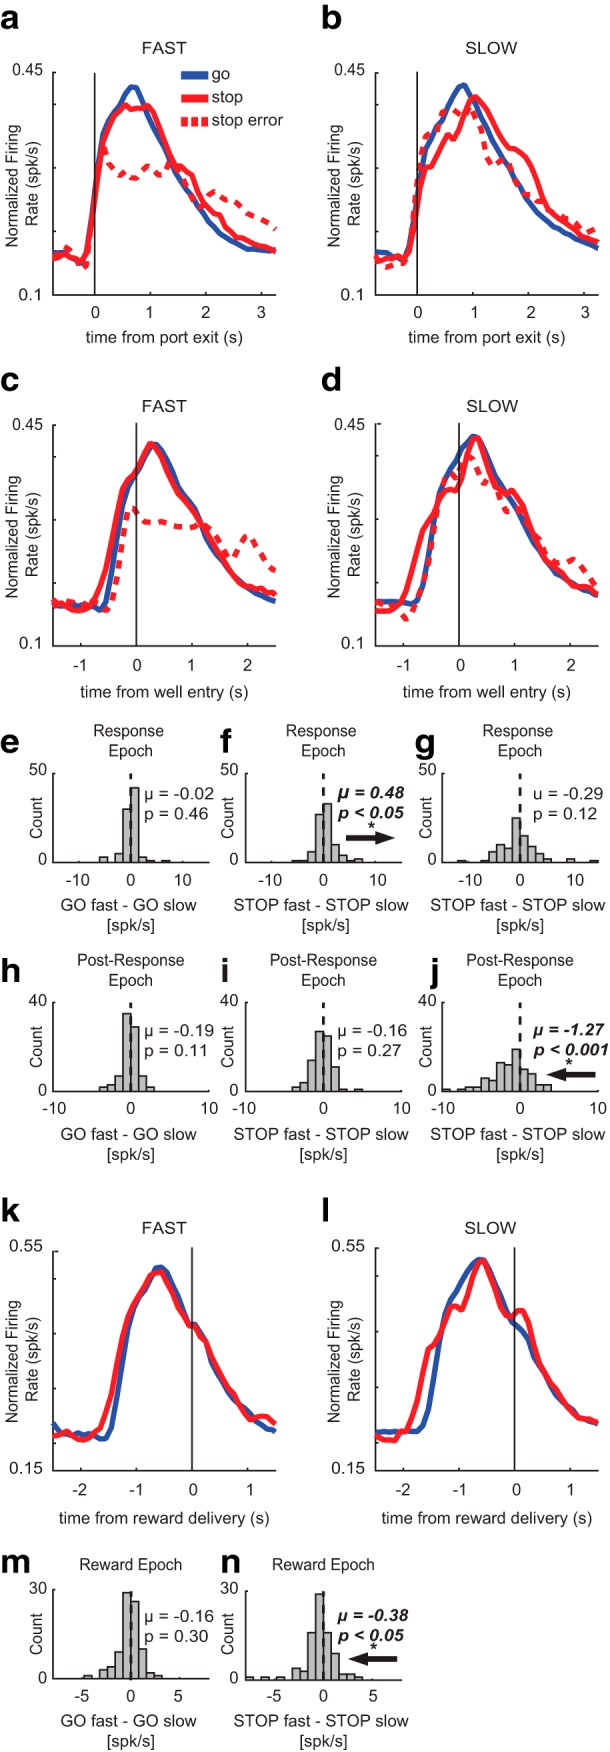
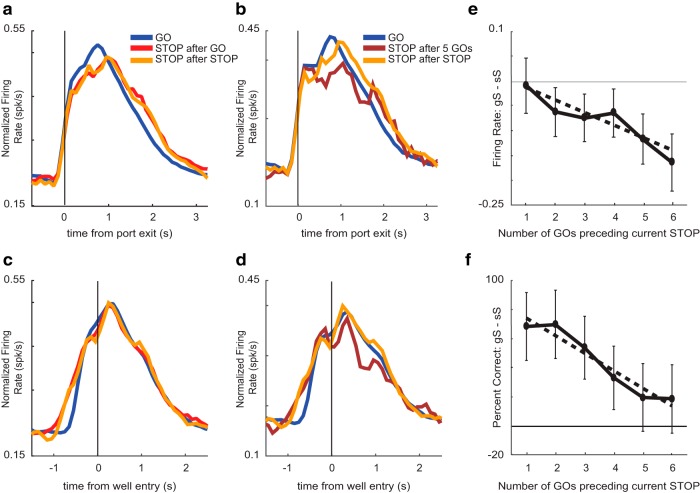
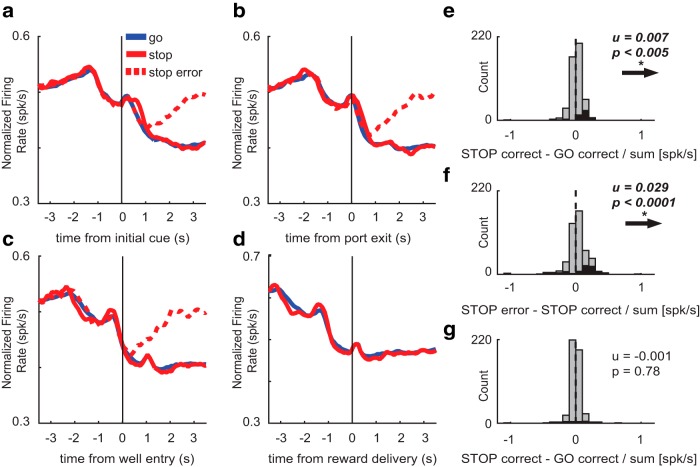
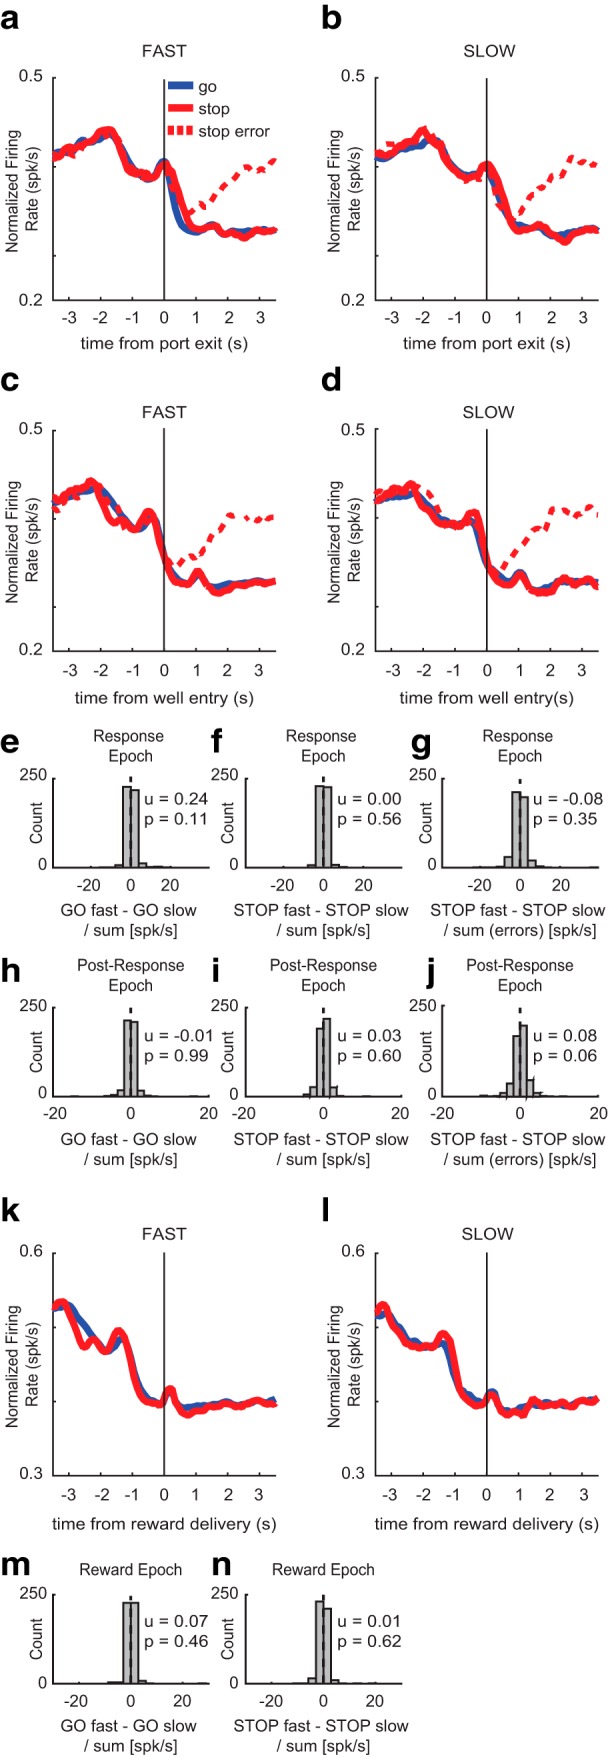
Response inhibition, the ability to refrain from unwanted actions, is an essential component of complex behavior and is often impaired across numerous neuropsychiatric disorders such as addiction, attention-deficit hyperactivity disorder (ADHD), schizophrenia, and obsessive-compulsive disorder. Accordingly, much research has been devoted to characterizing brain regions responsible for the regulation of response inhibition. The stop-signal task, a task in which animals are required to inhibit a prepotent response in the presence of a STOP cue, is one of the most well-studied tasks of response inhibition. While pharmacological evidence suggests that dopamine (DA) contributes to the regulation of response inhibition, what is exactly encoded by DA neurons during performance of response inhibition tasks is unknown. To address this issue, we recorded from single units in the ventral tegmental area (VTA), while rats performed a stop-change task. We found that putative DA neurons fired less and higher to cues and reward on STOP trials relative to GO trials, respectively, and that firing was reduced during errors. These results suggest that DA neurons in VTA encode the uncertainty associated with the probability of obtaining reward on difficult trials instead of the saliency associated with STOP cues or the need to resolve conflict between competing responses during response inhibition.

Keywords: conflict; dopamine; inhibition; neuron; rat; stop signal.


Figures

Figure 1.
Figure 1.
Task design and behavioral analysis. A, House lights signaled the rat to nose poke and wait inside a central odor port for 1000 ms before one of two directional cue lights were illuminated for 100 ms, directing the rat to the left or right adjacent fluid well to receive fluid reward. On 20% of trials, on port exit, the opposite-sided cue light would illuminate, requiring the rat to stop the initial action and respond in the opposite direction to receive reward. After entering the correct fluid well, rats were required to hold in the well for a variable period between 800 and 1000 ms before reward delivery. B, There are three trial types used in our analysis, STOP trials, GO trials, and STOP errors by two directions for each. C, Bar graph shows percentage correct scores as a function of all trials. D, Movement time behavior across correct and incorrect STOP (red) and GO (blue) trials. E, Correlation between STOP movement time (in seconds) on correct STOP trials versus average STOP percentage correct across each session (t test, p < 0.05). F, The impact of previous trial on current trial performance and conflict adaptation. Percentage correct shown across GO and STOP trials preceded by either a GO (gG, gS, left column) or STOP trial (sG, sS, right column). G, Location of recording sites (Paxinos and Watson, 2007). Boxes mark the extent of recording locations based on histology.
Figure 2.
Figure 2.
Putative DA firing was higher for GO trials during the response period but higher for STOPs at the time of reward. A, Single-cell example of a putative DA neuron aligned to port exit that fired more for GO trials (left) than STOP trials (right). B, The same single-cell example from A aligned to reward delivery, showing higher firing to reward on STOP trials (right) compared to GO trials (left). C, The same single-cell example from A, B aligned to reward delivery and zoomed in on the reward response, showing higher firing on STOP trials (right) compared to GO trials (left). D, The same single-cell example from A, B zoomed in on the response following well entry, showing higher firing on correct STOP trials (left) compared to STOP errors (right). E–H, Population average histograms of putative DA neurons plotted over trial time for GO (blue), STOP (red), and STOP error (dashed) trials while aligning to multiple events (n = 85). Activity is aligned to initial GO cue (E), port exit (F), well entry (G), and reward delivery (H). E, At the time of the initial cue, firing rate increases rapidly for all trial types. F, During the response epoch (the period from port exit to well entry, when the STOP cue was illuminated on STOP trials), firing was significantly higher on GO trials compared to STOP trials. G, During the post-response epoch (the 800 ms period following well entry), firing was significantly lower on STOP errors compared to STOP corrects. H, During the reward epoch (500 ms period after reward delivery), firing was significantly higher on STOP trials than GO trials. Error trials are excluded since reward is not delivered on errors. IK, Population average distributions for significant effects described above. Arrows depict direction of distribution shift for significant effects. Black bars represent the number of neurons that showed a significant difference between GO and STOP corrects (I, K) and correct and incorrect STOP trials (J; Wilcoxon, p < 0.05). Distributions are determined to be significantly different from zero via Wilcoxon. I, K, Firing rate during the response and reward epoch were compared during correct STOPs and GOs by computing a trial type index (STOP correct – GO correct/STOP correct + GO correct). J, Firing rate during the post-response epoch was compared in correct and incorrect STOP trials (STOP error – STOP correct/STOP error + STOP correct).
Figure 3.
Figure 3.
Movement time effects on putative DA firing. To determine whether putative DA activity was affected by speed of behavioral response, average population histograms were split into fast and slow trials based on movement time within each session and then averaged across sessions. A–D, K, L, Average population histograms for fast and slow movement times for GO (blue), STOP (red), and STOP error (dashed) trials, aligned to port exit (A, B), well entry (C, D), and reward delivery (K, L). E–J, M, N, Population average distributions for effects between fast and slow trials. Arrows depict direction of distribution shift for significant effects. A, B, Activity was aligned to port exit for fast and slow movement times. E–G, Firing rates were compared between fast and slow trial types during the response epoch by calculating trial type indices for GO trials (GO fast – GO slow), STOP trials (STOP fast – STOP slow), and STOP errors (STOP error fast – STOP error slow). During the response epoch, firing was significantly less on slow STOP trials compared to fast STOP trials (F), but there was no difference in firing between fast and slow GO trials (E) or STOP errors (G). C, D, Activity was aligned to well entry for fast and slow movement times. HJ, Firing rates were compared between fast and slow trial types during the post-response epoch by calculating trial type indices described above. During the post-response epoch, firing on fast STOP errors was significantly lower than firing on slow STOP errors (J). There was no significant difference in firing between fast and slow GO (H) or STOP trials (I). K, L, Activity was aligned to reward delivery for fast and slow movement times. M, N, Firing rates were compared between fast and slow trials during the reward epoch by calculating trial type indices for GO trials (GO fast – GO slow) and STOP trials (STOP fast – STOP slow). During the reward epoch, firing was significantly higher on slow STOP trials compared to fast STOP trials (N). There was no significant difference between fast and slow GO trials at the time of reward (M).
Figure 4.
Figure 4.
Effects of trial order on putative DA firing. Average putative DA activity (n = 85) plotted for GO trials, STOP trials preceded by a GO trial (gS), and STOP trials preceded by a STOP trial (sS). For reference, GO trials have the lowest conflict, while gS trials have the highest conflict. A, C, Average population histogram for GO trials (blue), gS (red), and sS (orange) trial types aligned to port exit (A) and well entry (C). B, D, Average population histogram for GO trials (blue), STOP trials after five GO trials (maroon), and sS trials (orange) aligned to port exit (B) and well entry (D). E, To quantify effects, we computed indices on firing rates to compare sS to STOP trials with one to six previous GO trials (gS – sS/gS + sS) during the post-response epoch. F, Percentage correct behavior on STOP trials preceded by one through six GO trials.
Figure 5.
Figure 5.
Characterization of non-DA firing. A–D, Population average histograms of non-DA neurons plotted over trial time for GO (blue), STOP (red), and STOP error (dashed) trials while aligning to multiple events (n = 475). Activity is aligned to initial GO cue (A), port exit (B), well entry (C), and reward delivery (D). A, At the time of the initial cue, firing rate increases for all trial types. B, During the response epoch, firing was significantly higher on STOP trials compared to GO trials. C, During the post-response epoch, firing was significantly higher on STOP errors compared to STOP corrects. D, During the reward epoch, there was no significant difference in firing between STOP and GO trials. Error trials are excluded since reward is not delivered on errors. E–G, Population average distributions for significant effects described above. Arrows depict direction of distribution shift for significant effects. Black bars represent the number of neurons that showed a significant difference between GO and STOP corrects (E, G) and correct and incorrect STOP trials (F; Wilcoxon, p < 0.05). Distributions are determined to be significantly different from zero via Wilcoxon. E, G, Firing rate during the response and reward epoch were compared during correct STOPs and GOs by computing a trial type index (STOP correct – GO correct/STOP correct + GO correct). F, Firing rate during the post-response epoch was compared in correct and incorrect STOP trials (STOP error – STOP correct/STOP error + STOP correct).
Figure 6.
Figure 6.
Movement time effects on non-DA firing. To determine whether non-DA activity was affected by speed of behavioral response, average population histograms were split into fast and slow trials based on movement time. A–D, K, L, Average population histograms for fast and slow movement times for GO (blue), STOP (red), and STOP error (dashed) trials, aligned to port exit (A, B), well entry (C, D), and reward delivery (K, L). A, B, Activity was aligned to port exit for fast and slow movement times. E–G, Firing rates were compared between fast and slow trial types during the response epoch by calculating trial type indices for GO trials (GO fast – GO slow/GO fast + GO slow), STOP trials (STOP fast – STOP slow/STOP fast + STOP slow), and STOP errors [STOP fast – STOP slow/STOP fast + STOP slow (errors)]. C, D, Activity aligned to well entry for fast and slow movement times. H–J, Firing rates were compared between fast and slow trial types during the post-response epoch using indices described above. K, L, Activity was aligned to reward delivery for fast and slow movement times. M, N, Firing rates were compared between fast and slow trials during the reward epoch by calculating the same trial-type indices described above.
Figure 7.
Figure 7.
Effects of trial order on non-DA firing. Average non-DA activity (n = 475) plotted for GO trials, STOP trials preceded by a GO trial (gS), and STOP trials preceded by a STOP trial (sS). A, C, Average population histogram for GO trials (blue), gS (red), and sS (orange) trial types aligned to port exit (A) and well entry (C). B, D, Average population histogram for GO trials (blue), STOP trials after five GO trials (maroon), and sS trials (orange) aligned to port exit (B) and well entry (D). E, To quantify effects, we computed indices on firing rates to compare sS to STOP trials with one to six previous GO trials gS to GO trials (gS – GO/gS + GO) during the post-response epoch. F, Percentage correct behavior on STOP trials preceded by one through six GO trials.

Similar articles

Cited by

References

    1. Aron AR, Dowson JH, Sahakian BJ, Robbins TW (2003) Methylphenidate improves response inhibition in adults with attention-deficit/hyperactivity disorder. Biol Psychiatry 54:1465–1468. - PubMed
    1. Bari A, Eagle DM, Mar AC, Robinson ES, Robbins TW (2009) Dissociable effects of noradrenaline, dopamine, and serotonin uptake blockade on stop task performance in rats. Psychopharmacology 205:273–283. 10.1007/s00213-009-1537-0 - DOI - PMC - PubMed
    1. Bedard AC, Ickowicz A, Logan GD, Hogg-Johnson S, Schachar R, Tannock R (2003) Selective inhibition in children with attention-deficit hyperactivity disorder off and on stimulant medication. J Abnorm Child Psychol 31:315–327. - PubMed
    1. Bellgrove MA, Chambers CD, Vance A, Hall N, Karamitsios M, Bradshaw JL (2006) Lateralized deficit of response inhibition in early-onset schizophrenia. Psychol Med 36:495–505. 10.1017/S0033291705006409 - DOI - PubMed
    1. Boecker M, Gauggel S, Drueke B (2013) Stop or stop-change - Does it make any difference for the inhibition process? Int. J. Psychophysiol 87:234–243. 10.1016/j.ijpsycho.2012.09.009 - DOI - PubMed

Publication types

LinkOut - more resources