. 2018 Jul;136(1):19-40.
doi: 10.1007/s00401-018-1846-7. Epub 2018 Apr 23.

Diffusible, highly bioactive oligomers represent a critical minority of soluble Aβ in Alzheimer's disease brain

Affiliations

Diffusible, highly bioactive oligomers represent a critical minority of soluble Aβ in Alzheimer's disease brain

Wei Hong et al. Acta Neuropathol. 2018 Jul.

Abstract

Significant data suggest that soluble Aβ oligomers play an important role in Alzheimer's disease (AD), but there is great confusion over what exactly constitutes an Aβ oligomer and which oligomers are toxic. Most studies have utilized synthetic Aβ peptides, but the relevance of these test tube experiments to the conditions that prevail in AD is uncertain. A few groups have studied Aβ extracted from human brain, but they employed vigorous tissue homogenization which is likely to release insoluble Aβ that was sequestered in plaques during life. Several studies have found such extracts to possess disease-relevant activity and considerable efforts are being made to purify and better understand the forms of Aβ therein. Here, we compared the abundance of Aβ in AD extracts prepared by traditional homogenization versus using a far gentler extraction, and assessed their bioactivity via real-time imaging of iPSC-derived human neurons plus the sensitive functional assay of long-term potentiation. Surprisingly, the amount of Aβ retrieved by gentle extraction constituted only a small portion of that released by traditional homogenization, but this readily diffusible fraction retained all of the Aβ-dependent neurotoxic activity. Thus, the bulk of Aβ extractable from AD brain was innocuous, and only the small portion that was aqueously diffusible caused toxicity. This unexpected finding predicts that generic anti-oligomer therapies, including Aβ antibodies now in trials, may be bound up by the large pool of inactive oligomers, whereas agents that specifically target the small pool of diffusible, bioactive Aβ would be more useful. Furthermore, our results indicate that efforts to purify and target toxic Aβ must employ assays of disease-relevant activity. The approaches described here should enable these efforts, and may assist the study of other disease-associated aggregation-prone proteins.

Keywords: Amyloid β-protein; Automated live-cell imaging; Long-term potentiation; Neuritic dystrophy; Soluble aggregates; iPSC-derived human neurons.


Figures

Fig. 1
Fig. 1. Methods to extract water-soluble Aβ from human brain tissue.
Cortical gray matter tissue (~2 g) was cut into small chunks using a McIlwain tissue chopper (set at 0.5 mm). The diced tissue was mixed and divided into halves. One portion was homogenized in 5 vol. of aCSF-B with 25 strokes of a Teflon-glass Dounce homogenizer. The homogenate was then centrifuged at 200, 000 g and 4°C for 110 minutes. The upper 80% of the supernatant was removed and designated as H extract. The other portion of tissue was incubated in 5 vol. of aCSF-B at 4°C for 30 minutes with gentle side-to-side mixing. To separate tissue from the aCSF-B into which biomolecules had diffused, and to minimize mechanical disruption of tissue, the suspension was centrifuged at low speed (2,000 g and 4°C for 10 minutes). The upper 90% of the supernatant was removed and this material centrifuged as for H extract. The upper 90% of this second supernatant, designated as S extract, was removed. H2 extracts were prepared using the pellets generated when preparing S extracts. The 2,000 g and 200,000 g pellets were pooled and Dounce homogenized in 5 volumes of ice-cold aCSF-B, centrifuged at 200,000 g for 110 minutes and 4°C. The upper 80% of supernatant was removed and designated as H2 extract.
Fig. 2
Fig. 2. Similar amounts of water-soluble proteins are detected in S extracts and H extracts while lower levels of soluble protein are detected in H2 extracts.
Extracts from a total of 10 brains (9 from patients with AD, and 1 from a control free of AD) were prepared as outlined in Fig. 1 and protein content measured using a BCA assay (a). H extracts are indicated by red colored bars and red lettering; S extracts are in green and H2 extracts are in orange. H and S extracts from the same brains contain similar levels of total protein, while H2 extracts contain lower levels. Western blotting of equal volumes of brain extracts revealed similar levels of sAPP (b) and BDNF (c) in H and S extracts from the same brains, but much lower in H2 extracts. The relative intensity of protein bands was determined using LiCOR software and these values were used to estimate the percentage of sAPP and BDNF in S or H2 relative to H, i.e. the S/H x 100 or H2/H × 100 (d). All values are based on duplicated measurements from the same Western blot and are representative of at least 2 independent experiments. Black asterisks indicate samples used in subsequent bioactivity studies. Full-length blots are shown in Supplementary Fig. 3.
Fig. 3
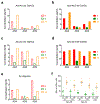
Fig. 3. The levels of different forms of Aβ are significant lower in S extracts than H or H2 extracts.
Extracts of the same 10 brains shown in Fig. 2 were analyzed for 5 distinct forms of Aβ using 3 different MSD-based immunoassays. Only results for the brain extracts used in subsequent bioactivity studies are shown, but the data for all the 10 brains are listed in Supplementary Tables 1–3. The Aβx-40 and Aβx-42 assays preferentially detect Aβ monomers ending at Val40 (a) and Ile 42 (c), respectively. Unmanipulated H, S and H2 extracts are shown in open red bars, open green bars and open orange bars, respectively. Incubation of samples with GuHCl dissociates soluble Aβ aggregates allowing increased detection of monomer by the Aβx-40 (b) and Aβx-42 (d) assays. H, S and H2 extracts pre-incubated with GuHCl are shown in filled red bars, filled green bars and filled orange bars, respectively. The oligomer assay preferentially detects soluble aggregates of various Aβ sequences and measured higher levels of soluble aggregates in H extracts (open red bars) and H2 extracts (open orange bars) than S extracts (open green bars) (e). Individual bars are the average ± SD of each sample analyzed in triplicate. When error bars are not visible, they are smaller than the size of the symbol. For all 10 brains, the percentage of Aβ in S or H2 extracts relative to H extracts is shown as S/H x 100 or H2/H × 100 (f). G− and G+ denote samples treated without and with GuHCl.
Fig. 4
Fig. 4. H, S and H2 extracts contain SDS-stable ~4 and ~7 kDa Aβ, but the levels are much lower in S extracts than H or H2 extracts.
Equal volumes of the same extracts analyzed in Figs. 2 and 3 were used for immunoprecipitation/Western blotting (IP/WB). Only results for AD4, AD9 and C1 are shown here, but all IP/WBs for the other brains are shown in Supplementary Fig. 5 (a-c). Samples were IP’d with either anti-Aβ antiserum, AW7, or pre-immune serum (PI) and WB was performed using the anti-Aβ40 and anti-Aβ42 antibodies, 2G3 and 21F12. Five ng of synthetic Aβ1–42 was loaded on each gel to allow comparison between gels. AD brain numbers, the types of extract used (H, red; S, green; H2, orange) and whether PI or AW7 antiserum was used for IP is indicated below each lane. Molecular weight markers are shown on the left. M (single arrow) denotes Aβ monomer and double arrow refers to the SDS-stable ~7 kDa Aβ species. Non-specific bands detected when PI was used are indicated by a solid black line. From the results shown here and in Supplementary Fig. 5, the relative amount of both ~4 and 7 kDa Aβ estimated using LiCOR software in S extracts was always less than 40% of that detected in the corresponding H extracts, whereas the relative amount of ~4 and 7 kDa Aβ was always greater than 50% in H2 extracts (d).
Fig. 5
Fig. 5. S extracts contain relatively higher levels of low molecular weight Aβ than H extracts.
Extracts from brains AD9 (a), AD8 (b) and AD4 (c) were fractionated using a Superdex 200 size exclusion column eluted with 50 mM ammonium bicarbonate, pH 8.5. Fractions were lyophilized, denatured with GuHCl and analyzed using the MSD-based x-42 assay. Values are normalized based on the total amount of Aβx-42 detected over an entire 24 fraction chromatogram, i.e. fractions −2 to 21. H extracts are shown with red symbols and lines, and S extracts are in green. S extracts contain relatively higher levels of low molecular weight Aβ than H extracts, and H extracts contain relatively higher levels of high molecular weight Aβ than S extracts. Elution of globular standards is indicated by downward pointing arrows labeled 17, 44, 158, and 670 (in kDa). Fraction 0 indicates the peak fraction in which Blue dextran eluted.
Fig. 6
Fig. 6. S and H extracts produce comparable neuritotoxicity, while H2 extracts exert no toxicity.
Live-cell imaging was used to monitor the effect of AD brain extracts on iPSC-derived neurons (iNs). On post-induction day 21, iNs were treated with medium alone (Control, black) or AD extract (AD9-H, red; AD9-S, green) and cells imaged for 84 hours (a). Phase contrast images (top panel) at 0 and 84 hours were analyzed using the IncuCyte NeuroTrack algorithm to identify neurites (middle panel). Identified neurites (pink) are shown superimposed on the phase contrast image (bottom panel). Scale bars are 100 μm. Each well of iNs was imaged for 6 hours prior to addition of sample and NeuroTrack-identified neurite length used to normalize neurite length measured at each interval after addition of sample. H, S and H2 extracts were tested for their effects on iNs at 1:4 dilution. The values shown in graphs are the average of triplicate wells for each treatment ± SD. Time course plots (b) show that H extract (red) and S extract (green) cause neuritotoxicity when compared to control (black), while H2 extract (orange) does not show any toxicity. (c-e) Histogram plots of normalized neurite length (mean values ± SD) are derived from the last 6 hours of the traces shown in b (AD9) and in Supplementary Fig. 7a and b (AD8 and AD4). The results shown are representative of three independent experiments. Treatments were examined by one-way ANOVA and significant differences are denoted as *** p<0.001; n.s. indicates not significant.
Fig. 7
Fig. 7. S extracts contain less Aβ than H extracts yet more potently induce neuritotoxicity than H extracts diluted to match the Aβ content of S extracts.
H and S extracts, as well as H-ID, S-ID and D samples, were tested for their effects on iNs (a, b, d, e, g and h). H-ID and S-ID denote H extract and S extract from which Aβ was immunodepleted using AW7. All samples were tested at 1:4 dilution. D denotes H extracts that were diluted to match the Aβx-42 content in corresponding S extracts. The values shown in graphs are the average of triplicate wells for each treatment ± SD. (b, e and h) Histogram plots of normalized neurite length are derived from the last 6 hours of the traces shown in a, d and g, and are presented as mean values ± SD. The results shown are representative of at least three independent experiments. Treatments were examined by one-way ANOVA and significant differences are denoted as ** p<0.01 and *** p<0.001. The Aβ content in extracts from AD9, AD8 and AD4 were determined by Aβx-42 immnoassay plus pre-treatment with 5 M GuHCl (c, f and i). Individual bars are the average ± SD of each sample analyzed in triplicate. Data are representative of at least 2 experiments.
Fig. 8
Fig. 8. S extracts contain less Aβ than H extracts yet more potently block LTP than H extracts diluted to match the Aβ content of S extracts.
H and S extracts, as well as immunodepleted and diluted H extracts, were tested for their effects on LTP (a, b, d, e, g and h). ID denotes H extract from which Aβ was immunodepleted using AW7. D denotes H extracts that was diluted to match the Aβx-42 content in S extract. Time course plots (a, d and g) show that H extracts (red) and S extracts (green) block LTP, when compared to aCSF control (black). ID samples (pink) do not block LTP. Similarly, D samples (blue) either do not inhibit LTP (AD9 and AD4) or cause only a modest decrement of LTP (AD8). The horizontal bar represents the time during which the vehicle or extract was present in the recording solution. ↑TBS indicates theta burst stimulation used to induce LTP. The slopes of fEPSPs are shown as mean ± SD relative to baseline. Histogram plots (b, e and h) show the average potentiation for the last 10 min of the traces in a, d and g. The effect of treatments relative to aCSF vehicle were examined by one-way ANOVA and significant differences are denoted as * p<0.05, ** p<0.01 and *** p<0.001. The Aβ content in extracts from AD9, AD8 and AD4 were determined by Aβx-42 immnoassay ± pre-treatment with 5 M GuHCl (c, f and i). Individual bars are the average ± SD of each sample analyzed in triplicate. Aβ measurements are representative of at least 2 experiments.

References

    1. Barry AE, Klyubin I, Mc Donald JM, Mably AJ, Farrell MA, Scott M, Walsh DM, Rowan MJ (2011) Alzheimer’s disease brain-derived amyloid-beta-mediated inhibition of LTP in vivo is prevented by immunotargeting cellular prion protein. J Neurosci 31: 7259–7263 - PMC - PubMed
    1. Benilova I, Karran E, De Strooper B (2012) The toxic Abeta oligomer and Alzheimer’s disease: an emperor in need of clothes. Nat Neurosci 15: 349–357 - PubMed
    1. Borlikova GG, Trejo M, Mably AJ, Mc Donald JM, Sala Frigerio C, Regan CM, Murphy KJ, Masliah E, Walsh DM (2013) Alzheimer brain-derived amyloid beta-protein impairs synaptic remodeling and memory consolidation. Neurobiol Aging 34: 1315–1327 - PMC - PubMed
    1. Brody DL, Jiang H, Wildburger N, Esparza TJ (2017) Non-canonical soluble amyloid-beta aggregates and plaque buffering: controversies and future directions for target discovery in Alzheimer’s disease. Alzheimers Res Ther 9: 62. - PMC - PubMed
    1. De Felice FG, Wu D, Lambert MP, Fernandez SJ, Velasco PT, Lacor PN, Bigio EH, Jerecic J, Acton PJ, Shughrue PJ, Chen-Dodson E, Kinney GG, Klein WL (2008) Alzheimer’s disease-type neuronal tau hyperphosphorylation induced by A beta oligomers. Neurobiol Aging 29: 1334–1347 - PMC - PubMed

Publication types

MeSH terms

Substances