Review
. 2019 Jan;11(1):e1529.
doi: 10.1002/wnan.1529. Epub 2018 Apr 24.

Developments in label-free microfluidic methods for single-cell analysis and sorting

Affiliations
Review

Developments in label-free microfluidic methods for single-cell analysis and sorting

Thomas R Carey et al. Wiley Interdiscip Rev Nanomed Nanobiotechnol. 2019 Jan.

Abstract

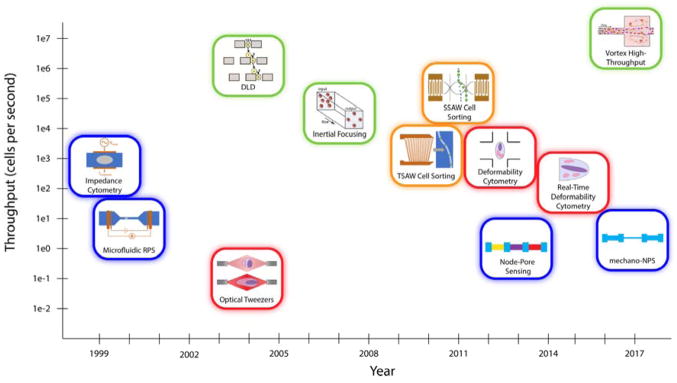
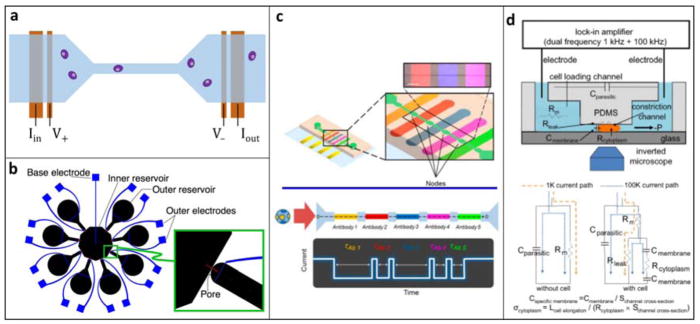
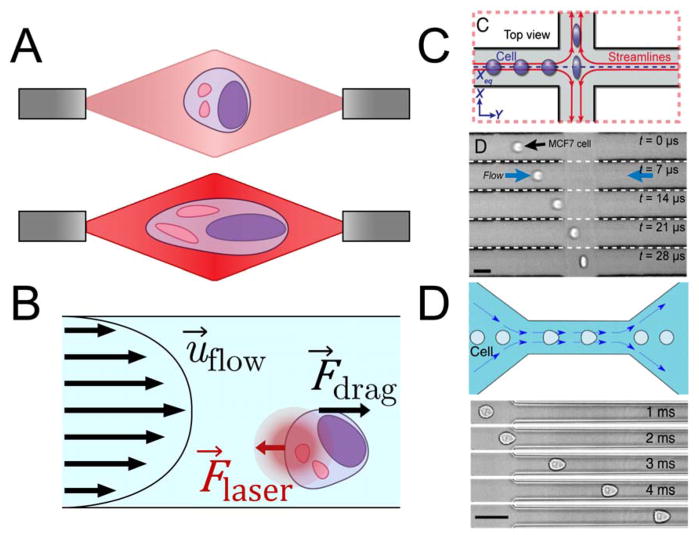
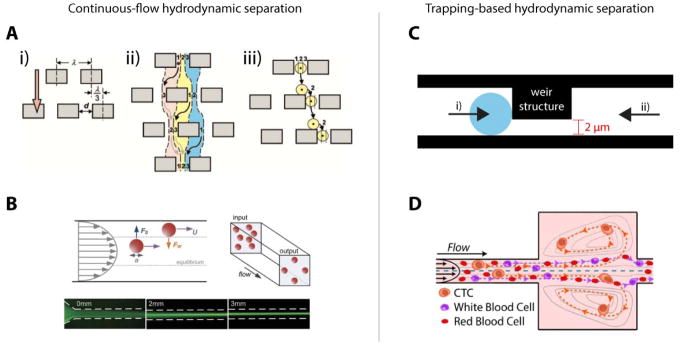
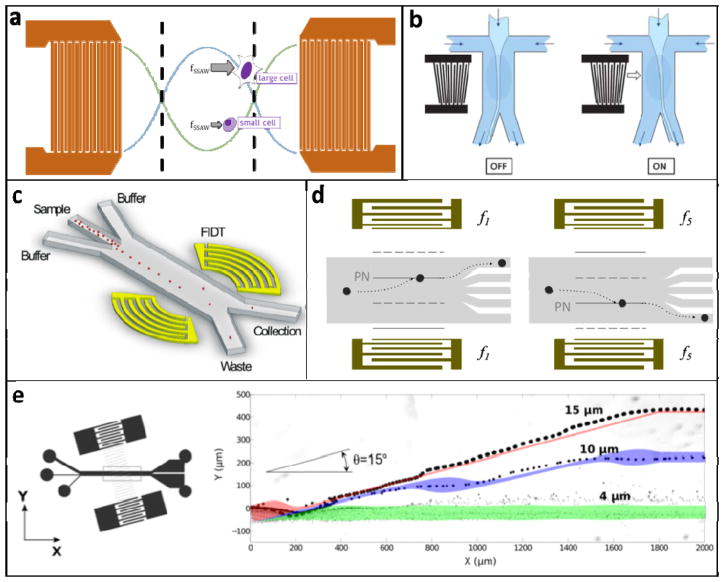
Advancements in microfluidic technologies have led to the development of many new tools for both the characterization and sorting of single cells without the need for exogenous labels. Label-free microfluidics reduce the preparation time, reagents needed, and cost of conventional methods based on fluorescent or magnetic labels. Furthermore, these devices enable analysis of cell properties such as mechanical phenotype and dielectric parameters that cannot be characterized with traditional labels. Some of the most promising technologies for current and future development toward label-free, single-cell analysis and sorting include electronic sensors such as Coulter counters and electrical impedance cytometry; deformation analysis using optical traps and deformation cytometry; hydrodynamic sorting such as deterministic lateral displacement, inertial focusing, and microvortex trapping; and acoustic sorting using traveling or standing surface acoustic waves. These label-free microfluidic methods have been used to screen, sort, and analyze cells for a wide range of biomedical and clinical applications, including cell cycle monitoring, rapid complete blood counts, cancer diagnosis, metastatic progression monitoring, HIV and parasite detection, circulating tumor cell isolation, and point-of-care diagnostics. Because of the versatility of label-free methods for characterization and sorting, the low-cost nature of microfluidics, and the rapid prototyping capabilities of modern microfabrication, we expect this class of technology to continue to be an area of high research interest going forward. New developments in this field will contribute to the ongoing paradigm shift in cell analysis and sorting technologies toward label-free microfluidic devices, enabling new capabilities in biomedical research tools as well as clinical diagnostics. This article is categorized under: Diagnostic Tools > Biosensing Diagnostic Tools > Diagnostic Nanodevices.

Keywords: label-free; microfluidics; single-cell.


Figures

Figure 1
Figure 1
Electrical (blue), optical (red), hydrodynamic (green), and acoustic (orange) methods of sorting cells. While hydrodynamic methods tend to offer higher throughputs, other methods typically provide more granular information about cells. It should be noted that the throughput values depicted are approximate and correspond to the first demonstration of that technology. Thus, current implementations of older technologies usually have higher throughput values than those shown here.
Figure 2
Figure 2
A. Typical implementation of microfluidic RPS. A fluidic channel (blue), typically a PDMS mold, is bonded to a substrate containing microfabricated electrodes (orange). A voltage is applied across the channel while the current is monitored. A cell’s presence in the channel causes a current drop. B. Example of a multichannel RPS design using eight detection channels to improve throughput by multiplexing. Reprinted with permission from (Saleh, 2003) C. NPS, a variation of RPS, is used to measure five surface markers in one channel. Each section is functionalized with an antibody, and cells expressing the corresponding surface marker traverses that section more slowly. Adapted with permission from (Balakrishnan et al., 2015). Further permissions related to the material excerpted should be directed to the ACS. D. Schematic and electrical model of a constriction channel design for microfluidic EIC. Cells flow through the constriction channel while impedance and elongation are measured continuously. Two-frequency data at 1 kHz and 100 kHz allow calculation of specific membrane capacitance and cytoplasm conductivity. Adapted with permission from (Y. Zhao et al., 2014)
Figure 3
Figure 3
A. Schematic of a cell deformed in a dual-beam optical trap. At low laser power (top), the cell is simply trapped. At higher laser power (bottom), photons colliding with the cell provide enough momentum to physically stretch the cell. B. Free-body diagram describing optofluidic rotation. A dual-beam optical trap immobilizes a cell at a position offset from the center of the microchannel. The velocity profile applies a shear stress to one side of the cell, causing the cell to rotate around the axis of the laser beams. C. Schematic of a deformability cytometry stretching chamber (top) and time lapse of a cell in such a chamber (bottom) (Darling & Carlo, 2015). Cells enter an intersection of two high-speed flows from the left and right, and are deformed and imaged before exiting through the outlets at the top and bottom. Adapted with permission from (Darling & Carlo, 2015) D. Schematic of a real-time deformability cytometry constriction channel (top) and time lapse of a cell in such a channel (bottom) (Otto et al., 2015). Cells enter the narrow channel at high speed, where the shear rate is high enough to deform the cell into a bullet-like shape. Adapted with permission from (Otto et al., 2015)
Figure 4
Figure 4
A. Mechanism of deterministic lateral displacement. Streamlines 1, 2, and 3 do not mix. If a cell or particle is large enough to be located primarily in streamline 3, as shown in the diagram, it will flow to the right of the pillars. Reprinted with permission from (Huang, Cox, Austin, & Sturm, 2004) . B. Free-body diagram of forces experienced by cells or particles during inertial focusing that pushes them toward equilibrium positions in a channel based on size. Reprinted with permission from (Zhou & Papautsky, 2013). C. Weir-type filter used to capture cells below a size/deformability threshold; once cells are trapped by centrifugal forces and negative pressure (i), back-flow is used to recover the cells from the device (ii). Adapted with permission from (Yeo et al., 2016). D. Trace of path of cells in Vortex device. At a constant, high flow rate, larger cells are trapped in large sections of the channel in microvortices, while smaller cells pass through to the outlet. When the flow rate is reduced, larger cells exit the vortices and are recovered at the outlet. Reprinted with permission from (Che et al., 2016).
Figure 5
Figure 5
A. Schematic of SSAW forces exerted on cells in the region between IDTs. All cells move toward the pressure nodes, but large cells experience a larger force and move with a faster velocity. B. Switchable TSAW system used as an actuator for cell sorting. The light blue stream, containing cells, flows into the left outlet channel unless the TSAW is turned on by applying an AC signal to the IDT electrodes. Reprinted with permission from (Franke, Braunmüller, Schmid, Wixforth, & Weitz, 2010) C. FIDT system for high-throughput cell sorting. The concentric design of the IDTs focuses the SSAW to a small region, allowing it to specifically actuate individual cells. This device sorted HeLa cells at ~7,000 Hz. Reprinted with permission from (Ren et al., 2015) D. Tunable SSAW device that employs chirped IDTs. Cells can be directed to one of five different outlets depending on the frequency of the signal applied to the IDTs. Adapted with permission from (Ding et al., 2012) E. The taSSAW device positions the fluidic channel at a small angle relative to the IDT fingers, thus positioning the pressure nodes at an angle relative to fluid flow. Whereas a traditional SSAW sorter can only achieve separation distances up to 1/4 of the acoustic wavelength, the taSSAW design can achieve greater separation and accordingly shows improved throughput and performance. The particle trajectories demonstrate that the 15μm beads were separated from the 4μm beads by >300μm (the acoustic wavelength was 300μm). Adapted with permission from (Ding et al., 2014)

References

    1. ACEA Biosciences. xCELLigence RTCA systems. 2018.
    1. Amphasys. Ampha Z32 Impedance Flow Cytometry. 2018.
    1. Au S, Edd J, Stoddard A, Wong K, Fachin F, Maheswaran S, … Toner M. Microfluidic Isolation of Circulating Tumor Cell Clusters by Size and Asymmetry. Scientific Reports. 2017;7(1):2433. doi: 10.1038/s41598-017-01150-3. - DOI - PMC - PubMed
    1. Balakrishnan KR, Anwar G, Chapman MR, Nguyen T, Kesavaraju A, Sohn LL. Node-pore sensing: a robust, high-dynamic range method for detecting biological species. Lab on a chip. 2013;13(7):1302–7. doi: 10.1039/C3LC41286E. - DOI - PubMed
    1. Balakrishnan KR, Whang JC, Hwang R, Hack JH, Godley LA, Sohn LL. Node-pore sensing enables label-free surface-marker profiling of single cells. Analytical chemistry. 2015;87(5):2988–95. doi: 10.1021/ac504613b. - DOI - PMC - PubMed

Publication types