EMUDRA: Ensemble of Multiple Drug Repositioning Approaches to improve prediction accuracy
- PMID: 29688306
- PMCID: PMC6138000
- DOI: 10.1093/bioinformatics/bty325
EMUDRA: Ensemble of Multiple Drug Repositioning Approaches to improve prediction accuracy
Abstract
Motivation: Availability of large-scale genomic, epigenetic and proteomic data in complex diseases makes it possible to objectively and comprehensively identify the therapeutic targets that can lead to new therapies. The Connectivity Map has been widely used to explore novel indications of existing drugs. However, the prediction accuracy of the existing methods, such as Kolmogorov-Smirnov statistic remains low. Here we present a novel high-performance drug repositioning approach that improves over the state-of-the-art methods.
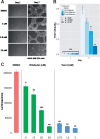
Results: We first designed an expression weighted cosine (EWCos) method to minimize the influence of the uninformative expression changes and then developed an ensemble approach termed ensemble of multiple drug repositioning approaches (EMUDRA) to integrate EWCos and three existing state-of-the-art methods. EMUDRA significantly outperformed individual drug repositioning methods when applied to simulated and independent evaluation datasets. We predicted using EMUDRA and experimentally validated an antibiotic rifabutin as an inhibitor of cell growth in triple negative breast cancer. EMUDRA can identify drugs that more effectively target disease gene signatures and will thus be a useful tool for identifying novel therapies for complex diseases and predicting new indications for existing drugs.
Availability and implementation: The EMUDRA R package is available at doi: 10.7303/syn11510888.
Supplementary information: Supplementary data are available at Bioinformatics online.
Figures


Similar articles
-
Computational drug repositioning using low-rank matrix approximation and randomized algorithms.Bioinformatics. 2018 Jun 1;34(11):1904-1912. doi: 10.1093/bioinformatics/bty013. Bioinformatics. 2018. PMID: 29365057
-
Reconciling multiple connectivity scores for drug repurposing.Brief Bioinform. 2021 Nov 5;22(6):bbab161. doi: 10.1093/bib/bbab161. Brief Bioinform. 2021. PMID: 34013329 Free PMC article.
-
springD2A: capturing uncertainty in disease-drug association prediction with model integration.Bioinformatics. 2022 Feb 7;38(5):1353-1360. doi: 10.1093/bioinformatics/btab820. Bioinformatics. 2022. PMID: 34864881
-
Biomedical data and computational models for drug repositioning: a comprehensive review.Brief Bioinform. 2021 Mar 22;22(2):1604-1619. doi: 10.1093/bib/bbz176. Brief Bioinform. 2021. PMID: 32043521 Review.
-
Drug-Disease Association Prediction Using Heterogeneous Networks for Computational Drug Repositioning.Biomolecules. 2022 Oct 17;12(10):1497. doi: 10.3390/biom12101497. Biomolecules. 2022. PMID: 36291706 Free PMC article. Review.
Cited by
-
Drug Repurposing Using Modularity Clustering in Drug-Drug Similarity Networks Based on Drug-Gene Interactions.Pharmaceutics. 2021 Dec 8;13(12):2117. doi: 10.3390/pharmaceutics13122117. Pharmaceutics. 2021. PMID: 34959398 Free PMC article.
-
Identification of significant gene expression changes in multiple perturbation experiments using knockoffs.Brief Bioinform. 2023 Mar 19;24(2):bbad084. doi: 10.1093/bib/bbad084. Brief Bioinform. 2023. PMID: 36892174 Free PMC article.
-
Machine and deep learning approaches for cancer drug repurposing.Semin Cancer Biol. 2021 Jan;68:132-142. doi: 10.1016/j.semcancer.2019.12.011. Epub 2020 Jan 3. Semin Cancer Biol. 2021. PMID: 31904426 Free PMC article. Review.
-
Disentangling the Molecular Pathways of Parkinson's Disease using Multiscale Network Modeling.Trends Neurosci. 2021 Mar;44(3):182-188. doi: 10.1016/j.tins.2020.11.006. Trends Neurosci. 2021. PMID: 33358606 Free PMC article. Review.
-
Functional genomics pipeline identifies CRL4 inhibition for the treatment of ovarian cancer.Clin Transl Med. 2025 Feb;15(2):e70078. doi: 10.1002/ctm2.70078. Clin Transl Med. 2025. PMID: 39856363 Free PMC article.
References
-
- Benjamini Y., Hochberg Y. (1995) Controlling the false discovery rate: a practical and powerful approach to multiple testing. J. Roy. Stat. Soc. B Met., 57, 289–300.
-
- Benjamini Y., Yekutieli D. (2001) The control of the false discovery rate in multiple testing under dependency. Ann. Stat., 29, 1165–1188.
Publication types
MeSH terms
Grants and funding
LinkOut - more resources
Full Text Sources
Other Literature Sources

