. 2018 Jun 1;365(12):fny108.
doi: 10.1093/femsle/fny108.

Identification of a unique transcriptional architecture for the sigS operon in Staphylococcus aureus

Affiliations

Identification of a unique transcriptional architecture for the sigS operon in Staphylococcus aureus

Halie K Miller et al. FEMS Microbiol Lett. .

Abstract

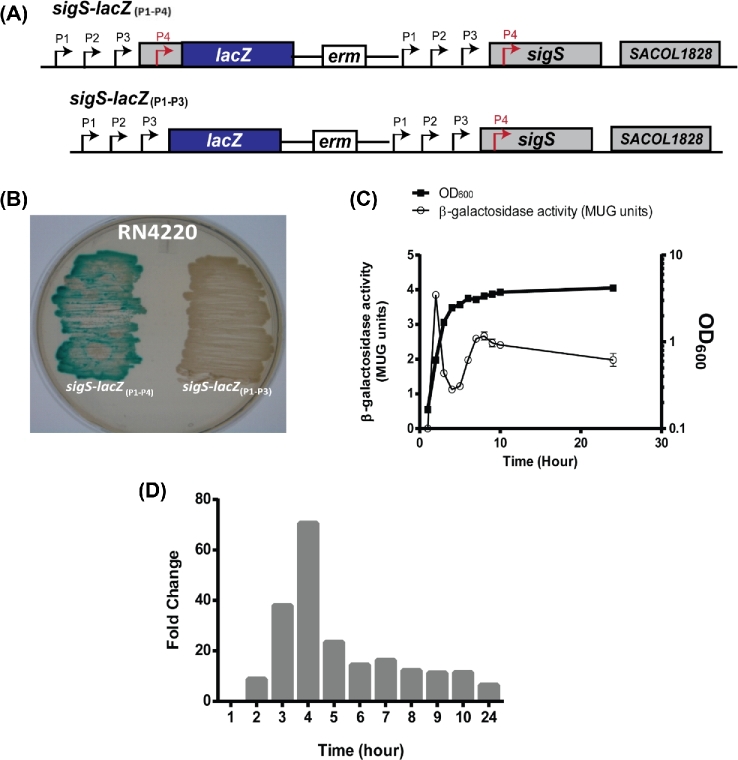
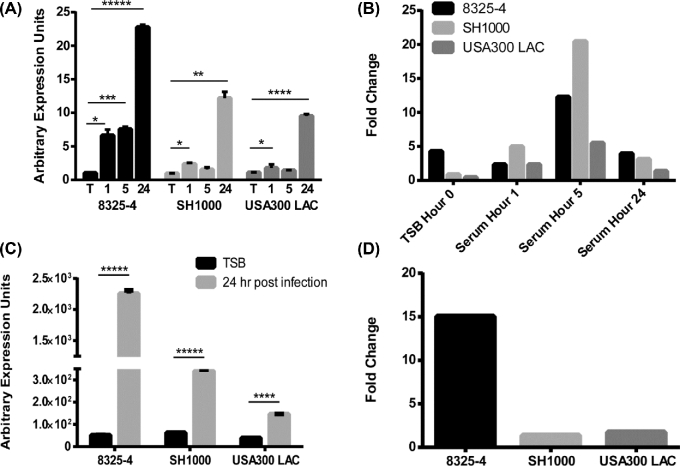
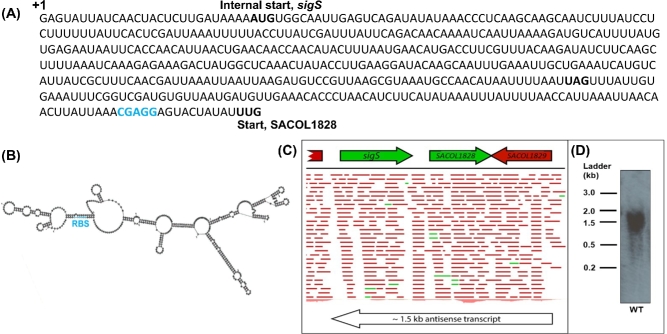
Staphylococcus aureus possess three alternative σ factors, including a lone extracytoplasmic function σ factor, σS. Our group previously identified and characterized this element, mapping three sigS promoters, demonstrating its inducibility during stress and virulence inducing conditions and demonstrating a role for this factor in disease causation. In the present study, we identify a fourth promoter of the sigS operon, termed P4, located in a unique position internal to the sigS coding region. Transcriptional profiling revealed that expression from P4 is dominant to the three upstream promoters, particularly upon exposure to chemical stressors that elicit DNA damage and disrupt cell wall stability; each of which have previously been shown to stimulate sigS expression. Importantly, expression of this fourth promoter, followed by at least one or more of the upstream promoters, is induced during growth in serum and upon phagocytosis by RAW 264.7 murine macrophage-like cells. Finally, we demonstrate that a downstream gene, SACOL1829, bears a large 3΄ UTR that spans the sigS-SACOL1828 coding region, and may serve to compete with the P4 transcript to inhibit σS production. Collectively, these findings reveal a unique operon architecture for the sigS locus that indicates the potential for novel regulatory mechanisms governing its expression.


Figures

Figure 1.
Figure 1.
Promoter mapping of sigS reveals a unique promoter internal to the coding region (A) 5΄ RACE analysis was performed on the sigS operon resulting in the identification of a transcriptional start site located 85 nucleotides 3΄ of the sigS start codon (P4), depicted in red. Analysis of the sequences upstream reveals a putative σA promoter with a consensus −10, a near consensus −35 and a truncated spacer. These findings are in addition to our previous primer extension analysis, which identified the three upstream promoters (P1–P3) (Miller et al. 2012). Binding sites for primer extension oligonucleotides sigS3 and sigS4 are indicated. (B) Primer extension reactions were carried out using oligonucleotides sigS3 and sigS4 with (+) or without (−) the addition of RNA. Primer extension products were identified for each reaction containing RNA, corresponding in size to ∼120 nt for sigS3 and ∼200 nt for sigS4, indicating that the same transcription start site for both. (C) The sigS4 primer extension product representing the complement strand was run alongside a DNA sequencing reaction performed using the same oligonucleotide. The transcription start site of the coding strand was identified as a G residue located 85 nucleotides into the sigS coding sequence.
Figure 2.
Figure 2.
Transcriptional profiling of sigS P1–P3 expression. (A) Cartoon depicting the two different fusion constructs utilized to measure activity of the upstream and internal sigS promoters (sigS-lacZ(P1P4)) or only the upstream sigS promoters (sigS-lacZ(P1P3)). (B) A plate based assay to visualize β-galactosidase production (blue coloration) from the sigS-lacZ(P1P4) and sigS-lacZ(P1P3) fusions in the RN4220 background. (C) The sigS-lacZ(P1P3) fusion in RN4220 was grown in TSB at 37°C and sampled every hour for 10 h and again at 24 h. β-Galactosidase activity (left y-axis) and OD600 (right y-axis) were measured to determine levels of expression. Assays were performed on duplicate samples and the values averaged. The results presented here are from three independent experiments that showed less than 10% variability. (D) Fold changes demonstrating expression differences during growth under standard conditions in the RN4220 background for the original sigS-lacZ(P1P4) fusion relative to the sigS-lacZ(P1P3) fusion.
Figure 3.
Figure 3.
Profiling of sigS P1–P3 expression during challenge by components of the innate immune system. (A) The sigS-lacZ(P1P3) fusion in the 8325-4, SH1000 and USA300 LAC backgrounds were assayed for β-galactosidase activity during growth in porcine serum, with measurements taken at hours 1, 5 and 24 post- exposure; as well as from the inoculum (grown in TSB; T). (B) Fold changes demonstrating expression differences during growth in serum for the original sigS-lacZ(P1P4) strains relative to the sigS-lacZ(P1P3) strains. (C) The sigS-lacZ(P1P3) fusion in the 8325-4, SH1000 and USA300 LAC backgrounds were assayed for β-galactosidase activity during intracellular growth with measurements taken prior to phagocytosis (black) and 24 h post phagocytosis (grey) by RAW 264.7 murine macrophage-like cells. Cells were infected at an MOI of 1:100 and incubations carried out at 37°C in a humidified atmosphere of 5% CO2. (D) Fold changes demonstrating expression differences post-phagocytosis for the original sigS-lacZ(P1P4) strains relative to the sigS-lacZ(P1P3) strains. The data presented are from at least three independent experiments. Error bars are shown ± SEM; *P < 0.05,**P < 0.001, ***P < 0001, ****P < 0.00001, *****P < 0.000001 using a Student t test.
Figure 4.
Figure 4.
Proposed role of the P4 generated transcript. (A) The mRNA sequence of the P4 transcript, including the transcript start site (+1), the putative internal in-frame sigS start codon (AUG), the sigS stop codon (UAG), the SACOL1828 RBS (CGAGG, in blue) and the SACOL1828 start codon (UUG). (B) Mfold analysis of the 499 nucleotide 5΄ UTR through the start codon of SACOL1828. The RBS is highlighted in blue. (C) Architecture of the sigS operon as revealed by RNAseq analysis in the USA300 wild-type strain (Weiss et al. 2014). Red reads indicate transcription from the negative strand, while green reads indicate transcription from the positive strand. As shown, the majority of reads appear to originate from the SACOL1829 locus and extend across the sigS-SACOL1828 coding region in an antisense fashion. (D) Northern blot analysis of the SACOL1829 transcript in the USA300 wild type. The transcript size of approximately 1.5 kb supports that suggested by RNAseq, spanning the entire SACOL1829-SACOL1828-sigS region, rather than the ∼450 bp of SACOL1829 alone.

Similar articles

Cited by

References

    1. Bischoff M, Dunman P, Kormanec J et al. . Microarray-based analysis of the Staphylococcus aureus B regulon. J Bacteriol 2004;186:4085–99. - PMC - PubMed
    1. Burda WN, Miller HK, Krute CN et al. . Investigating the genetic regulation of the ECF sigma factor sigmaS in Staphylococcus aureus. BMC Microbiol 2014;14:280. - PMC - PubMed
    1. Carroll RK, Robison TM, Rivera FE et al. . Identification of an intracellular M17 family leucine aminopeptidase that is required for virulence in Staphylococcus aureus. Microbes Infect. 2012;14:989–99. - PMC - PubMed
    1. Carroll RK, Weiss A, Broach WH et al. . Genome-wide annotation, identification, and global transcriptomic analysis of regulatory or small RNA gene expression in Staphylococcus aureus. mBio 2016;7:e01990–15. - PMC - PubMed
    1. Chen CJ, Unger C, Hoffmann W et al. . Characterization and comparison of 2 distinct epidemic community-associated methicillin-resistant Staphylococcus aureus clones of ST59 lineage. PLoS One 2013;8:989–99. - PMC - PubMed

Publication types

LinkOut - more resources