

doi: 10.1093/database/bay027.
Maser: one-stop platform for NGS big data from analysis to visualization
Affiliations
- PMID: 29688385
- PMCID: PMC5905357
- DOI: 10.1093/database/bay027
Item in Clipboard
Maser: one-stop platform for NGS big data from analysis to visualization
Database (Oxford).
.
Abstract
http://cell-innovation.nig.ac.jp/maser/.
Figures
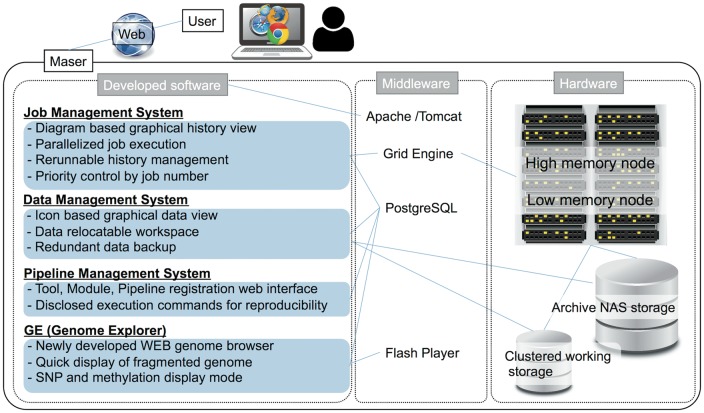
System configuration of Maser.
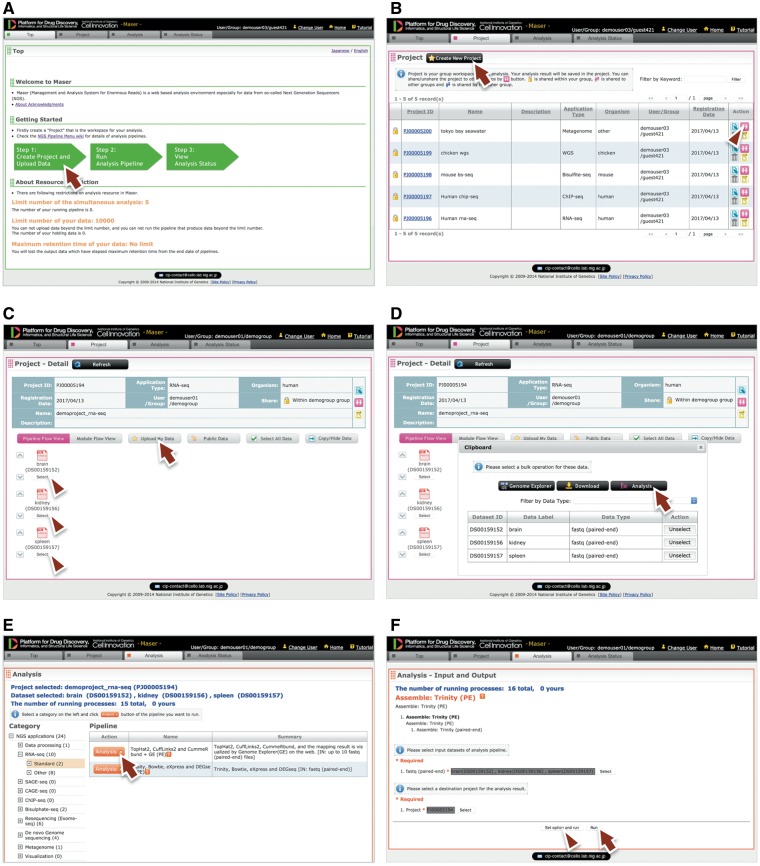
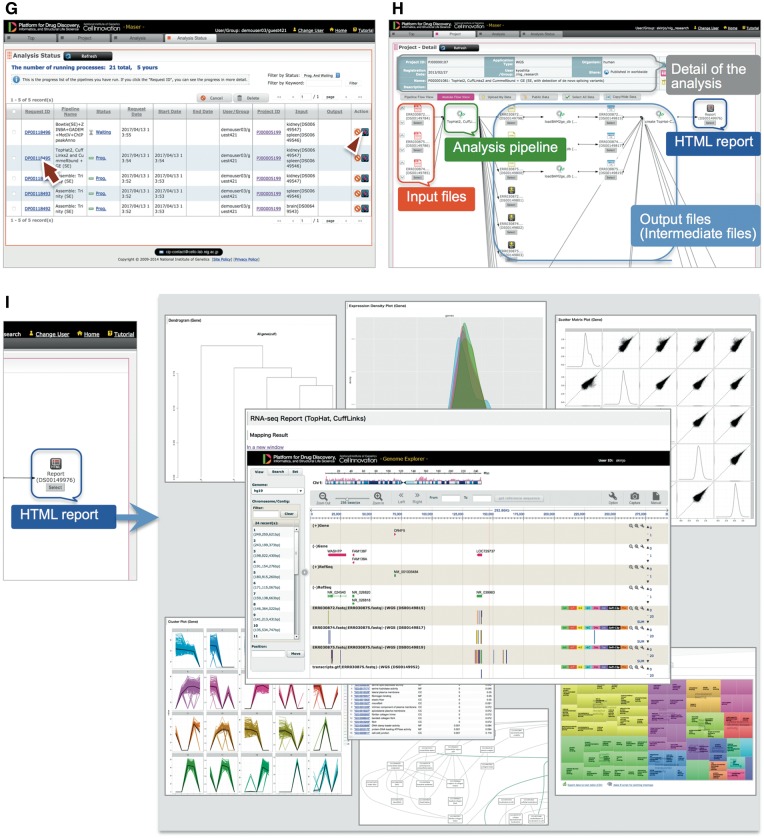
Maser web interface. (A) Maser front page. Three green block arrows indicate the main steps to start the analysis. Step 1: Create project and upload data (red arrow), Step 2: Run analysis pipeline, Step 3: View analysis status. (B) Project page. Arrow indicates button to create new project and arrowhead indicates icon to share the project with collaborators. (C) Project Room view. Upload data files (arrow) and select files used for the analysis (arrowheads). (D) By clicking “Analysis” in the new window (arrow), the Maser screen automatically moves onto a list of analysis pipeline (E). (F) Option setting screen. There are two buttons, ‘Run’ to start the analysis (arrow) and “Set option and run” (arrowhead) to change the option setting. (G) Analysis status page. The Request ID (arrow) is assigned to each analysis. Arrowhead indicates ‘Reanalysis’ icon to repeat the analysis. Clicking the Request ID shows details of the analysis (H). (I) A representative example of RNA-seq pipeline analysis results, ‘TopHat2, CuffLinks2 and CummeRbund + GE’. This pipeline produces an html report that contains output files from all the embedded tools (e.g. TopHat, Cufflinks, CummeRbund) and visualized mapping results on GE (see Figure 3).
Maser web interface. (A) Maser front page. Three green block arrows indicate the main steps to start the analysis. Step 1: Create project and upload data (red arrow), Step 2: Run analysis pipeline, Step 3: View analysis status. (B) Project page. Arrow indicates button to create new project and arrowhead indicates icon to share the project with collaborators. (C) Project Room view. Upload data files (arrow) and select files used for the analysis (arrowheads). (D) By clicking “Analysis” in the new window (arrow), the Maser screen automatically moves onto a list of analysis pipeline (E). (F) Option setting screen. There are two buttons, ‘Run’ to start the analysis (arrow) and “Set option and run” (arrowhead) to change the option setting. (G) Analysis status page. The Request ID (arrow) is assigned to each analysis. Arrowhead indicates ‘Reanalysis’ icon to repeat the analysis. Clicking the Request ID shows details of the analysis (H). (I) A representative example of RNA-seq pipeline analysis results, ‘TopHat2, CuffLinks2 and CummeRbund + GE’. This pipeline produces an html report that contains output files from all the embedded tools (e.g. TopHat, Cufflinks, CummeRbund) and visualized mapping results on GE (see Figure 3).
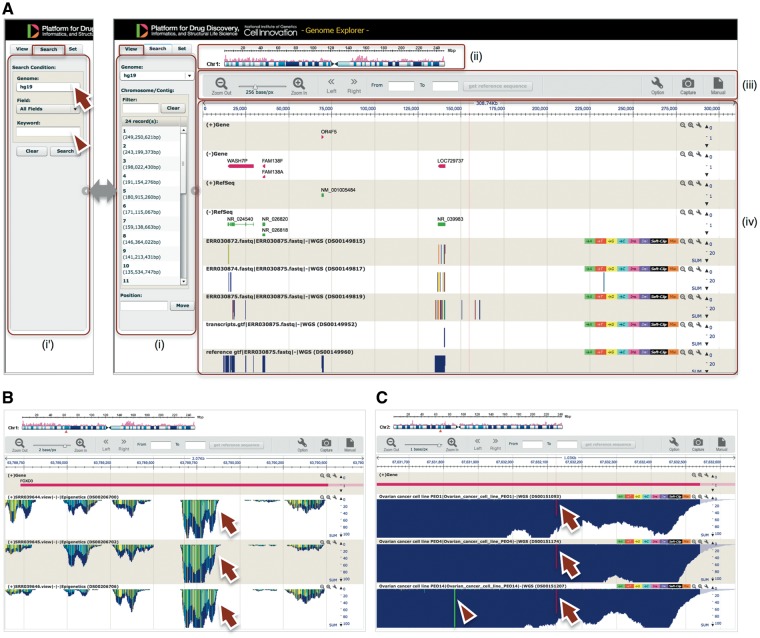
GE implemented on Maser. (A) GE display is composed of four components: (i) Genome box, (ii) Chromosome bar, (iii) Control menu bar and (iv) Mapping view. (i) The left Genome box shows a list of chromosomes or scaffolds of reference genomes the user has selected. The user can specify the chromosome and position to be displayed or search a specific gene by keywords (Entrez gene ID, Refseq ID, gene name and symbol) in the Search tab (i'). (ii) The top Chromosome bar shows the location in the chromosome displayed. (iii) The second top Control menu bar has multiple functions. There are buttons to zoom in and out of the chromosome, shift left or right on the chromosome region and retrieve any sequences in the range specified in the ‘From’ and ‘To’ boxes. The ‘Option’ button is used for selecting datasets displayed on the mapping view and changing plot format. (iv) The Mapping view is composed of multiple tracks that show the position of Entrez gene, Refseq transcripts, and mapping results. (B) Magnified mapping view with the detected methylation sites output from the BS-seq pipeline. The methylation patterns of all CpG, CHH and CHG regions throughout the genome are shown in cyan, green, and yellow, respectively (arrows). (C) Magnified mapping view with the detected SNVs and indels output from the Resequencing (Exome-seq) pipeline. The arrows and arrowhead indicate T variant (red vertical bar) and A variant (green vertical bar), respectively.
References
-
- Wetterstrand K.A. (2017) DNA Sequencing Costs: Data from the NHGRI Genome Sequencing Program (GSP). www.genome.gov/sequencingcostsdata (1 March 2017, date last accessed).
-
- Andrews S. (2010) FastQC: A quality control tool for high throughput sequence data. http://www.bioinformatics.babraham.ac.uk/projects/fastqc/ (May 2014, date last accessed).
Publication types
MeSH terms
LinkOut - more resources
Full Text Sources
Other Literature Sources
