. 2018 Jun 1;141(6):1871-1883.
doi: 10.1093/brain/awy093.

Brain properties predict proximity to symptom onset in sporadic Alzheimer's disease

Affiliations

Brain properties predict proximity to symptom onset in sporadic Alzheimer's disease

Jacob W Vogel et al. Brain. .

Abstract

See Tijms and Visser (doi:10.1093/brain/awy113) for a scientific commentary on this article.Alzheimer's disease is preceded by a lengthy 'preclinical' stage spanning many years, during which subtle brain changes occur in the absence of overt cognitive symptoms. Predicting when the onset of disease symptoms will occur is an unsolved challenge in individuals with sporadic Alzheimer's disease. In individuals with autosomal dominant genetic Alzheimer's disease, the age of symptom onset is similar across generations, allowing the prediction of individual onset times with some accuracy. We extend this concept to persons with a parental history of sporadic Alzheimer's disease to test whether an individual's symptom onset age can be informed by the onset age of their affected parent, and whether this estimated onset age can be predicted using only MRI. Structural and functional MRIs were acquired from 255 ageing cognitively healthy subjects with a parental history of sporadic Alzheimer's disease from the PREVENT-AD cohort. Years to estimated symptom onset was calculated as participant age minus age of parental symptom onset. Grey matter volume was extracted from T1-weighted images and whole-brain resting state functional connectivity was evaluated using degree count. Both modalities were summarized using a 444-region cortical-subcortical atlas. The entire sample was divided into training (n = 138) and testing (n = 68) sets. Within the training set, individuals closer to or beyond their parent's symptom onset demonstrated reduced grey matter volume and altered functional connectivity, specifically in regions known to be vulnerable in Alzheimer's disease. Machine learning was used to identify a weighted set of imaging features trained to predict years to estimated symptom onset. This feature set alone significantly predicted years to estimated symptom onset in the unseen testing data. This model, using only neuroimaging features, significantly outperformed a similar model instead trained with cognitive, genetic, imaging and demographic features used in a traditional clinical setting. We next tested if these brain properties could be generalized to predict time to clinical progression in a subgroup of 26 individuals from the Alzheimer's Disease Neuroimaging Initiative, who eventually converted either to mild cognitive impairment or to Alzheimer's dementia. The feature set trained on years to estimated symptom onset in the PREVENT-AD predicted variance in time to clinical conversion in this separate longitudinal dataset. Adjusting for participant age did not impact any of the results. These findings demonstrate that years to estimated symptom onset or similar measures can be predicted from brain features and may help estimate presymptomatic disease progression in at-risk individuals.


Figures
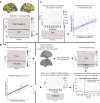
Figure 1
Figure 1
Nested cross-validation pipeline for Lasso Regression-based model optimization. (A) Grey matter volume and whole-brain resting state functional connectivity features were summarized using a 443-region cortical atlas (plus total intracranial volume), for a total of 887 brain features. One-third of the sample (n = 68) was removed from the pipeline and reserved as unseen testing data (presented in C). The other two-thirds (n = 138) was entered into the nested cross-validation loop presented in B. (B) The training set (only) underwent 3-fold cross-validation. For each fold, two-thirds of the sample was extracted and imaging features were filtered such that only those significantly related to years to estimated symptom onset (P < 0.05 uncorrected) were retained. These features were entered into a Lasso Regression, which itself used 10-fold cross-validation to define the optimal penalization. The betas (weights) from the Lasso Regression model were applied to the left-out third of the training set to transform them into a single vector of predicted years to estimated symptom onset values. The predicted vectors for each of the n = 3 folds were appended together so predicted values were present for all subjects within the training set. Validation accuracy is reported as the r2 of the relationship between predicted years to estimated symptom onset and observed years to estimated symptom onset. (C) Finally, the Lasso Regression weights for all three folds were averaged, and these weights were applied to the unseen test data to generate predicted years to estimated symptom onset in the test dataset. Final accuracy is reported as the r2 of the relationship between predicted years to estimated symptom onset and observed years to estimated symptom onset in the test dataset. spEYO = years to estimated symptom onset (sporadic Alzheimer's disease).
Figure 2
Figure 2
Relationships between brain imaging features and years to estimated symptom onset. Relationships between years to estimated symptom onset and resting state functional connectivity (left) and grey matter volume (right) features, after adjusting for age, sex and mean frame displacement (connectivity) or total intracranial volume (volume) in the PREVENT-AD training sample. Positive relationships are shown in warm colours, while negative relationships are shown in cool colours. Only significant relationships are visualized (P < 0.05 uncorrected).
Figure 3
Figure 3
Neuroimaging features predict years to estimated symptom onset and time to clinical conversion. (A) Neuroimaging features included in the final predictive model developed in the PREVENT-AD validation group (i.e. brain region with non-zero beta values) are projected onto cortical surfaces. Whole brain resting state functional connectivity features are presented on the left, while grey matter volume features are on the right. Colours represent the direction and magnitude of beta values. Warmer colours indicate higher positive betas, while cool colours represent lower betas. Higher absolute beta values (brighter colours) indicate increased contribution of the feature in the model. Note that model weights may not accurately represent univariate relationships between predictors and years to estimated symptom onset. (B) The predictive model derived from the PREVENT-AD training set significantly predicted years to estimated symptom onset in an independent PREVENT-AD testing set. (C) The model derived from the PREVENT-AD training set was generalized to cognitively normal and mild cognitive impairment individuals followed over time from the ADNI cohort. The more the ADNI individuals expressed the pattern predicting years to estimated symptom onset, the closer they were to clinical conversion. The pattern expression was normalized with a mean centre and unit variance of patients from the ADNI cohort. Due to the small sample size, the P-value is estimated using permutation testing (1000 samples without replacement).
Figure 4
Figure 4
Head-to-head comparison of three different models trained to predict years to estimated symptom onset. Each model was evaluated on unseen PREVENT-AD test data. Bars represent explained variance (r2 × 100) of each of the three models. 95% confidence intervals were generated through bootstrapping, and bootstrap tests were used to make empirical comparisons between models. Adding neuroimaging features to traditional clinical markers significantly improved the predictive power of the model. Imaging features alone performed significantly better than traditional clinical features alone. n.s. = not significant.

Comment in

References

    1. Ashar YK, Andrews-Hanna JR, Dimidjian S, Wager TD. Empathic care and distress: predictive brain markers and dissociable brain systems. Neuron 2016; 94: 1263–73.e4. - PMC - PubMed
    1. Ashburner J. A fast diffeomorphic image registration algorithm. Neuroimage 2007; 38: 95–113. - PubMed
    1. Badhwar A, Tam A, Dansereau C, Orban P, Hoffstaedter F, Bellec P. Resting-state network dysfunction in Alzheimer’s disease: a systematic review and meta-analysis. Alzheimer's & Dementia: Diagnosis, Assessment & Disease Monitoring 2017; 8: 73–85. - PMC - PubMed
    1. Bakker A, Krauss GL, Albert MS, Speck CL, Jones LR, Stark CE, et al.Reduction of hippocampal hyperactivity improves cognition in amnestic mild cognitive impairment. Neuron 2012; 74: 467–74. - PMC - PubMed
    1. Bateman RJ, Xiong C, Benzinger TLS, Fagan AM, Goate A, Fox NC, et al.Clinical and biomarker changes in dominantly inherited Alzheimer’s disease. N Engl J Med 2012; 367: 795–804. - PMC - PubMed

Publication types

MeSH terms

Substances