. 2018 Apr 23;19(4):1262.
doi: 10.3390/ijms19041262.

Erythropoietin Intensifies the Proapoptotic Activity of LFM-A13 in Cells and in a Mouse Model of Colorectal Cancer

Affiliations

Erythropoietin Intensifies the Proapoptotic Activity of LFM-A13 in Cells and in a Mouse Model of Colorectal Cancer

Anna Tankiewicz-Kwedlo et al. Int J Mol Sci. .

Abstract

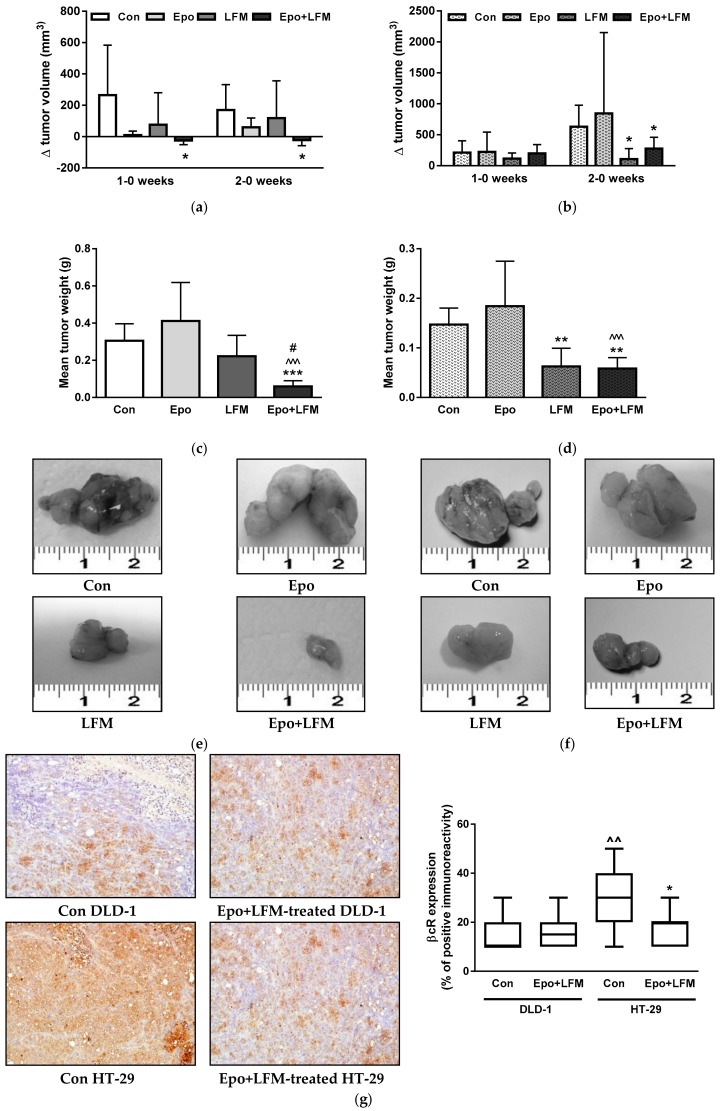
The Bruton’s tyrosine kinase (BTK) inhibitor LFM-A13 has been widely employed as an antileukemic agent, but applications in solid cancer have been found recently. The compound promotes apoptosis, has an antiproliferative effect, and increases cancer cell sensitivity to chemotherapy drugs. We decided to assess the impact of the simultaneous use of erythropoietin (Epo) and LFM-A13 on signal transduction in colon DLD-1 and HT-29 cells, as well as in tumor xenografts. The induction of apoptosis by Epo and LFM-A-13 in the cells was confirmed by phosphatidylserine externalization, loss of mitochondrial membrane potential, and modulation of the expression of apoptotic protein BAX and antiapoptotic protein BCL-2 in colon adenocarcinoma cells. Nude mice were inoculated with adenocarcinoma cells and treated with Epo and LFM-A13 in order to evaluate the degree of tumor regression. The simultaneous use of Epo and LFM-A13 severely inhibited cell growth, activated apoptosis, and also inhibited tumor growth in xenografts. The addition of Epo to LFM-A13 intensified the antiproliferative effect of LFM-A13, confirmed by the loss of mitochondrial membrane potential and the accumulation of apoptotic colon cancer cells with externalized phosphatidylserine (PS). These preclinical results suggest that the combination of Epo and LFM-A13 has a high proapoptotic activity and should be tested in the clinic for the treatment of solid tumors such as colon cancer.

Keywords: Bruton’s tyrosine kinase; LFM-A13; apoptosis; colon cancer; erythropoietin; xenografts.


Conflict of interest statement

The authors declare no conflict of interest.

Figures

Figure 1
Figure 1
Effects of erythropoietin β (Epo), LFM-A13 (LFM), and their combinations on colon cancer cells. Impact of LFM-A13 (LFM) on cell viability of DLD-1 cells (a) and HT-29 cells (b); * p < 0.05, ** p < 0.01 (versus control (Con)). Effect of erythropoietin β (Epo), LFM-A13 (LFM), and their combined activity on cell viability of DLD-1 (c) and HT-29 (d) colon cancer cells; * p < 0.05 (vs. Con), *** p < 0.001 (vs. Con); ^ p < 0.05 (vs. Epo), ^^^ p < 0.001 (vs. Epo); # p < 0.05 (vs. LFM-A13), ## p < 0.01 (vs. LFM-A13), ### p < 0.001 (vs. LFM-A13). Combination index (CI) analysis of erythropoietin (10–100 IU/mL) combined with LFM-A13 (10–100 µM) at a constant ratio in DLD-1 (e) and HT-29 (f) cells. Synergistic effects are defined as CI < 1, additive effects as CI = 1, and antagonistic effects as CI > 1.
Figure 1
Figure 1
Effects of erythropoietin β (Epo), LFM-A13 (LFM), and their combinations on colon cancer cells. Impact of LFM-A13 (LFM) on cell viability of DLD-1 cells (a) and HT-29 cells (b); * p < 0.05, ** p < 0.01 (versus control (Con)). Effect of erythropoietin β (Epo), LFM-A13 (LFM), and their combined activity on cell viability of DLD-1 (c) and HT-29 (d) colon cancer cells; * p < 0.05 (vs. Con), *** p < 0.001 (vs. Con); ^ p < 0.05 (vs. Epo), ^^^ p < 0.001 (vs. Epo); # p < 0.05 (vs. LFM-A13), ## p < 0.01 (vs. LFM-A13), ### p < 0.001 (vs. LFM-A13). Combination index (CI) analysis of erythropoietin (10–100 IU/mL) combined with LFM-A13 (10–100 µM) at a constant ratio in DLD-1 (e) and HT-29 (f) cells. Synergistic effects are defined as CI < 1, additive effects as CI = 1, and antagonistic effects as CI > 1.
Figure 2
Figure 2
Effect of erythropoietin β (Epo), LFM-A13 (LFM), and their combination on intracellular pathway and apoptosis. Immunoblotting analysis for: (a) phospho-JAK2 (pJAK2) and total JAK2 (tJAK2), phospho-AKT (pAKT) and total AKT (tAKT), phospho-MAPK (pMAPK) and total MAPK (tMAPK), BAX and BCL-2 in DLD-1 and HT-29 cells treated with erythropoietin β (Epo 100 IU/mL), LFM-A13 (LFM 100 µM), or their combination for 48 h. The samples used for electrophoresis consisted of 20 µg of protein from six pooled cell extracts (n = 6). (be) Band staining was quantified by densitometry; (b) pJAK/tJAK, (c) pAKT/tAKT, (d) pMAPK/tMAPK, (e) BAX/BCL-2 ratio the band intensities of the phospho-proteins are normalized with respect to the intensities of the respective total protein bands.
Figure 3
Figure 3
Effect of erythropoietin β (Epo), LFM-A13 (LFM), and their combinations on intracellular pathway and apoptosis. (a) Representative flow cytometry dot plots for Annexin V–FITC (fluorescein isothiocyanate) assay of DLD-1 and HT-29 cells incubated with Epo (Epo100, 100 IU/mL) and LFM-A13 (LFM100, 100 μM) for 48 h (mean ± SD; n = 3). The live cells appear at the lower left corner in the plots; the early apoptotic cells appear at the lower right corner; the necrotic cells appear at the upper left corner; the dead cells appear at the upper right corner. Left panel: The percentage of apoptotic DLD-1 cells incubated with Epo and LFM-A13 is shown in the bar diagram as mean ± SD (n = 3). Right panel: The percentage of apoptotic HT-29 cells incubated with Epo and LFM-A13 is shown in the bar diagram as mean ± SD (n = 3); * p < 0.05 (vs. Con), ** p < 0.01 (vs. Con), *** p < 0.001 (vs. Con); ^ p < 0.05 (vs. Epo), ^^^ p < 0.001 (vs. Epo); # p < 0.05 (vs. LFM-A13), ### p < 0.001 (vs. LFM-A13). (b) Representative dot plots presenting the loss of mitochondrial membrane potential (MMP) in DLD-1 and HT-29 cells incubated with Epo (Epo100, 100 IU/mL) and LFM-A13 (LFM100, 100 μM) for 48 h (mean ± SD; n = 3). Cells with normal MMP are shown on the right side of the plots, cells with decreased MMP on the left side of the plots. The graphs show the percent of cells with decreased mitochondrial membrane potential in DLD-1 (left panel) and HT-29 cells (right panel).
Figure 3
Figure 3
Effect of erythropoietin β (Epo), LFM-A13 (LFM), and their combinations on intracellular pathway and apoptosis. (a) Representative flow cytometry dot plots for Annexin V–FITC (fluorescein isothiocyanate) assay of DLD-1 and HT-29 cells incubated with Epo (Epo100, 100 IU/mL) and LFM-A13 (LFM100, 100 μM) for 48 h (mean ± SD; n = 3). The live cells appear at the lower left corner in the plots; the early apoptotic cells appear at the lower right corner; the necrotic cells appear at the upper left corner; the dead cells appear at the upper right corner. Left panel: The percentage of apoptotic DLD-1 cells incubated with Epo and LFM-A13 is shown in the bar diagram as mean ± SD (n = 3). Right panel: The percentage of apoptotic HT-29 cells incubated with Epo and LFM-A13 is shown in the bar diagram as mean ± SD (n = 3); * p < 0.05 (vs. Con), ** p < 0.01 (vs. Con), *** p < 0.001 (vs. Con); ^ p < 0.05 (vs. Epo), ^^^ p < 0.001 (vs. Epo); # p < 0.05 (vs. LFM-A13), ### p < 0.001 (vs. LFM-A13). (b) Representative dot plots presenting the loss of mitochondrial membrane potential (MMP) in DLD-1 and HT-29 cells incubated with Epo (Epo100, 100 IU/mL) and LFM-A13 (LFM100, 100 μM) for 48 h (mean ± SD; n = 3). Cells with normal MMP are shown on the right side of the plots, cells with decreased MMP on the left side of the plots. The graphs show the percent of cells with decreased mitochondrial membrane potential in DLD-1 (left panel) and HT-29 cells (right panel).
Figure 4
Figure 4
Effect of the combined activity of LFM-A13 and erythropoietin β on a mouse model of colorectal cancer. Impact on tumor volume in DLD-1 (a) and HT-29 (b) xenografts; 0—before substance administration, 1—after first week of substance administration, 2—after second week of substance administration. The results are presented as mean values ± SD, n = 5–10. Effect of the combined activity of LFM-A13 (10 mg/kg b.m.) and erythropoietin β (Epo, 600 IU/kg b.m.) on tumor weight in DLD-1 (c) and HT-29 (d) xenografts. The results are presented as mean values ± SD, n = 10. * p < 0.05 (vs. Con), ** p < 0.01 (vs. Con), *** p < 0.001 (vs. Con); ^ p < 0.05 (vs. Epo), ^^ p < 0.01 (vs. Epo), ^^^ p < 0.001 (vs. Epo); # p < 0.05 (vs. LFM-A13). Representative weights of the tumors dissected from the nude mice untreated or treated with Epo, LFM-A13, and Epo+LFM-A13 in DLD-1 (e) and in HT-29 (f). (g) Positive expression of βcR in the cytoplasm of colon cancer xenografts. Left panel: expression in control and Epo-LFM-A13-treated DLD-1 and HT-29 xenografts (H&E staining; magnification, ×200). Right panel: a box-and-whisker plot of percentage βcR expression in DLD-1 and HT-29 tumor xenografts. The results are presented as medians (minimum–maximum), n = 10, * p < 0.05 (vs. Con), ^ p < 0.05 (Con in DLD-1 vs. Con in HT-29 xenografts).
Figure 5
Figure 5
Human tumor xenografts in a nude mouse model. (a) Experimental plan. (b) Positive correlation between tumor volume and weight at mouse sacrifice (p < 0.0001, r = 0.828). Solid line—regression; dashed lines—95% confidence intervals for regression line.

Similar articles

Cited by

References

    1. Watson A.J. Apoptosis and colorectal cancer. Gut. 2004;53:1701–1709. doi: 10.1136/gut.2004.052704. - DOI - PMC - PubMed
    1. Zhang L., Yu J. Role of apoptosis in colon cancer biology, therapy, and prevention. Curr. Colorectal Cancer Rep. 2013;9 doi: 10.1007/s11888-013-0188-z. - DOI - PMC - PubMed
    1. D’Cruz O.J., Uckun F.M. Novel Bruton’s tyrosine kinase inhibitors currently in development. Onco-Targets Ther. 2013;6:161–176. doi: 10.2147/OTT.S33732. - DOI - PMC - PubMed
    1. Vassilev A., Ozer Z., Navara C., Mahajan S., Uckun F.M. Bruton’s tyrosine kinase as an inhibitor of the Fas/CD95 death-inducing signaling complex. J. Biol. Chem. 1999;274:1646–1656. doi: 10.1074/jbc.274.3.1646. - DOI - PubMed
    1. Uckun F.M., Zheng Y., Cetkovic-Cvrlje M., Vassilev A., Lisowski E., Waurzyniak B., Chen H., Carpenter R., Chen C.L. In vivo pharmacokinetic features, toxicity profile, and chemosensitizing activity of α-cyano-β-hydroxy-β-methyl-N-(2,5-dibromophenyl)propenamide (LFM-A13), a novel antileukemic agent targeting Bruton’s tyrosine kinase. Clin. Cancer Res. 2002;8:1224–1233. - PubMed