. 2018 Apr 25;16(1):45.
doi: 10.1186/s12915-018-0502-y.

Identification of a neuronal population in the telencephalon essential for fear conditioning in zebrafish

Affiliations

Identification of a neuronal population in the telencephalon essential for fear conditioning in zebrafish

Pradeep Lal et al. BMC Biol. .

Abstract

Background: Fear conditioning is a form of learning essential for animal survival and used as a behavioral paradigm to study the mechanisms of learning and memory. In mammals, the amygdala plays a crucial role in fear conditioning. In teleost, the medial zone of the dorsal telencephalon (Dm) has been postulated to be a homolog of the mammalian amygdala by anatomical and ablation studies, showing a role in conditioned avoidance response. However, the neuronal populations required for a conditioned avoidance response via the Dm have not been functionally or genetically defined.

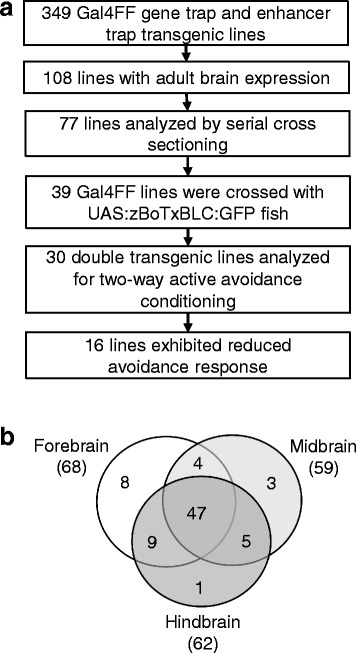
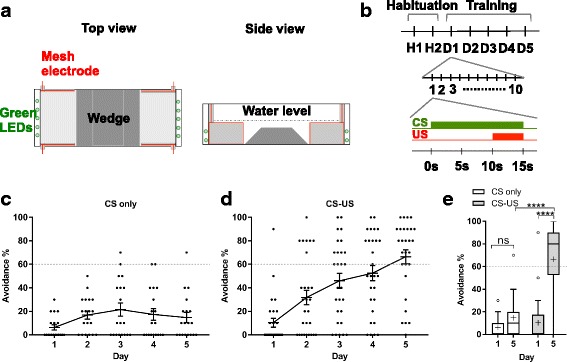
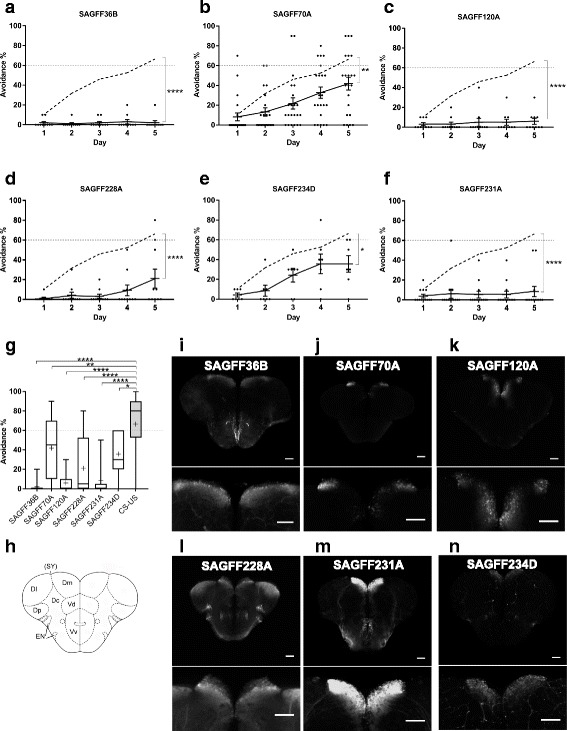
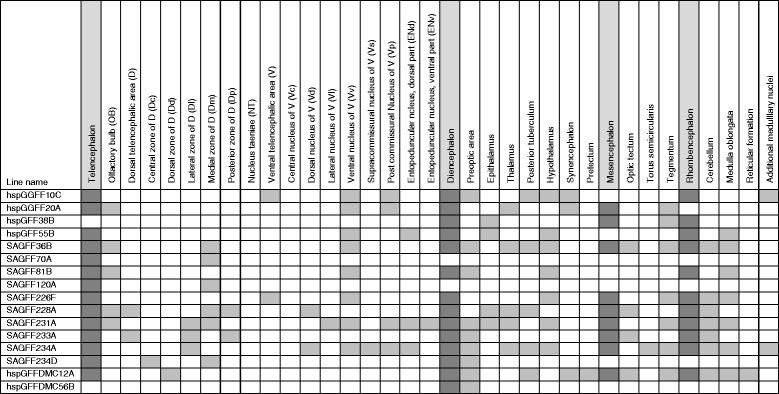
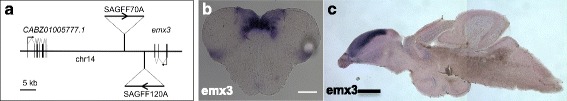
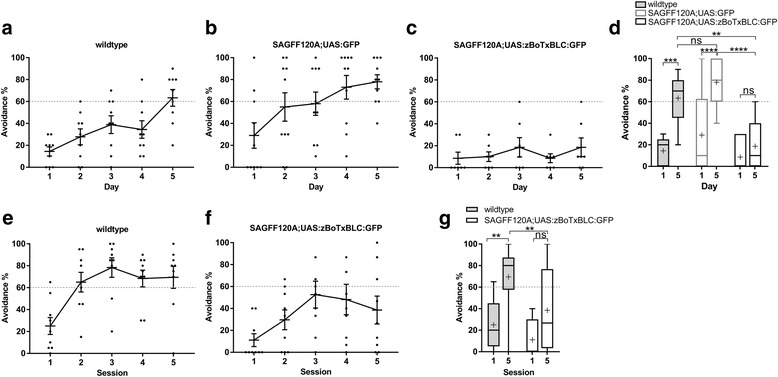
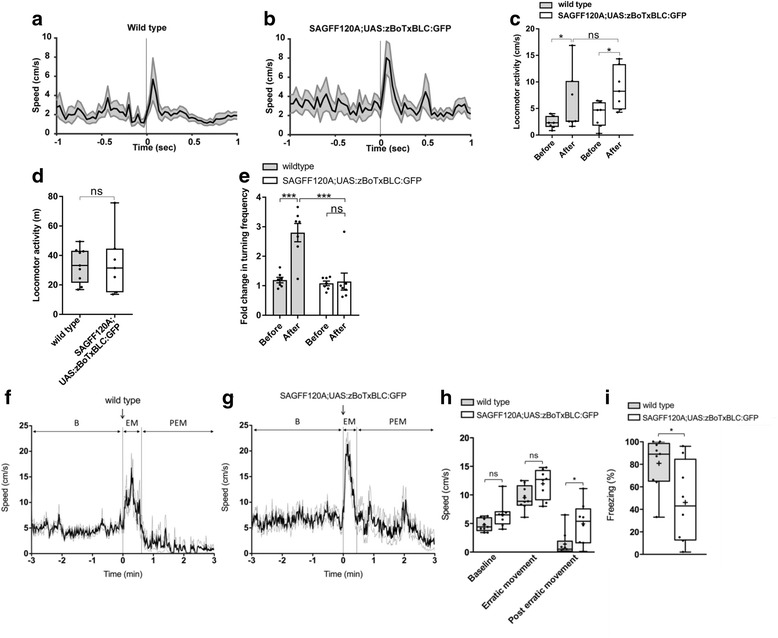
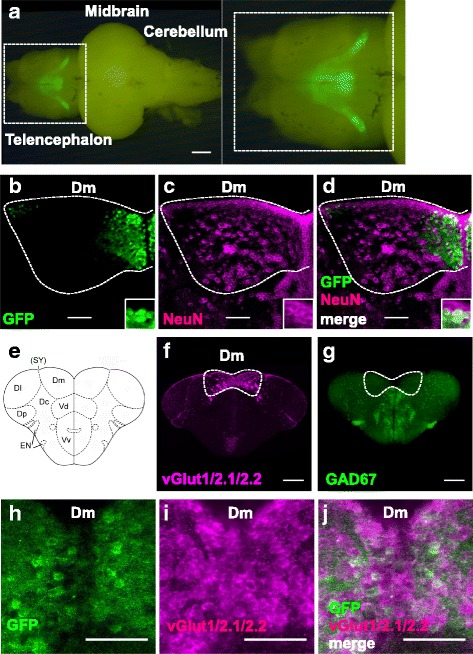
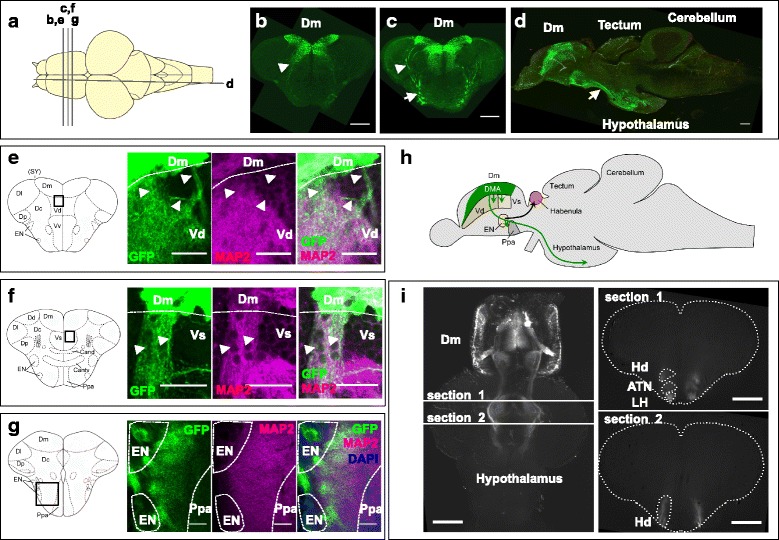
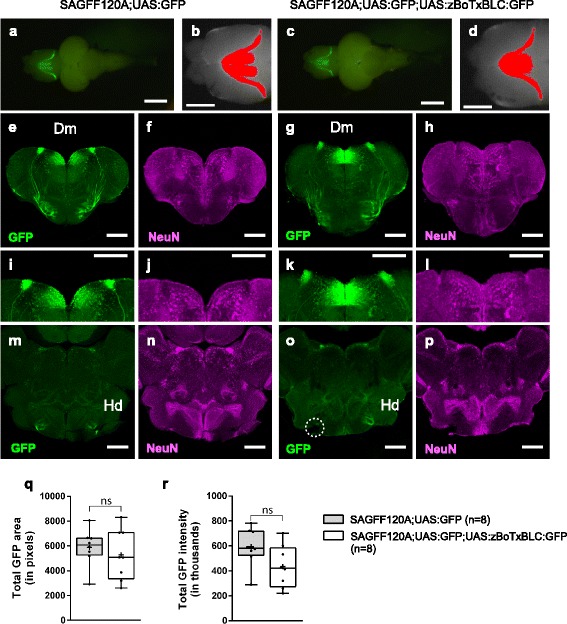
Results: We aimed to identify the neuronal population essential for fear conditioning through a genetic approach in zebrafish. First, we performed large-scale gene trap and enhancer trap screens, and created transgenic fish lines that expressed Gal4FF, an engineered version of the Gal4 transcription activator, in specific regions in the brain. We then crossed these Gal4FF-expressing fish with the effector line carrying the botulinum neurotoxin gene downstream of the Gal4 binding sequence UAS, and analyzed the double transgenic fish for active avoidance fear conditioning. We identified 16 transgenic lines with Gal4FF expression in various brain areas showing reduced performance in avoidance responses. Two of them had Gal4 expression in populations of neurons located in subregions of the Dm, which we named 120A-Dm neurons. Inhibition of the 120A-Dm neurons also caused reduced performance in Pavlovian fear conditioning. The 120A-Dm neurons were mostly glutamatergic and had projections to other brain regions, including the hypothalamus and ventral telencephalon.

Conclusions: Herein, we identified a subpopulation of neurons in the zebrafish Dm essential for fear conditioning. We propose that these are functional equivalents of neurons in the mammalian pallial amygdala, mediating the conditioned stimulus-unconditioned stimulus association. Thus, the study establishes a basis for understanding the evolutionary conservation and diversification of functional neural circuits mediating fear conditioning in vertebrates.

Keywords: Gal4-UAS; Pavlovian conditioning; amygdala; botulinum neurotoxin; dorsomedial telencephalon; enhancer trapping; fear conditioning; gene trapping; transposable element.


Conflict of interest statement

Ethics approval

This experiment was approved by the Institutional Animal Care and Use Committee (IACUC, approval identification number 27–2), and complied with the Guide for the Care and Use of Laboratory Animals of the IACUC.

Competing interests

The authors declare that they have no competing interests.

Publisher’s Note

Springer Nature remains neutral with regard to jurisdictional claims in published maps and institutional affiliations.

Figures

Fig. 1
Fig. 1
Identification of transgenic zebrafish with Gal4FF expression in the adult brain. a Outline of the genetic screen for transgenic fish with deficits in active avoidance fear conditioning. b Classification of GFP expression patterns in the selected 77 Gal4FF;UAS:GFP transgenic lines
Fig. 2
Fig. 2
Two-way active avoidance fear conditioning. a Shuttle box used for active avoidance conditioning. Top view (left) and side view (right). b Scheme for active avoidance conditioning. After habituation for 2 days, fish underwent 10 trials (with 25 ± 5 s intervals) per day over 5 consecutive days. In each trial, conditioned stimulus (CS; green LED) was presented followed by an unconditioned stimulus (US; electric shock) 10 s after CS, for 5 s; after this, both CS and US were turned off. If fish escaped during CS, then US was not given. c, d Performance of active avoidance response (%) of wild type fish treated only by CS (CS only: n = 19) (c) and by CS and US (CS-US: n = 28) (d). e Comparison of performance of active avoidance response of fish treated with CS only and with CS-US in Tukey box plot. Outliers are shown in open circles. Mean is marked by ‘+’. Two-way ANOVA, fish groups (CS-US wild type, CS-only wild type, and all double transgenic fish including fish described in Fig. 3 and Additional file 2: Figure S1) × training days (day 1, day 5), was performed (F = 7.236, P < 0.0001). Dunnett’s multiple comparison post-hoc tests were performed between CS-US and CS-only wild type fish on sessions on day 1 and day 5 (see also Fig. 3 and Additional file 2: Figure S1). The Student’s t test was performed on CS-US wild type fish between day 1 and day 5. ****P < 0.0001; ns, not significant
Fig. 3
Fig. 3
Gal4FF transgenic fish lines that showed deficits in the active avoidance response and had expression patterns in the Dm. af Performance of two-way active avoidance response of wild type fish (n = 28) (Fig. 2 and shown in dotted lines) and double transgenic fish that are created by crossing the Gal4FF transgenic fish with the UAS:zBoTxBLC:GFP fish. a SAGFF36B (n = 10). (b) SAGFF70A (n = 22). (c) SAGFF120A (n = 10). d SAGFF228A (n = 10). e SAGFF231A (n = 13). f SAGFF234D (n = 11). Means ± SEM and avoidance (%) for individual fish are plotted. g Comparison of performance of avoidance responses at day 5 with Tukey box plot. Mean is marked by ‘+’. Two-way ANOVA, fish groups (CS-US wild type, CS only wild type described in Fig. 2c, d and all double transgenic fish including fish described in Additional file 2: Figure S1) x training days (day 1, day 5), was performed (F = 7.236, P < 0.0001). Dunnett’s multiple comparison post-hoc tests were performed between wild type and double transgenic fish on day 5. *P < 0.05, **P < 0.01, ***P < 0.001, and ****P < 0.0001. ns, not significant (P > 0.05). h A coronal view of the zebrafish telencephalon. Dm, medial zone of dorsal telencephalic area (D); Dl, lateral zone of D; Dc, central zone of D; Dp, posterior zone of D; SY, sulcus ypsiloniformis; Vd, dorsal nucleus of ventral telencephalic area (V); Vv, ventral nucleus of V; EN, entopeduncular nucleus. in GFP expression patterns in the coronal section of the Gal4FF;UAS:GFP transgenic fish with magnified views of Dm. The Gal4FF transgenic fish are crossed with UAS:GFP effector fish. i SAGFF36B. j SAGFF70A. k SAGFF120A. l SAGFF228A. m SAGFF231A. n SAGFF234D. Scale bars, 200 μm
Fig. 4
Fig. 4
Gal4FF expression patterns in the brain of 16 transgenic lines that showed a deficit in active avoidance fear conditioning. A summary of GFP expression patterns of the Gal4FF transgenic lines (crossed with the UAS:GFP fish) that showed deficits in active avoidance fear conditioning when crossed with the UAS:zBoTxBLC:GFP fish (Additional file 2: Figures S1 and Additional file 3: and Figure S2). The brain are divided into four major regions (telencephalon, diencephalon, mesencephalon, and rhombencephalon), and further subdivided mainly according to Wullimann et al. [59]. Shadowed boxes indicate regions where GFP expression was detected under an epifluorescence microscope
Fig. 5
Fig. 5
SAGFF70A and SAGFF120A are enhancer trap lines of the emx3 gene. a Transposon integration sites in the SAGFF70A and SAGFF120A transgenic fish. b, c In situ hybridization analysis of the adult brain using the emx3 probe. b Coronal section, scale bar 200 μm. c Sagittal section, scale bar 500 μm
Fig. 6
Fig. 6
ad Performance of two-way active avoidance responses of wild type, SAGFF(LF)120A;UAS:GFP, and the SAGFF120A;UAS:zBoTxBLC:GFP fish in blind experiments. Wild type fish (n = 9) (a), SAGFF(LF)120A;UAS:GFP fish (n = 10) (b), and SAGFF120A;UAS:zBoTxBLC:GFP fish (n = 7) (c) were analyzed for active avoidance fear conditioning under blind conditions, in which the fish identities were not known to the experimenter. Sibling fish were used for SAGFF120A;UAS:GFP and SAGFF120A;UAS:zBoTxBLC:GFP. Means ± SEM and avoidance (%) for individual fish are plotted. d Comparison of performance of avoidance responses at days 1 and 5 in Tukey box plot. Mean is marked by ‘+’. Two-way ANOVA, genotype (wild type, double transgenic) × trial number (day 1, day 5) (F = 9.082, P = 0.0005), and Tukey’s multiple comparison post-hoc tests were performed (**P < 0.01, ***P < 0.001, ****P < 0.001; ns, not significant). Both wild type and SAGFF(LF)120A;UAS:GFP fish exhibited active avoidance. SAGFF120A;UAS:zBoTxBLC:GFP fish showed a significantly reduced performance. ef Performance of the active avoidance response in 1-day conditioning. One session was composed of 20 trials and five sessions were conducted within 1 day. Wild type fish (n = 9) could perform avoidance responses and SAGFF120A;UAS:zBoTxBLCGFP fish (n = 9) showed reduced performance. Means ± SEM and avoidance (%) for individual fish are plotted. Two-way ANOVA, genotype (wild type, double transgenic) × trial number (S1, S5) (F = 12.05, P = 0.0015), and Tukey’s multiple comparison post-hoc tests were performed (**P < 0.01)
Fig. 7
Fig. 7
Behavioral analyses of the SAGFF120A;UAS:zBoTxBLC:GFP fish. ac The light response of wild type (n = 7) (a) and the SAGFF120A;UAS:zBoTxBLC:GFP (n = 7) (b) fish. Means ± SEM are plotted. c The maximum locomotor activities 100 ms before (Before) and after (After) light-on are plotted with Tukey box plot. Wilcoxon signed rank test was performed for the same group (P = 0.0313 for wild type and P = 0.0156 for SAGFF120A;UAS:zBoTxBLC:GFP fish). Mann–Whitney U test was performed between two groups (P = 0.2086 for “Before”, P = 0.2593 for “After”). ns, not significant. d Comparison of the locomotor activity of wild type (n = 9) and SAGFF120A;UAS:zBoTxBLC:GFP (n = 7) fish with Tukey box plot. The Mann–Whitney U test was performed (P = 0.8372). e Pavlovian fear conditioning. Wild type fish (n = 7) showed increased turning activities in response to CS after conditioning. SAGFF120A;UAS:zBoTxBLC:GFP (n = 7) fish showed significantly reduced turning activities. Mean ± SEM and individual values are plotted. Two-way ANOVA, genotype (wild type, double transgenic) × conditioning (before, after) (F = 16.10, P = 0.0005), and Tukey’s multiple comparison post-hoc tests were performed (***P < 0.001). fi The alarm response of wild type (n = 9) (f) and SAGFF120A;UAS:zBoTxBLC:GFP fish (n = 8) (g). (f, g) The speed of fish before and after addition of the skin extract. Mean ± SEM are plotted. The locomotor activities were divided into three phases; B (before addition of the skin extract), EM (erratic movement), and PEM (post-erratic movement). h Comparison of the speeds during B, EM, and PEM with Tukey box plot. Mean is marked by ‘+’. Unpaired t-test with Welch’s correction was performed (*P < 0.05). i Comparison of freezing during PEM. Mean is marked by ‘+’. Unpaired t-test with Welch’s correction was performed (*P < 0.05.)
Fig. 8
Fig. 8
Immunohistochemical analyses of the 120A-Dm neurons. a Fluorescence imaging of the brain of SAGFF120A;UAS:GFP fish from the dorsal side. Dm, medial zone of the dorsal telencephalic area. Scale bars, 500 μm. bd Double immunofluorescence staining of the telencephalon of SAGFF120A;UAS:GFP fish using the anti-GFP (green) (b) and anti-NeuN (magenta; neuronal marker) (c) antibodies. d A merged image; 16% (1986/12282) of NeuN-positive cells were GFP-positive and 99% (2394/2423) of GFP-positive cells were NeuN-positive. e A coronal view of the zebrafish telencephalon. Dm, medial zone of dorsal telencephalic area (D); Dl, lateral zone of D; Dc, central zone of D; Dp, posterior zone of D; SY, sulcus ypsiloniformis; Vd, dorsal nucleus of ventral telencephalic area (V); Vv, ventral nucleus of V; EN, entopeduncular nucleus. f Fluorescence in situ hybridization using the vglut1/2.1/2.2 probes. g Fluorescence in situ hybridization using the GAD67 probe. hj Immunofluorescence staining of the telencephalon of SAGFF120A;UAS:GFP fish using anti-GFP (green) (h) and fluorescence in situ hybridization using vglut1/2.1/2.2 probes (magenta) (i). j A merged image; 94% (352/374) of GFP-positive cells were glutamatergic. Scale bars, 200 μm (f, g) and 50 μm (bd, hj)
Fig. 9
Fig. 9
Projections of 120A-Dm neurons. a Dorsal view of the brain. The positions of the sections are shown as bars (bg). bd Immunofluorescence staining using anti-GFP. b, c Coronal sections of SAGFF70A;UAS:GFP;UAS:zBoTxBLC:GFP fish. d Sagittal section of SAGFF120A;UAS:GFP;UAS:zBoTxBLC:GFP fish. Axons of the 120A-Dm neurons project to the hypothalamus area. Arrowheads in b and c indicate projections from two groups of the 120A-Dm neurons. Arrows in c and d indicate the lateral forebrain bundle. eg Double immunofluorescence staining using anti-GFP (green) and anti-MAP2 (magenta; dendritic marker) of the brain of SAGFF120A;UAS:GFP fish. Schemes of coronal views of the telencephalon are shown on the left. e Projections to Vd. f Projections to Vs. e, f Arrowheads mark projections that were not co-stained with anti-MAP2. g Projections to the neuropil area of EN and Ppa. Cell bodies in EN and Ppa were stained with DAPI (blue). Dm, medial zone of dorsal telencephalic area (D); Dl, lateral zone of D; Dc, central zone of D; Dp, posterior zone of D; SY, sulcus ypsiloniformis; Vd, dorsal nucleus of ventral telencephalic area (V); Vv, ventral nucleus of V; EN, entopeduncular nucleus; Ppa, Parvocellular preoptic area; Cand, Commissura anterior, pars dorsalis; Cantv, Commissura anterior, pars ventralis. h A schematic view of axonal projections of the 120A-Dm neurons (green) to Vd, Vs, EN, Ppa, and the hypothalamus. i Light-sheet microscopy of a cleared brain from the SAGFF120A;UAS:GFP fish. Horizontal section (left) and coronal sections (right) showed projections of the 120A-Dm neurons terminated in the lateral hypothalamic nucleus (LH), the anterior tuberal nucleus (ATN), and dorsal zone of periventricular hypothalamus (Hd). Scale bars, 200 μm (bd), 50 μm (e, g), 25 μm (f), and 500 μm (i)
Fig. 10
Fig. 10
GFP expression patterns in SAGFF120A;UAS:GFP and SAGFF120A;UAS:GFP;UAS:zBoTxBLC:GFP fish. ad GFP fluorescence in the dorsal view of the brains from SAGFF120A;UAS:GFP (~10 months old; #4 in Additional file 8: Figure S4) (a, b) and SAGFF120A;UAS:GFP;UAS:zBoTxBLC:GFP (~10 months old; #4 in Additional file 8: Figure S4) fish (c, d). Areas having more GFP intensity than background (the maximum intensity measured in the posterior part of the telencephalon) were identified by using ImageJ [57] and shown in red (b, d). cp Immunohistochemistry using anti-GFP (green; e, g, i, k, m, o) and anti-NeuN (a neuronal marker, magenta; f, h, j, l, n, p). Coronal sections of the telencephalon (el) and the hypothalamus (mp) of SAGFF120A;UAS:GFP (e, f, i, j, m, n) and SAGFF120A;UAS:GFP;UAS:zBoTxBLC:GFP (g, h, k, l, o, p) fish. il Magnified images of eh. GFP-positive cells in Dm, and projections from these cells to the target area in Hd (dorsal zone of periventricular hypothalamus) were detected. A dotted circle in o indicated a broken part. Scale bars: 1 mm (a, c), 500 μm (b, d), and 200 μm (ep). qr Comparisons of total GFP intensity (q) and area (r) data obtained by ImageJ analysis of SAGFF120A;UAS:GFP (n = 8) and SAGFF120A;UAS:GFP;UAS:zBoTxBLC:GFP (n = 8) fish (Additional file 8: Figure S4) are plotted with Tukey box plot. Unpaired t-test with Welch’s correction was performed between these transgenic fish (ns, not significant)

Similar articles

Cited by

References

    1. LeDoux JE. Emotion circuits in the brain. Annu Rev Neurosci. 2000;23:155–184. doi: 10.1146/annurev.neuro.23.1.155. - DOI - PubMed
    1. Maren S. Neurobiology of Pavlovian fear conditioning. Annu Rev Neurosci. 2001;24:897–931. doi: 10.1146/annurev.neuro.24.1.897. - DOI - PubMed
    1. Sah P, Faber ES, Lopez De Armentia M, Power J. The amygdaloid complex: anatomy and physiology. Physiol Rev. 2003;83(3):803–834. doi: 10.1152/physrev.00002.2003. - DOI - PubMed
    1. Martinez-Garcia F, Novejarque A, Lanuza E. The evolution of the amygdala in vertebrates. In: Kaas JH, editor. Evolutionary Neuroscience. Cambridge, MA: Academic Press; 2009. pp. 313–392.
    1. Marek R, Strobel C, Bredy TW, Sah P. The amygdala and medial prefrontal cortex: partners in the fear circuit. J Physiol. 2013;591(10):2381–2391. doi: 10.1113/jphysiol.2012.248575. - DOI - PMC - PubMed

Publication types

Substances

LinkOut - more resources