. 2018 May 16;38(20):4678-4694.
doi: 10.1523/JNEUROSCI.0434-18.2018. Epub 2018 Apr 24.

Striatal Direct and Indirect Pathway Output Structures Are Differentially Altered in Mouse Models of Huntington's Disease

Affiliations

Striatal Direct and Indirect Pathway Output Structures Are Differentially Altered in Mouse Models of Huntington's Disease

Joshua Barry et al. J Neurosci. .

Abstract

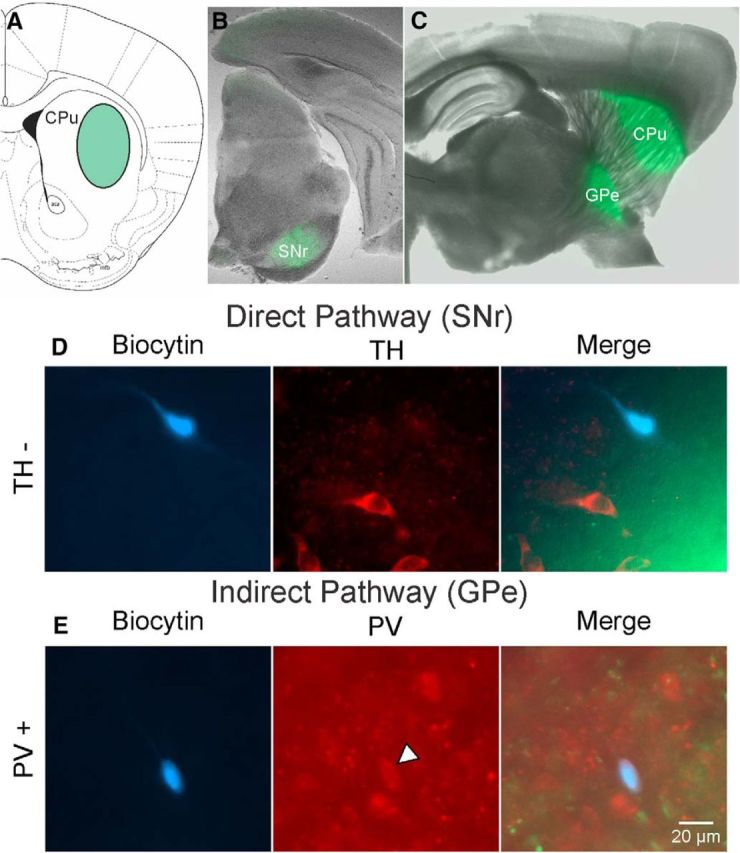
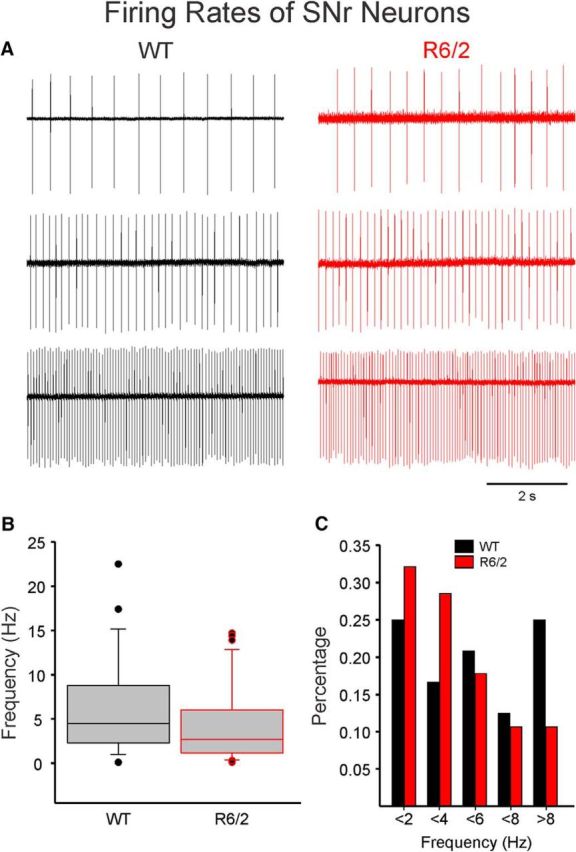
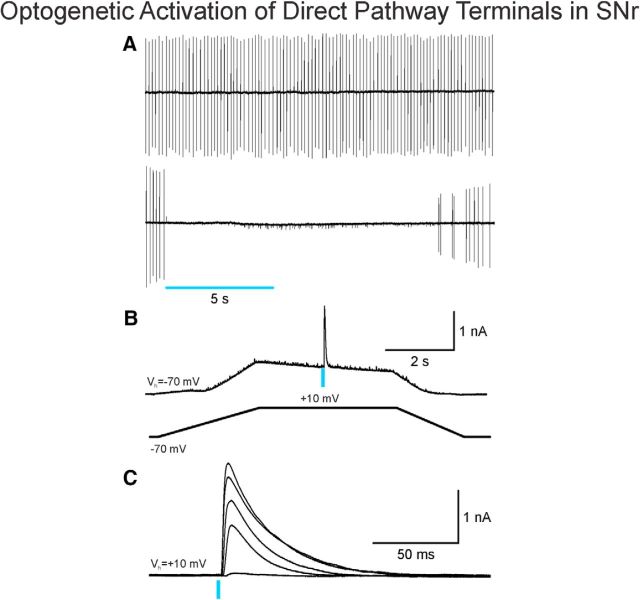
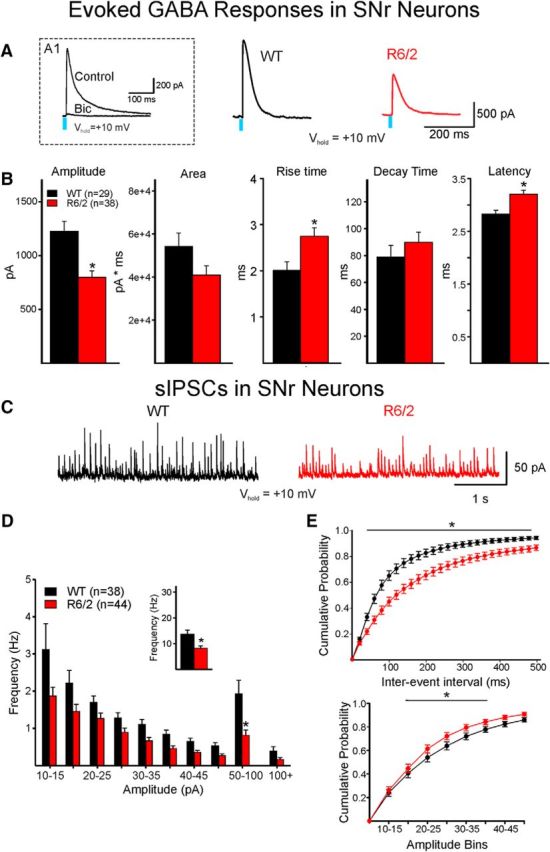
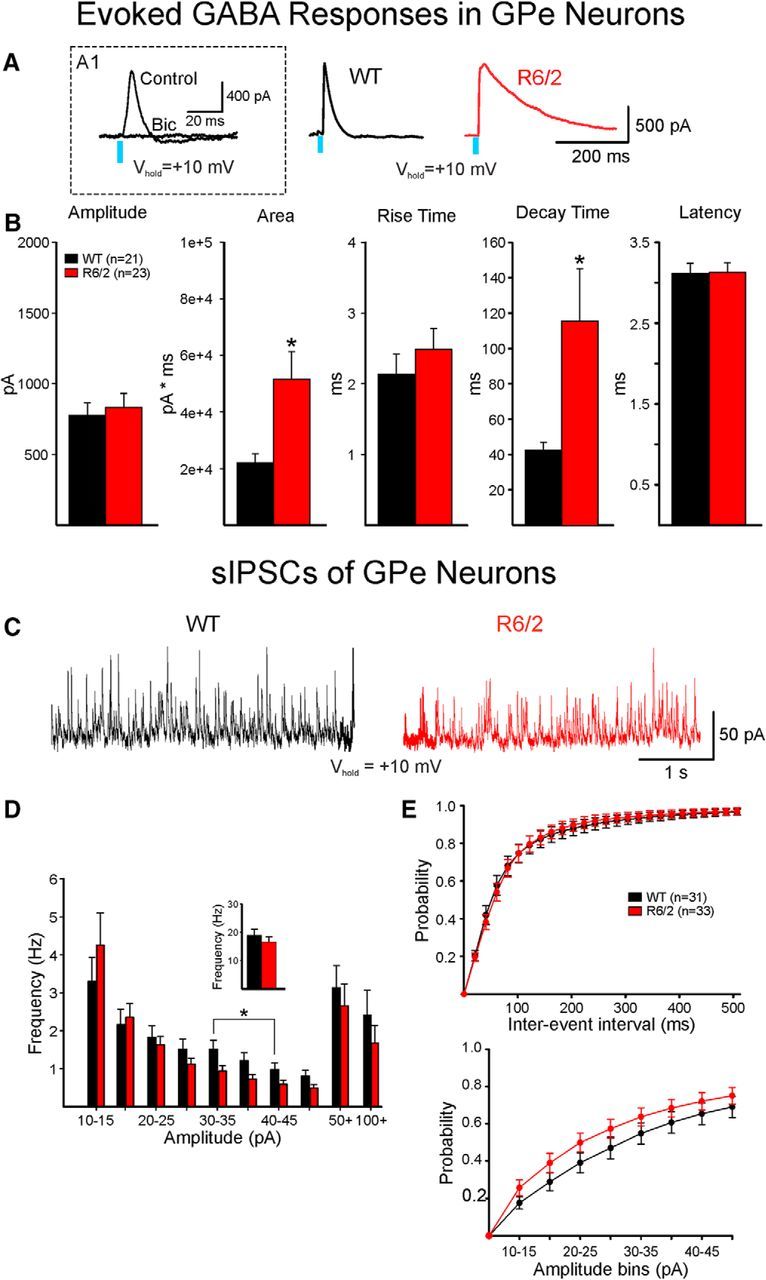
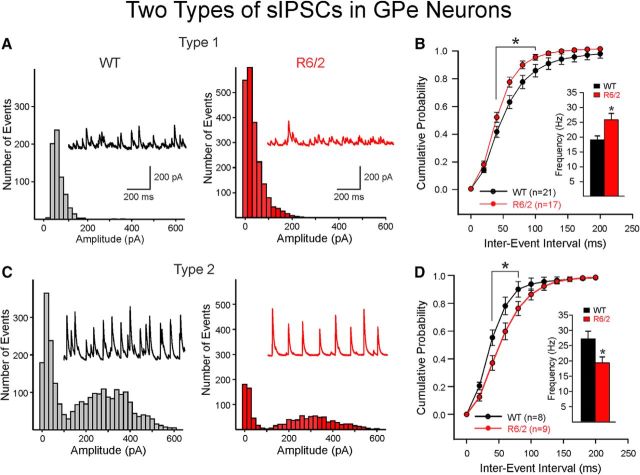
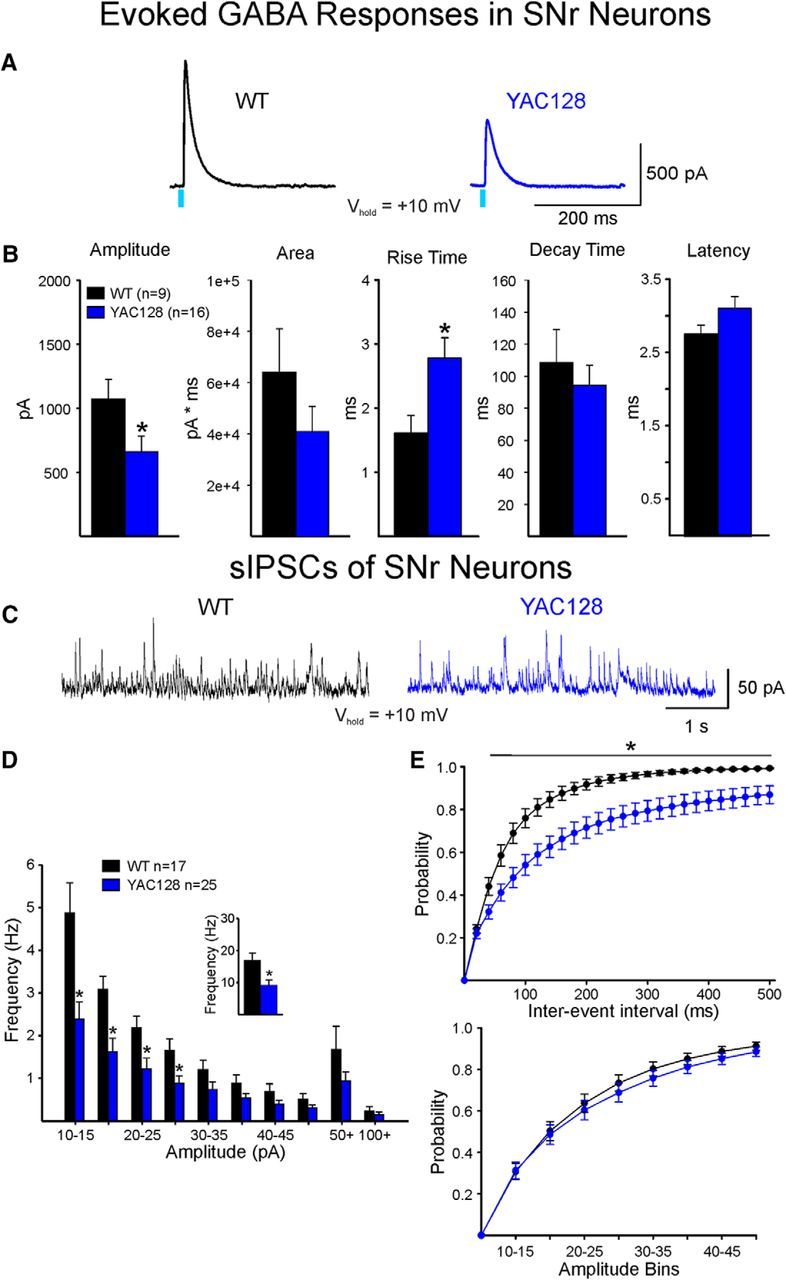
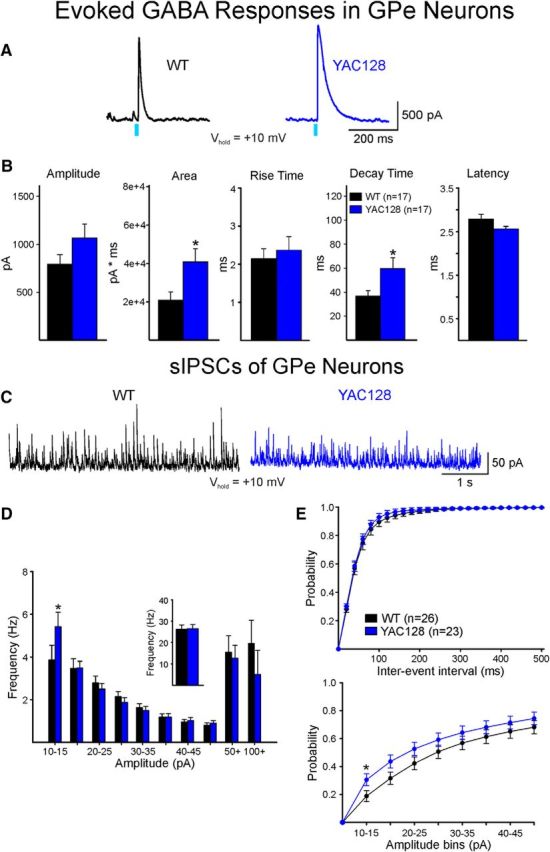
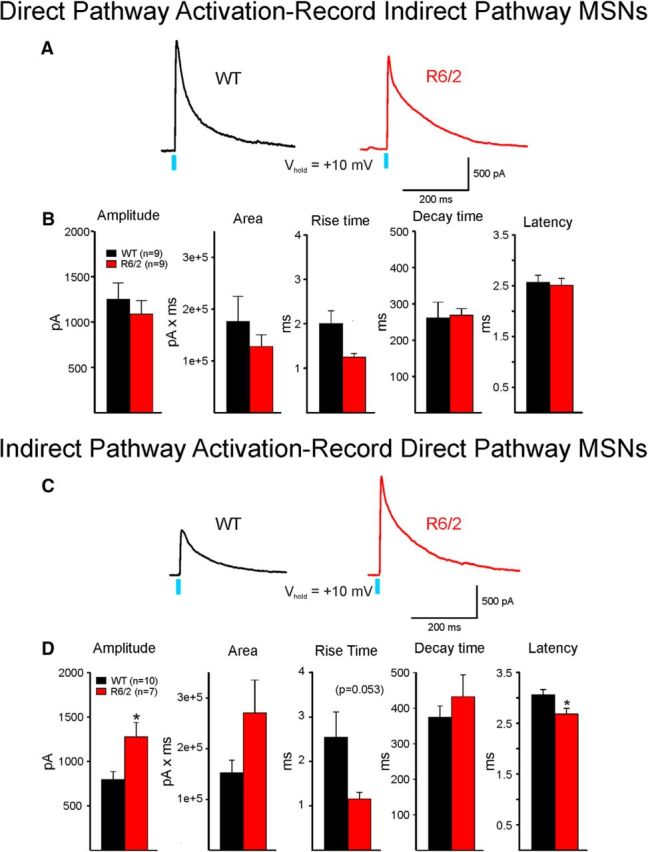
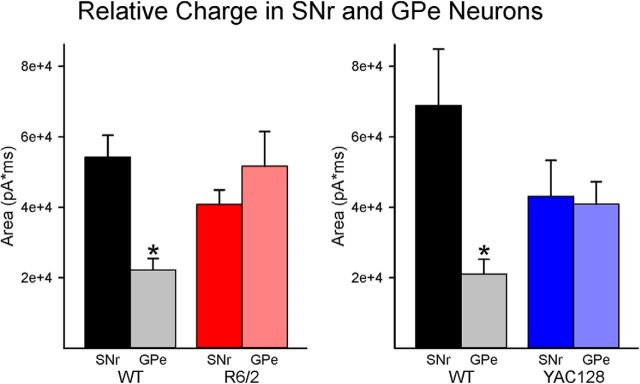
The present study examined synaptic communication between direct and indirect output pathway striatal medium-sized spiny neurons (MSNs) and their target structures, the substantia nigra pars reticulata (SNr) and the external globus pallidus (GPe) in two mouse models of Huntington's disease (HD). Cre recombination, optogenetics, and whole-cell patch-clamp recordings were used to determine alterations in intrinsic and synaptic properties of SNr and GPe neurons from both male and female symptomatic R6/2 (>60 d) and presymptomatic (2 months) or symptomatic (10-12 months) YAC128 mice. Cell membrane capacitance was decreased, whereas input resistance was increased in SNr neurons from R6/2, but not YAC128 mice. The amplitude of GABAergic responses evoked by optogenetic stimulation of direct pathway terminals was reduced in SNr neurons of symptomatic mice of both models. A decrease in spontaneous GABA synaptic activity, in particular large-amplitude events, in SNr neurons also was observed. Passive membrane properties of GPe neurons were not different between R6/2 or YAC128 mice and their control littermates. Similarly, the amplitude of GABA responses evoked by activation of indirect pathway MSN terminals and the frequency of spontaneous GABA synaptic activity were similar in HD and control animals. In contrast, the decay time of the evoked GABA response was significantly longer in cells from HD mice. Interestingly, activation of indirect pathway MSNs within the striatum evoked larger-amplitude responses in direct pathway MSNs. Together, these results demonstrate differential alterations in responses evoked by direct and indirect pathway terminals in SNr and GPe leading to striatal output imbalance and motor dysfunction.SIGNIFICANCE STATEMENT Previous work on Huntington's disease (HD) focused on striatal medium-sized spiny neurons (MSNs) almost exclusively. Little is known about the effects that alterations in the striatum have on output structures of the direct and indirect pathways, the substantia nigra pars reticulata (SNr) and the external segment of the globus pallidus (GPe), respectively. We combined electrophysiological and optogenetic methods to examine responses evoked by selective activation of terminals of direct and indirect pathway MSNs in SNr and GPe neurons in two mouse models of HD. We show a differential disruption of synaptic communication between the direct and indirect output pathways of the striatum with their target regions leading to an imbalance of striatal output, which will contribute to motor dysfunction.

Keywords: Huntington's disease; electrophysiology; external globus pallidus; optogenetics; substantia nigra; synaptic activity.


Figures

Figure 1.
Figure 1.
Striatal viral injection/expression and recorded cell types in SNr and GPe. A, Coronal section (bregma, anteroposterior 0.98 mm) (Franklin and Paxinos, 1997) showing the injection site of AAV2-DIO-ChR2-EYFP in the dorsolateral striatum (green oval). B, EYFP expression in SNr of a D1-Cre mouse. C, EYFP expression in striatum (injection site) and GPe (recording site) of D2-Cre mouse. D, Left, Biocytin-filled cell recorded in the SNr (blue cell). Middle, Immunofluorescence with TH antibody shows several stained cells. Right, Overlay shows the absence of TH fluorescence in the biocytin-filled cell, indicating that it was not DA-producing. Right, Green EYFP fluorescence indicates the site of termination of direct pathway axons. E, Left, Cell recorded in the GPe and filled with biocytin (blue cell). Middle, Immunostaining using anti-PV antibody demonstrates many neurons in GPe express PV, including the recorded neuron (arrowhead). Right, Overlay shows the biocytin-filled neuron expressing PV. Light green EYFP fluorescence from indirect pathway MSN terminals is also shown. Calibration applies to all panels in D, E.
Figure 2.
Figure 2.
Firing rates of SNr neurons. A, SNr neurons were recorded in cell-attached mode. Most neurons displayed rhythmic firing at low, medium, and high frequencies. B, Box-and-whisker plots represent the median frequency (Hz) of SNr neurons from WT and R6/2 mice. The frequencies were not significantly different. C, Histogram of percentage of cells firing at different frequencies. In R6/2 mice, more cells with lower firing rates were encountered. However, the difference was not statistically significant.
Figure 3.
Figure 3.
Optogenetic activation of direct pathway terminals disrupts firing of SNr neurons. A, Top, SNr neuron firing rhythmically was recorded in cell-attached mode. Bottom, A 5 s blue light pulse (470 nm, 1 mW) completely inhibited firing. Firing resumed several seconds after the light pulse was discontinued. B, A ramp voltage command (from −70 to 10 mV, bottom) was used to increase the driving force of activation of GABAA receptors. To completely isolate GABA responses, the external solution also contained glutamate receptor antagonists (NBQX and AP-5). A blue light pulse (470 nm, 0.5 ms, 1 mW) evoked a large GABA response at 10 mV. C, The amplitude of the GABA response increased proportionally as light intensity increased (from 0.5 to 5 mW, 1/30 s frequency).
Figure 4.
Figure 4.
Optically evoked and spontaneous GABA synaptic currents in SNr neurons. A, GABA responses were evoked by optical stimulation of terminals of direct pathway neurons in WT and R6/2 mice. A1, Inset, The response was almost completely blocked by bicuculline (10 μm), demonstrating that it was specifically mediated by activation of GABAA receptors. Right, Traces show that the amplitude of the GABA response in an SNr neuron from an R6/2 mouse was decreased compared with the response of an SNr neuron from a WT mouse. B, Bar graphs represent significant differences in mean response amplitude (decreased), mean rise time (increased), and mean latency (increased) in SNr neurons from R6/2 compared with WT mice. Although mean response area was decreased, the difference did not reach statistical significance, possibly due to a small, nonsignificant mean increase in decay time. C, Sample traces of sIPSCs in cells from WT and R6/2 mice. Both frequency and amplitude were decreased in the R6/2 neuron. D, Amplitude-frequency histogram showing that the sIPSC frequency in SNr cells from R6/2 mice was significantly reduced across multiple amplitude bins. Inset, The average frequency of sIPSCs in R6/2 cells was significantly decreased. E, Cumulative IEI distributions of sIPSCs (top) show significantly higher percentage of short intervals (i.e., higher frequency) in WT compared with R6/2 neurons. In contrast, a higher percentage of low-amplitude sIPSCs (15–35 pA) occurred in R6/2 compared with WT neurons (bottom). *p < 0.05.
Figure 5.
Figure 5.
Optically evoked and spontaneous GABA synaptic currents in GPe neurons. A, GABA responses were evoked by optical stimulation of terminals of indirect pathway neurons in WT and R6/2 mice. A1, Inset, The response was completely blocked by bicuculline (10 μm), demonstrating that it was specifically mediated by activation of GABAA receptors. Right, Traces show that the duration of the GABA response in a GPe neuron from an R6/2 mouse was markedly increased compared with the response of a GPe neuron from a WT mouse. B, Bar graphs show that the mean areas and decay times of the responses were significantly increased in GPe neurons from R6/2 mice. Mean amplitudes, rise times, and latencies were unchanged. C, Samples of sIPSC traces recorded in WT and R6/2 mice. D, Although the amplitude-frequency histogram (left) showed significant reduction in frequency in the 30–45 pA amplitude bins, this reduction was offset by an increased frequency of small-amplitude synaptic events. Inset, No difference in mean IPSC frequency between R6/2 and WT GPe neurons. E, The cumulative IEI and amplitude distributions were similar. *p < 0.05.
Figure 6.
Figure 6.
GPe neurons displayed two patterns of sIPSCs. A, Type 1 cells displayed unimodal amplitude-frequency histograms with low-amplitude, randomly occurring synaptic events. B, Cumulative IEI distributions of Type 1 cells from R6/2 mice have significantly more short-interval events (higher frequency) compared with those of WT cells. Inset, Mean frequencies of sIPSCs in R6/2 Type 1 neurons were significantly greater than those of Type 1 WT cells. C, Type 2 cells displayed bimodal amplitude-frequency histograms with small and semirhythmic large-amplitude events. D, Cumulative IEI distributions show that cells from WT mice have significantly more short-interval events compared with R6/2 cells. Inset, Mean sIPSC frequency of Type 2 cells was significantly decreased in R6/2 compared with WT cells. Thus, the two types of sIPSCs in GPe neurons changed in opposite directions in R6/2 mice. *p < 0.05.
Figure 7.
Figure 7.
Optically evoked and spontaneous GABA synaptic currents in SNr neurons from WT and symptomatic YAC128 mice. A, GABA responses were evoked by optical stimulation of terminals of direct pathway neurons in WT and symptomatic YAC128 mice. Right, Traces show that the amplitude of the GABA response in a SNr neuron from a YAC128 mouse was decreased compared with the response of a SNr neuron from a WT mouse, similar to results obtained in R6/2 mice. B, Bar graphs represent significant differences in mean response amplitude (decreased) and mean rise time (increased) in SNr neurons from YAC128 compared with WT mice. Mean latency was increased, but the difference was not significant. Although mean response area was decreased, the difference did not reach statistical significance. C, Sample traces of sIPSCs in cells from WT and YAC128 mice. Frequency was decreased in the YAC128 neuron. D, Amplitude-frequency histogram showing that the sIPSC frequency in SNr cells from YAC128 mice was significantly reduced across multiple amplitude bins (Bonferroni post hoc tests yielded p values of <0.001, <0.001, 0.011, and 0.04 for 10–15, 15–20, 20–25, and 25–30 pA, respectively). Inset, Mean frequency of sIPSCs in YAC128 cells was significantly decreased. E, Cumulative IEI distributions of sIPSCs (top histograms) show significantly higher percentage of short intervals (i.e., higher frequency) in WT compared with YAC128 neurons. Cumulative amplitude histograms were similar in WT and YAC128 SNr neurons (bottom histograms). *p < 0.05.
Figure 8.
Figure 8.
Optically evoked and spontaneous GABA synaptic currents in GPe neurons from WT and symptomatic YAC128 mice. A, GABA responses were evoked by optical stimulation of terminals of indirect pathway neurons in WT and YAC128 mice. Right, Traces show that the duration of the GABA response in a GPe neuron from a YAC128 mouse was increased compared with the response of a GPe neuron from a WT mouse. B, Bar graphs show that area and decay time were significantly increased in GPe cells from symptomatic YAC128 mice. There also was a significant decrease in latency. C, Sample traces of sIPSCs in GPe neurons from WT and YAC128 mice. D, The amplitude-frequency histogram shows that, although there is a significant increase in small-amplitude sIPSCs, this increase is offset by a reduction in large-amplitude events. In consequence, the mean frequencies were similar (inset). E, Top, Cumulative interevent histograms were similar. Bottom, there was only one amplitude bin (10–15 pA) that was significantly increased. *p < 0.05.
Figure 9.
Figure 9.
Intrastriatal communication between direct and indirect pathway MSNs. A, GABA responses evoked by optical stimulation of intrastriatal direct pathway terminals were recorded in nonfluorescent, putative indirect pathway MSNs from WT and R6/2 mice. B, Bar graphs represent that no significant differences in mean amplitude, area, rise times, decay times, or latency occurred. C, GABA responses evoked by optical activation of intrastriatal indirect pathway terminals were recorded in nonfluorescent, putative direct pathway MSNs from WT and R6/2 mice. D, Bar graphs represent that the amplitude of the response was significantly increased in direct pathway MSNs from R6/2 mice. The area also was increased, but the difference did not reach statistical significance (p = 0.07). The increase in rise time was almost statistically significant, whereas the latency was significantly reduced. The decay times were similar. *p < 0.05.
Figure 10.
Figure 10.
Relative charge in SNr and GPe. The relative charge carried by chloride ions through GABAA receptors (expressed as area under the curve) after activation of direct and indirect pathway terminals in SNr and GPe neurons was compared in WT and HD mice. In WTs, the relative charge in SNr was >2 times greater than in GPe, which is more conducive to movement. In contrast, in HD mice, this relationship was disrupted so that the relative charges were more similar, which could decrease the potential for movement and lead to bradykinesia. *p < 0.05.

References

    1. Abdi A, Mallet N, Mohamed FY, Sharott A, Dodson PD, Nakamura KC, Suri S, Avery SV, Larvin JT, Garas FN, Garas SN, Vinciati F, Morin S, Bezard E, Baufreton J, Magill PJ (2015) Prototypic and arkypallidal neurons in the dopamine-intact external globus pallidus. J Neurosci 35:6667–6688. 10.1523/JNEUROSCI.4662-14.2015 - DOI - PMC - PubMed
    1. Akopian G, Barry J, Cepeda C, Levine MS (2016) Altered membrane properties and firing patterns of external globus pallidus neurons in the R6/2 mouse model of Huntington's disease. J Neurosci Res 94:1400–1410. 10.1002/jnr.23889 - DOI - PMC - PubMed
    1. Albin RL, Reiner A, Anderson KD, Dure LS 4th, Handelin B, Balfour R, Whetsell WO Jr, Penney JB, Young AB (1992) Preferential loss of striato-external pallidal projection neurons in presymptomatic Huntington's disease. Ann Neurol 31:425–430. 10.1002/ana.410310412 - DOI - PubMed
    1. Allen KL, Waldvogel HJ, Glass M, Faull RL (2009) Cannabinoid (CB(1)), GABA(A) and GABA(B) receptor subunit changes in the globus pallidus in Huntington's disease. J Chem Neuroanat 37:266–281. 10.1016/j.jchemneu.2009.02.001 - DOI - PubMed
    1. Beaumont V, Zhong S, Lin H, Xu W, Bradaia A, Steidl E, Gleyzes M, Wadel K, Buisson B, Padovan-Neto FE, Chakroborty S, Ward KM, Harms JF, Beltran J, Kwan M, Ghavami A, Häggkvist J, Tóth M, Halldin C, Varrone A, et al. (2016) Phosphodiesterase 10A inhibition improves cortico-basal ganglia function in Huntington's disease models. Neuron 92:1220–1237. 10.1016/j.neuron.2016.10.064 - DOI - PubMed

Publication types

MeSH terms